Tuesday, December 9, 2014

Index Futures

It's a hard call as they continue to look very bad, in addition, often very tight, dull looking price ranges are where we see the heaviest underlying activity, all of the Index futures look like this...
All still have deep leading negative divergences like ES above and all have SUPERR TIGHT ranges, very strange and manipulated looking.

We'll see where they lead, but if I hadn't seen the 3C charts of the averages, I'd say we are looking at a significant decline to the downside overnight starting soon.

Daily Wrap

Since we already have so much on the table and you've seen all of the important charts numerous times, I'm going to try to keep this short as I'm going on 13 hours now without so much as a break for food.

The Index futures are a bit surprising in how ugly they look, much like last night or last Friday/Sunday leading to Sunday/Monday's sharp decline creating a short term oversold condition or selling climax that was worked off the rest of the week on a flag-like bounce that got ugly again in to the end of last week.

The market averages all look like they are turning, negative in the 1-2 min timeframes, maybe about inline at 3 minutes and positive at 5 min from this mornings divegrence, in other words the process of migration of negative divergences has started and it is moving, however it has not had enough time to reach the more important 5 min charts which is why I suspected some more upside or at least a lateral reversal process (or "M" "n" shaped- a rounding top or range top). I will say without hesitation the IWM/Russell 2000 looks to be the most advanced in this reversal back toward the negative which isn;'t surprising, especially if market makers and specialists were the reason for the gap fill so they could unload inventory from higher levels to prevent a loss as the Chinese overnight action would have likely been a surprise fundamental even that they could not prepare for in advance, thus needing a gap fill to unload those positions.

In addition, HYG was clearly used early today and even through out the rest of the day to support the intraday market trend , then the short squeeze picked up steam among the small caps which is easily spotted as the market moves straight line fashion with no pullbacks. This is why I'm a bit surprised the 1 min index futures look this bad tonight, the 5 or 7 min charts I could understand, however the short term would seemingly need to finish the reversal process of distribution and migration of the 3C divegrence to the 5 min charts.

XLK/Tech and XLF/Financials are also showing the same kind of negative, advancing trend, but not quite there to the 5 min charts yet.

VXX is also improving, but not quite there yet as they didn't have that much time after the gap fills.


Intraday breadth via TICK held up with the market trend today, no big surprises there, it was a bit more positive than I would have expected given the negative divergences starting.

After the European close, it "appears" as if the BOJ may have intervened in the FX market, ramping the USD/JPY off the sub-118 lows, which also lifted risk / equities until a short squeeze among the most shorted index kicked in, mostly small caps. I say the Bank of Japan may have intervened because the USD/JPY move off the a.m. lows was an impressive 170 pips. This was also a "V" shaped bottom, meaning it didn't have the time to put in a strong enough 3C positive divegrence to lift stocks on their own, THAT'S THE POINT OF THE REVERSAL PROCESS, RATHER THAN A REVERSAL EVENT.

YOU CAN ALMOST ALWAYS SPOT A SHORT SQUEEZE AS THERE'S ALMOST NO PULLBACKS OR CORRECTIONS AND VOLUME DIMINISHES ON THE MOVE UP.


I will say, even though I think there were other reasons, last night's Dominant Price Volume Relationship along with Industry group performance was short term oversold with the highest probability of a close higher today, while I doubt that was the reason most of the averages closed well, the R2K + 1.79% with a Bullish Engulfing Candlestick today, the SPX only off by -0.02% and a bullish hammer, the NDX +.38%, almost a bullish engulfing candle and the Dow -0.29% on a bullish hammer.

All of the candlesticks suggest the same thing the 3C charts do, that this move is not quite done, except for maybe the Russell 2000 or at least it looks probable to rotate out to the under-performer rather than the leader.

Today's Dominant Price/Volume Relationship would likely mean more if there were no fundamental surprises overnight, however there isn't a dominant theme among the averages. The Dow has 15 stocks (dominant) at Close Down/Volume Up , combined with the bullish hammer, this highly suggests the Dow-30 see additional upside tomorrow. 

The NDX-100 had no dominant relationship, the Russell 2000's Dominant Relationship was 1044 stocks (dominant) and Close Up/Volume Up, the most bullish of the 4 relationships, but ironically the one that is most likely to produce a red close the next day on a short term overbought condition, which fits with IWM charts.

The SPX also had no Dominant theme, but did have a bullish Hammer and on volume making it 3-4x more likely to be an effective candlestick. The same is true of the Dow and the Russell 2000, each with bullish closing candlesticks on an increase in volume making them 3-4 times more likely to be effective short term reversal candles (to the upside), which is why the index futures look / charts tonight is so strange.

Of the 9 S&P sectors, 4 of 9 closed green with Energy leading and Healthcare lagging, this is not a dominant relationship or indication of short term oversold/overbought.

Of the 238 Morningstar groups we track we had a similar 158 of 238 closing green, yet again not an indication of a short term oversold/overbought condition.

Based on the charts less the index futures, my best would be additional upside tomorrow which starts to turn and offers some nice short entries, one of the reasons I held off on AAPL today which closed on a very bullish candle as well and increasing volume making it more probable to be effective as a candlestick signal, which I'd love.

The SPX/RUT Ratio indicator was supportive intraday today, not surprising given the RUT's performance on a short squeeze in small caps. The indicator on a wider basis is still significantly negative (shown in last night's Daily Wrap).

While VIX was basically in line, VXX did show better relative performance in to the close (Short term VIX futures).

While the VIX closed above the Bollinger Bands, it also closed near the lows of the day.

As mentioned earlier in the day, HYG was used to help ramp the market and was perfectly in lock step until about 1 p.m. when the short squeeze was firmly in place, HYG continued to add support, but it's relative performance vs the earlier morning correlation suffered a bit. I'd think that if a short squeeze would get the job done, why buy HYG and be in a position of having to take losses?

Pro sentiment indicators were split with one in line with the market and the second failing to make as much as a higher high the entire day. Again, this kind of split makes me feel there's likely more upside, but it is likely to fade and turn to a reversal process, offering some nice short sale entries, that is if Index futures don't dump overnight as they oddly look like they may.

5 year yields were in line with the market and supportive intraday, thus gaining, while the 30 year yields were negatively divergent on the day, but down 9 bps points on the week, The Treasury Yield curve is now at its flattest since 2009.

Gold as we saw with positive Futures divergences Sunday night continue to add gains today with +2.08% in GLD and SLV up +3.88%, I'll post updates on these tomorrow as the daily closing candles were not only gapped up, but had long upper wicks (higher intraday prices rejected) and on volume, making both look like they saw some short term churning today and may be ready for a move lower.

USO also gained +1.21% on the day, we'll continue to monitor that one for a possible trade, whether a short squeeze or a wider, healthier base or even an opportunity to trade it short, we'll see what the market is offering and go from there.

SKEW is still elevated, about $137 and in the red zone.

Finally today added the 4th Hindenburg Omen of 5 days, a substantial cluster (some are calling it 5 days now), in an case, while it's not an indicator I put a lot of faith in as a Black Swan indicator, it was showing a cluster like now at the September highs leading to the October lows so I suspect tomorrow, if we have any price strength which I suspect we will, despite what futures look like, it will likely be best used shorting in to strength, such as AAPL which I updated today.

I'll bring you anything else that develops so long as my eyes are open. Time for some food!


Futures Tonight

As I said in the post last night, futures are very ugly right now including or specifically Index futures. If today's short squeeze sponsored gap fill was about letting market makers and specialists unload inventory held at Friday's levels on a fundamental surprise out of China last night, then it is entirely conceivable that they have unloaded inventory and the next break may not be so lucky as to get a gap fill.

Honestly I expected a bit more upside or at least range bound lateral trade tomorrow before any downside, but futures, even though 1 min which is a short timeframe over a long night, as I said last night, are very ugly like last night leading to a very ugly pre-market and open this morning followed by an almost immediate positive divegrence, I don't think this was the buy the dip crowd, I think it was institutionally sponsored and my best guess is that it was done to let market makers and specialists alleviate themselves of rather larger losses if they were holding a pretty decent supply of inventory as usual from Friday's closing levels.

The USD/JPY also looks at risk, not only because of the 3C chart of the pair, but because of the $USDX short term and the macro negative $USD trend as well as the macro Yen positive trend.

The only thing that doesn't quite fit yet is treasury bonds (30 year) look like they could pullback a bit more.

I won't rush to judgement, but as many of you know, I've been comparing the market to a nice pier over the ocean, beautifully appointed on the deck, but below the pilings holding the pier up are rotten to the core and all it will take is some energy like a wave to take the whole structure down. The market's breadth, Leading indicators and 3C indicators all suggest the same analogy for the market.

As for futures...
 USD/JPY positive divergence this morning at the lows of the week (plus) with a positive divegrence and a negative divegrence forming now.

 $USDX 1 min negative.

The EUR/USD is positive looking on the same timeframe, Euro strength would cause additional $USD weakness.

$USDX 30 min larger trend (say after a bounce or consolidation), continues to look like the macro trend of a lower $USD is still in the works and not far off.

 $USDX 4 hour macro trend from a positive/inline up trend in the $USDX and 3C to a negative divegrence suggesting the $USD see downside as part of a macro trend.

 The Yen 1 min is in line, but it was in line last night too and gained in the overnight session, sending USD/JPY lower.

The 30 min Yen futures (/6J) looks to be the exact opposite of the 30 min $USDX , also suggesting a larger macro trend of $USD/JPY down which  would be in line with massive de-leveraging of the carry trade. Interestingly as noted Friday, CITI believes the Yen is due some significant upside as one of the most overcrowded short trades out there. Again, this would suggest USD/JPY weakness and de-leveraging of the carry cross- not good for the broad equity averages.


And the 4 hour Yen macro trend, is the opposite of the $USDX
 a very clear, strong Yen 4 hour positive divegrence, again in line with $USDX macro weakness and USD/JPY de-leveraging.

 ES 1 min is ugly, like last night- to the left is the positive divegrence off the intraday lows in the a.m., it's not that large.

TF/Russell 2000 futures 1 min is also quite ugly right now with the same intraday low positive divegrence sending it higher with the help of HYG and then a short squeeze among the Most Shorted Stocks, now a deep leading negative divegrence in to the overnight session.

 NQ in line with the 3C trend down in the overnight/early a.m. session with a positive divegrence during the cash market lows and a deep leading negative divegrence that has been in effect since this afternoon.

 Looking to the 5 min charts for additional guidance, ES shows the very negative trend of late last week/last night, the positive divegrence at the lows and an in line signal at the green arrows, not positive, not negative, simply in line for now, but the 1 min could migrate to the 5 min and turn it to a more clearly negative divergence.

 NQ/NASDAQ 100 futures 5 min with the same negative Friday in to last night and the same in line signal now, not leading positive or negative, simply in line.

TF/Russell 2000 futures is the one 5 min chart that IS leading negative tonight.

ES 7 min with a sharp leading negative last week in to this week and simply in line since, no positive at the lows as this is a stronger timeframe.

Once again TF/Russell 2000 futures 7 min are leading negative, while NQ 7 min is inline just like ES. This TF chart (1-7 minutes) suggests overnight downside in to tomorrow.

ES 60 min leading negative, this is the change in character I have talked so much about recently and that change in character leading to  changes in trends as the SPX sits at a head fake high just on top of a large broadening / megaphone top which it broke under on the open today.

I'll update futures as they develop...

Testy, Testy, Futures Get REAL UGLY Again

Just like last Friday 11/28 and Sunday 11/30 before the open as futures dropped rapidly right in to Monday morning's open. Again last Friday December 5th and overnight last night (Sunday) Index futures looked real ugly; when I saw futures pre-market down as much as they were,  it wasn't a surprise considering how ugly they were Sunday night, Sunday Night Index Futures
 

Once again tonight, they are looking just as ugly and if I'm correct about today's short squeeze being used to get market makers and specialists back to even as the open would have had them holding inventory from Friday's close at deep losses, then perhaps we are about to see something a lot uglier that sicks considering market makers and specialists have filled the gap and were able to rid themselves of inventory at higher levels.

I'll post the charts in just a few minutes 

What Actually Happened Today?

It seems early in the overnight carnage seen this morning pre-market that caused a fairly substantial gap down in the equity markets, the main stream financial press was initially blaming all of this on the crashing price of oil which was ironic given that oil was up at the time.

Like I often say, the Financial media make their living selling ads and the demand from retail or mom and pop investors is a need to understand why a complex system such as the stock market acted the way it did, even though the event has already passed, is discounted and largely irrelevant, call it the fear of the unknown or misunderstood, so millions of people tune in to media like CNBC for a 30 second sound bit of why the market acted the way it did, it's just people's desire to feel like they have some control in a system that is vastly beyond their understanding and even further removed from their control. Thus the 30-second sound bites as to why the market acted the way it did and the early financial media's attempt to blame "Falling oil prices", despite the fact they were up this morning!

What happened actually happened overnight in China causing the biggest 1-day drop in the Shanghai Composite since August of 2009, a -5.4% decline which many may rationalize as an overdue pullback due to the extraordinary gains in the same market over recent months, up nearly +50% since July despite falling real estate prices and clear indications of a economic slowdown. However, this had NOTHING to do with what actually happened.

To understand what happened, you have to understand a little about the term you've probably heard many times, but never quite understood, "THE SHADOW BANKING SYSTEM". While the Chinese actions were specific to a particular part of shadow banking, I'll "TRY" to provide a reasonable definition without turning this in to a term paper with cliff notes.

Most people associate credit, borrowing and other activities with traditional depository lending/banking institutions that are heavily regulated, that have access to Central Bank funds, have safety nets such as Federal Deposit Insurance and debt guarantees. However, a large portion of numerous financial transactions are carried out by the Shadow Banking System which in it's most elementary form would be considered financial intermediaries that do not accept deposits like traditional banks and as such are not regulated or are far less regulated.

These Shadow Banks are financial intermediaries that facilitate credit creation across the global financial system, but generally are not subject to regulatory oversight, however the Shadow Banking system can include regulated banks performing unregulated activities. Shadow Banking institutions are largely considered unregulated because they do not accept deposits like a traditional bank and as such are not subject to the same regulations. 

Some of the more "traditional" definitions of Shadow Banking institutions include: Hedge Funds, Credit Hedge Funds, Private Equity Funds, Money Market Funds, Credit Investment Funds, Structured Investment Vehicles, Securities Broker Dealers, Credit Insurance Providers, Securitization Finance companies and Mortgage companies.

Some of the services provided may be as basic as serving as a financial intermediary, for instance say an Institutional Investor like a Pension Fund that is willing to lend money and a Corporation that is looking to borrow money; these institutions serve as the intermediary either making a direct fee or the difference between the interest rates from the lender to the borrower.

Some of the other areas they are involved in include: Securitization vehicles, Asset Backed Commercial paper, Money Market Mutual Funds, create markets for repo-Repurchase Agreements, Unlisted Derivatives and other Unlisted Instruments, Credit Default Swaps, matching borrowers and lenders and providing longer term mortgages, student loans, car loans and extend credit to individuals or organizations that would otherwise not be credit worthy.

Because they do not accept deposits to avoid being regulated, they often rely on short term funding by asset backed commercial paper and/or repo agreements

It's generally accepted that these Shadow Banks do not have banking licenses, they do not accept deposits and as such are not subject to the same or any financial regulations unlike traditional depository institutions. This often allows them to extend more competitive rates, they often take far greater credit and liquidity risks and operate at higher levels of leverage without the capital requirements that are normally commensurate with these risks for regulated institutions.

However, there are so many global activities across broad spectrums that many transactions are intertwined with traditional depository/regulated institutions in transactions that are OBS (Off Balance Sheet) for the regulated institution and their activities that are OBS (Off Balance Sheet) are not visible to regulators or common investors. It is said that Shadow Banking institutions rival that of regulated, traditional depository banks, however the Bank for International Settlements (BIS- otherwise known as the Central Banks' bank) have said, 'Regulated banks are the largest Shadow Banks" via Off Balance Sheet transactions.

It is widely accepted that shadow banking was a primary cause of the 2007-20012 financial crisis as Shadow Banking Institutions served a large role in Sub-Prime. Even traditional depository banks were involved in large sub-prime lending via Off Balance Sheet Transactions. 

Hopefully it is clear by now that although there are true Shadow Banking operations and a lot of them, it's difficult to separate traditional regulated banks from the Shadow Banking industry either because of their relationships and intermingling in unregulated activities or their own direct Off Balance Sheet Shadow Banking activities. It hopefully is also clear what kinds of systemic risks Shadow Banking creates and the systemic dangers via the involvement of traditional banks through contagion.

The F_E_D has warned numerous times that the next Financial Crisis will be a direct result of the Shadow Banking Industry. In fact it is fairly well known that the credit and liquidity freeze of the 2008 financial crisis was largely a freeze among shadow banking entities in the wake of Lehman.

Last night's actions out of China seem to be an effort to reign in credit as part of broader reforms and perhaps pop the equity bubble by aggressively going after sources of funding for stock and bond market speculation. 

China's securities clearing house for their two equity markets issued new regulations curbing the type of assets that they'd accept for repo (repurchase) agreements that typically last between a period of overnight to 182 days and have been used largely to finance stock buys. Specifically targeted were corporate/government bonds which have spiraled out of control in recent years, with a rating of AAA or lower or sold by issuers graded as lower than AA , making this type of collateral ineligible for repo agreements/short term financing. After the massive decline (ultimately -5.4%, the PBOC tried to stabilize the market by intervening in FX markets, setting a stronger CNY fix which is PBoC tightening. However, USD/CNY actually saw its largest intra-day rise since 2008.

According to some estimates, the new collateral rules would disqualify approximately $125 trillion Yuan of outstanding corporate issues listed on China's two exchanges, approximately 60% of all outstanding , listed Corporate Bonds on China's 2 exchanges (approx. $202 bn $USD).

By comparison, the US's two largest custodian banks of repoable assets, State Street and Bank of New York, hold a combined total of approximately $55 trillion in assets or approximately three times the market cap of the S&P-500 (repoable securities). Imagine what any move by these two banks might do to the markets if the restriction of a mere $202 billion of Chinese repo assets sent the Shanghai Composite down 5.4% in a single day, the largest decline in a single day since August of 2009.

FB Update

I'm going to put out a more comprehensive FB update as it is one of our long term core short positions. I expect some near term volatility., but if you are a longer term position trader, FB is looking very interesting, I'm glad it's one of our core shorts and if I could, I'd absolutely be adding to it in the near future.

For a quick look, these are the macro trends or the strongest underlying flow of funds and they are moving out of FB as the F_E_D's Yellen herself slammed social media stocks along with biotechs, although that would be the very last reason I'd consider a FB short.

After FB's initial IPO which was a disaster and FB quickly became one of the most hated stocks, we were the first to go long FB at the very lows around late August 2012 and made a nice 30-300% for our trouble (some of you played long calls)

Here are some of the better reasons to look at the core short...
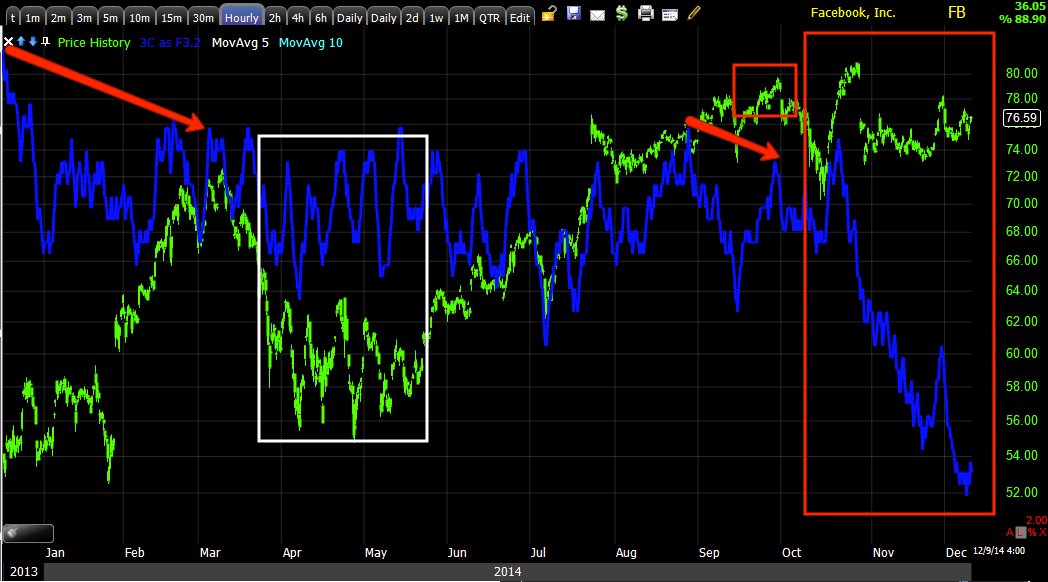
 This is a long term multi-day (2) 3C chart showing distribution and some accumulation at several areas, but by far the recent flat-ish top looking trend has seen some of the deepest 3C distribution FB has ever seen, in addition to the point that it clearly looks like a stage 3 top.

 The VERY strong, but more detailed 1-day chart shows FB distribution in to early 2014 highs and the pullback, but FB never recovered or saw the kind of accumulation needed to support additional gains and rather it looks to have turned to a stage 3 top with 3C again at all time leading negative lows, less money flow than when FB was $25!

 This 60 min chart of FB grabbed my attention, but there's more analysis than just this, however if you are not one to be caught up in the details and are looking at the larger trend and can trade that trend, FB is looking very ripe for a short sale, add to position or even a partial position that is added to.

Whatever the case may be, I suspect a year from now you'd be very happy having entered FB short in the area, however I will cover it in more detail as stage 3 tops often have a lot of volatility and it can be useful for entries.

As for my custom Trend Channel, the first custom indicator I created based on the Turtle Traders and their concepts and the first indicator I won an award for... you can see to the far left how the Trend Channel self-adjusts to a stocks's most recent volatility, keeping as much of the trend as possible which was almost all of 2013 and a good portion of 2014 after the negative divergence and pullback around the Q1 highs.

The current stop out for this trend is at $108 on a closing basis, below that and FB is very likely to start a new trend, just a downtrend which is in line with out core short position and longer term 3C charts.

More to come on FB...

AAPL Trade Idea Update

This is an update to one of several posts for an AAPL trade set up, the last was Dec. 5th, AAPL Trade Set-Up Update, this is from 12/3 AAPL Trade Idea Follow Up, and the original idea from 12/2, AAPL Trade Set-up

I didn't get the set-up I was hoping for, but as AAPL progressed, the second place set up, increasingly negative divergences started to take over.

I'd like to see AAPL on a bit more price strength and just a bit more 3C weakness to enter as a short, but if you are looking at the big picture, you may find it attractive here with a bit of a wider stop or maybe even a partial entry, filling out the rest either on slightly higher prices or worsening divergences.
 This is what I was hoping for, a head fake move above the symmetrical triangle which technical traders would have bought on a breakout as the price pattern carries no bullish or bearish bias like the right angle triangles (descending and ascending), but it does carry a bias according to the preceding trend in to the triangle which was up. Since we already had negative divergences, a head fake above the apex of the triangle would have been a fantastic short sale entry, we did get a small move, but I was really looking for a bit more.

The 60 min chart shows AAPL in line with an uptrend at the green arrow (trade long /stay long or out-but don't short there) and then an increasingly negative 3C divegrence, which is the motive behind the trade set up with a head fake move being the entry.

As time passed, some of the shorter to intermediate term divergences got worse and I considered AAPL as a short based on those, but still wanted to see more considering I wasn't getting a price / risk concession on a head fake move.

This is the 5 min chart, you can see how it clearly deteriorated with distribution and how AAPL, the most heavily weighted stock on the NASDAQ 100 was used today to ramp the QQQ/NDX.

This 5 min chart is still in a leading position, but shorter negative timeframes are migrating toward the 5 min and it should go negative, but until it does, I', willing to be patient and if it does make a little move higher and the 5 min goes negative, I'd consider that an entry. For longer term traders, you might consider it a short here and now and I'll show you why based on the Trend Channel.

 As mentioned above, short term timeframes are falling apart like the intraday 1 min which is leading negative.

The 2 min trend, with about in line today.

A closer look shows it is seeing migration from the 1 min chart and starting to lead negative. I'd like to see this hit the 5 min chart if price moves higher or stays in the area.

 The 3 min chart with the same early positive divegrence for a gap fill we see market wide and in all of the averages.

Again, there's the start of negative migration and as the 3 min looks worse, the 5 min will start to go negative which is about my threshold for a trade (short).

However, longer term traders may want to consider the Trend Channel which stopped out on a daily basis, meaning the trend from the October lows. There's often some additional volatility right after a TC stop out, but the trend, the easy money is done.

As for the 2014 trend, this 3 day Trend Channel held all gains without a signle stop, but right now it's close to a stop out for the entire 2014 trend below $108 on a closing basis. Should that occur, it is very likely AAPL starts a new trend to the downside making it an attractive longer term short sale position.

It just depends on your time horizon.

I'll keep up with AAPL.

Quick Market Update

HYG was used intraday early on for support until they could get a short squeeze going, you can clearly see it and I'll try to get my Most Shorted Index up, it takes a while to load.
HYG was used for early support as show earlier today, but going negative again as well in Leading Indicator format.

TF  and especially NQ and ES are going very negative on the day, not surprising though for a short squeeze move.

Watch TICK, it just broke the channel as well

 ES

NQ

TF

NYSE TICK

 SPY

XLf-Financials

QQQ

IWM

Watch that TICK

Intraday any way, as I think this strength is a nice entry in to whatever shorts you may be looking at.

ES, TF and especially NQ (S&P, Russell 2000 and NASDAQ 100 futures) are all going negative/deeper negative intraday as the SPY approaches a gap fill. The NYSE intraday TICK is testing the bottom trendline for today's channel dangerously, it may slip below any minute so if you are looking for a tactical entry on a strategic position, this will be enormously helpful.

Remember, this move to fill the gaps is largely based on a short squeeze, remember the leading indicators, breadth, underlying trends and how much damage the market sees on bad news as I mentioned last night, less than half of all NYSE stocks are above their 200-day moving average which in very informal terms is a way to differentiate between a bull and bear market, it's not Dow Theory, but you'll be surprised how close of a proxy it is.

The Chinese move overnight is sucking $80 billion in liquidity out of the market, that collateral that has been used to fund trades is no longer usable and as such there's massive de leveraging as well as Carry trade unwinds, just look at the USD/JPY which broke $118 today!

An intraday short squeeze to make it to gap fills for the market's middle men is a far cry from the market's trends alone not to mention the tightening by the Chinese C/B and equities clearing agency.

In other words, don't get lost in the lines or miss the forest for the trees, use the market's gifts to your advantage.

Market Update-Looking for the Gap Fill

The IWM "was" the only of the major averages that made a gap fill just about 30 minutes ago, but while there's support , it looks like they're trying to get the rest of the averages at a gap fill as well, remember there's still market makers/specialists holding inventory from higher levels, especially if the PBoC action came as a total surprise and Fundamental event with no discounting and they weren't able to adjust inventory.

Thus, since the last update...

Here are the averages, all looking like they'll make a gap fill except maybe the DIA which is not shown, but it looks a bit weaker intraday although it may draft the broad market.

 SPY 1 min looks like an aggressive move toward a gap fill (the thin light blue line around $206.60)

 SPY 2 min with a leading positive divergence, I suspect this is still all about a gap fill

QQQ as mentioned earlier is in line, it's very close to a gap fill at the green trend line.

QQQ 3 min for some context.

And the IWM negative divegrence remains as it has already filled the gap, I suspect it's seeing some selling/short selling above yesterday's close (gap fill).

And IWM 2 min for context, again the same negative divegrence.

The NYSE intraday TICK has been n a long, but steady uptrend, again likely toward the end of a gap fill, watch TICK for a break below the channel as that will signal a changing trend and give you early warning.

As for futures...

ES 1 min saw a positive divegrence at its intraday lows this morning and has been in line since,.

 TF 1 min is still negative, but has a bit better tone than the last update

NQ is popping in a parabolic move, I never trust them and has no 3C support, which looks like a very clear gap fill as inventory is sold as areas near the close yesterday by the market's middle men.

Again, keep an eye on TICK, it will usually give you an early heads up, but I suspect at least the SPY will make a gap fill first.

UNG / UGAZ Follow Up

Since we're at a critical area, an attractive area and since so many of you are following this one, here's a quick update from yesterday's UNG / UGAZ Update.

 This 2 min chart shows a positive divegrence at a price formation we were just talking about yesterday, a "W" bottom which is on a small scale here, not a true double bottom which is a much larger formation, but the concept is exactly the same. Technical Analysis books have taught for decades that the second low in to a double bottom (or a "W" bottom as the concept is fractal and works the same in different timeframes) should fall short of the previous low. However since technical analysis became so popular as the Internet allowed for cheap online brokers and people needed a way to make investing decisions, Wall Street has used that popularity and the dogma that has stuck for nearly a century in many cases, against technical traders. Beleive it or not, at one time Technical Analysis as described in some of the Bibles of Technical trading, worked like a charm, but it was also not mainstream. I can remember people calling it "Voodoo Analysis " and mocking it with questions like, "How can a line on a chart tell you anything about what a stock will do?"

The point is, since its rise to popularity with online brokers, it is used against technical traders as they'll put a stop just below the former low or the first low in a double bottom and Wall Street will almost ALWAYS run price below that first bottom in a "W" or double bottom just to hit those stops and sake those traders out of the trade, at the same time allowing Wall St. to pick up the shares on the cheap an d in supply as a lot of stops are taken out creating supply which you need when trading in the size they do.

So yesterday's mention of a "W" bottom is nicely timed with one in UNG that did in fact run the stops below the low of the 4th right at the yellow arrow. Note it doesn't need to be a collapse in price, it just needs to hit the stops which traders often take way too literally by placing them at EXACT support.

In any case, the 3C trend through that "W" bottom that is forming looks great above.

This is one of the charts I posted yesterday and wanted to see near term improvement which we have seen with a new leading positive high as the second bottom in the "W" formation was made, likely 3C moved so much because stops under the 4th's lows were accumulated as they were hit.

 Interestingly, even the 15 min chart which typically doesn't move that fast in leading positive moves, is posting a new leading positive high for the price pattern and likely bottom.

Even a 30 min chart which had been perfectly in line confirming price (green arrows) is leading positive, an impressive move for a 30 min chart in such short time.

The intraday 1 min looks like it could pullback intraday which may be useful if you are looking to buy some weakness.

However I don't see the same in Nat Gas futures intraday, so far they are still in line.

I also wanted to point out the "W" pattern on the longer NG futures charts as well...
 The yellow trend line represents the stop run BELOW the formed low of a "W" pattern,  this is exactly the same thing as you'll see in a large or major Double Bottom or even a Double Top which will see the second high surpass the former high, causing traders who are short to stop out and often go long on a head fake move as the Double top or Double bottom are still legitimate price formations, it's just the short term head fake moves allow them to knock traders out, allow them to take their shares in size at better prices and create momentum bull and bear traps.

Also note the positive divegrence (like the 15 min chart) at the same area on a 60 min chart, again leading positive ...

So this bottom/base area for UNG/UGAZ / Natural Gas looks very interesting, I'm still keeping the UGAZ long position open.