Tuesday, September 18, 2012

Closing Market Update

Most of today we've seen short term positive divergences, what we suspected to be the most probable outcome in oil and USO came true (so far) and we have some more information that we didn't have Friday such as an accumulation period, it's fairly decent, but it's not very large, it doesn't seem to be the kind of accumulation large firms would engage in trying to play catch up to QE3, it struck me as an ordinary swing type move-worth playing but probably would need a little leverage to make it worthwhile.

Now to see what the negative divergences look like on any price strength, do they get worse? If so then we can probably safely assume that our long term charts are still valid and QE3 had already been baked in the market. If that's the case, then I've included some of the longer term charts.

 DIA positive divergence on the 1 min gaining momentum today is always a good timing signal.

 On the other side of the coin, we have long term chart damage like this 60 min chart, if rising prices see these longer term charts see more damage, then we have a pretty good idea of what is happening at higher prices, not buy and hold.

 If that's the case, then the big picture charts are still very much valid-DIA 60 min

 The IWM was the most enthusiastic today with a 1 min leading positive, the R2K/IWM should be the leader of any risk on move.

 However not far away at 5 mins, we have leading negative charts. This is why you may need to be nimble, being the positive divergence isn't migrate to the 5 min chart, it's not as strong as it would have been and I would expect most decent moves to make it to the 5 min chart.

 IWM 4 hour big picture with  large relative negative divergence from February as well as a leading negative position in this leg.

 QQQ 1 min wasn't too far behind the IWM on the 1 min, but there was a definite difference.

 At 5 mins he QQQ couldn't make it to a positive posture here, this is one hint, the positive divergence just isn't that large.

 QQQ 4 hour chart, pretty ugly leading negative

 SPY 1 min looks good for a pop...

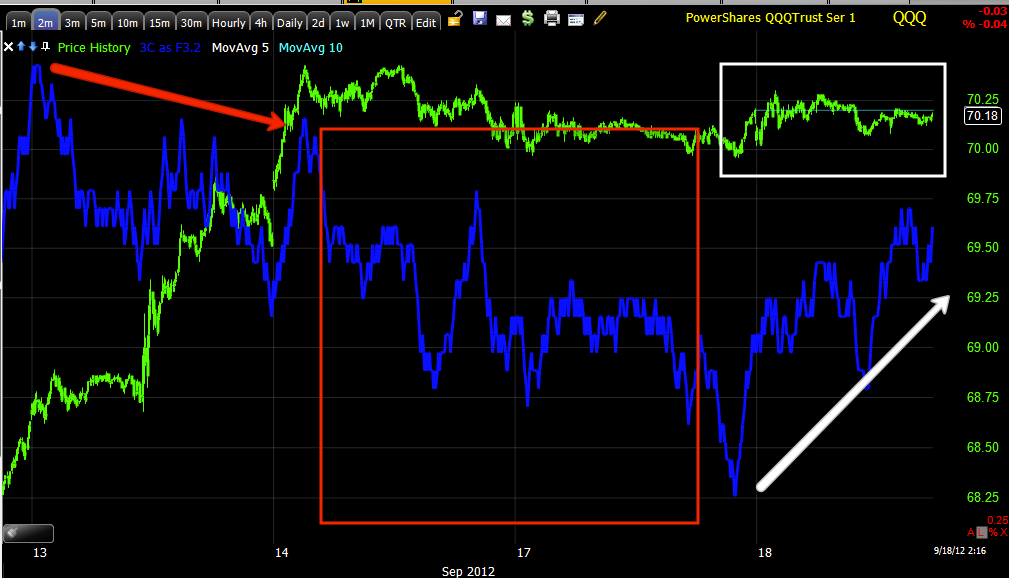
 There's not even a positive on the 2 min chart...

 The SPY 15 min , even ignoring pre-F_O_M_C date, this is a definite weak point in the market as of now.

 SPY 4 hour with quite a few negative divergences.

As for oil...

 Here you see the close yesterday, even though crude moved up after the close, I suspected it would be brought back down to this area to allow a stronger round of accumulation.

 That's exactly what happened with the 1 min CL/crude futures overnight-green arrow is the European open.

 The second half of the crude chart, you can see a positive divergence near the lows as suspected yesterday.

USO shows before the fall and after with accumulation yesterday in the afternoon and again today with prices in the zone, which they would not have been if sellers didn't come in to the futures market overnight to drive crude back down. Not every decline is bearish, not every rally is bullish, above all, price is always deceiving.


Energy / ERY /ERX

I want to show you why I chose what I did and why I said I think you need to be nimble.

 I said yesterday and today that I thought the chances were good that oil is brought down to a level in which it can be accumulated and sold in to some strength and at least make it back to Friday's valuation before that massive manipulation scam occurred in Crude yesterday. Sure enough, overnight on a negative 3C divergence, crude came down and USO to the exact level I had in mind. There's evidence of positive divergences in crude futures and USO is getting somewhere as well.

 Financials didn't have the same momentum XLE displayed, so XLE looked like a better momentum choice.

 ERY which is a 3X leveraged Bear Energy ETF is showing a 2 min negative divergence, I could have kept the position, but decided to try to trade around it instead and closed ERY and bought ERX.


I suspect I'll be back in ERY again soon though as the 15 min chart is leading positive.

 As is the 60 min chart.

 As for ERX, short term 1 min is leading positive

 2 min is too

15 min leading negative, this is why I think yo have to be nimble.

Also Closing ERY for now and moving in to ERX

This is very short term so I think you have to be nimble and able to watch the market.

ERY closed at
a nearly 4% loss or what would be about 3/10th of a percent portfolio loss.

IWM Should lead

If one was so inclined, a quick trade should be able to be pulled off fairly easy and thus far it looks like the IWM (as it should) may very well lead this move.

URTY ETF is a 3x long for the IWM. UWM is the 2x leveraged long ETF.

 IWM 1 min very sharp and fast move on this chart

 IWM 3 min positive divergence

Stay nimble though, at 5 min is is pure leading negative.

CLOSING SQQQ

I'M CLOSING THIS 3X SHORT QQQ ETF AT  2.85% LOSS, the dollar loss on portfolio value would be about 2/10ths of a percent.

Energy, Financials and Tech

Way too quiet today...

Here are what the 3 major groups look like, Tech strangely is difficult to find much on with regard to positive divergences, Energy looks the best short term. Again I present 2 charts for each, long and short term, but I think you can use these signals if you are looking to trade around positions or just get a little more nimble in the market which is what I'm leaning toward, at least until some key questions are answered and I feel strongly about all the timeframes.

Energy
 While the market is quiet, energy has been taking it on the chin, but into this leading positive 1 min divergence.

 There's the divergence on the 3 min chart.

 And here's a longer term perspective of  15 min chart which already did some damage to the group, so watching a bounce for signals of distribution or not will be important, volume is picking up in Energy so I think we are close.

Financials
 1 min positive

 5 min negative and a positive in to today.

 60 min leading negative

Tech
There aren't too many charts or timeframes that are really clear, the 5 min is, still, Tech should move with everything else.

I may re-position some things to get lightened up and nimble.

Market Update

As far as I can tell, the major averages haven't changed much or at least haven't moved away from my opinion of the most likely outcome both short term and longer term. The best way I can sum this up is the shorter term charts' divergences are more like the waves cresting and troughing while the longer term chart's divergences are more like the tide going in or out.

 Today's quite tells me the market has been up to something and you can see that particularly today in the short term positive, when the market is quiet don't expect it to last, it's almost always up to something.

 DIA 10 min positive from yesterday and continued through today.

 On the longer end of the DIA, the 30 min from in line to leading negative.

 QQQ 2 min leading negative, but specific positive divergences today in the flat range, very common.


 15 min leading negative, but shows a hint of the positive divergence.

 SPY 5 min leading negative, but again specifically today the positive divergences have been at work in the flat area.

 SPY 15 min


Interestingly, the SPY 60 min.

AAPL Update

Lots of requests, although not much has changed except a possible rounding top is taking on better shape, here's the outlook, note that I did keep that AAPL core short position open.

As AAPL represents more and more of the NASDAQ 100's weight, any AAPL specific trades you may be contemplating, you could also apply them to the QQQ and the leveraged derivative ETFs if you were looking for a little extra leverage, but not the pitfalls of options.

60 min AAPL chart with Wilder's RSI 6 (I rarely use conventional settings with conventional indicators). RIS alone provides several decent divergences that called tops and bottoms for the timeframe, in fact there isn't a divergence on this RSI chart that didn't work, it is now negatively divergence with AAPL's price.

AAPL is also taking on a kind of "Rounding Top" as volume also is appropriate for such a price pattern.

 AAPL 1 min shows the pre-I-phone 5 launch strength we saw last week, since it has obviously given a much more negative signal.

 The 1 min intraday with a few small positives and several negatives (I highlighted each on price).

 3 min leading negative position with an in line intraday status, not a positive divergence.

 5 min is where we saw the strength before the new phone released with a leading positive, so this chart has been key as it moves to a leading negative, I'd like to see a more vertical drop in 3C soon.

15 min is leading negative, again no positives there, just some intraday confirmation moves.

The longer term charts haven't changed, although I'm not relying on those quite as much yet.