Thursday, August 25, 2011

An Earnings Play and a 27% 1 Day Gain

3C only works because there are leak in the market and people front running or trading inside information, it's way more prevalent then you think. About a year ago I wanted to demonstrate this to members, so I looked at a lot of charts for what looked like earnings leaks. I wasn't trying to guess whether they'd beat or miss, but how the stock would react after. I posted the direction of the trade before earnings were announced for 22 stocks and got 19 correct, that's  95% success!

Otherwise I hate trying to trade earnings, I want to control as much as possible in the trade and earnings can be a wild card.

Last night I received an email from a member who was looking to play the earnings of "P" (Pandora Media). Here's the first email exchange last night.

Hi Brandt. If you have time can take a quick look at the symbol P and let me know what 3C is saying on 1 and 5 min charts. Earnings call is tomorrow. Thanks.


There's not enough history there for me to gauge which version of 3 is correct, but if there's a leak and if earnings are in the a.m. (if they are after hours tomorrow, then we need to watch it tomorrow too) then I would guess they'll have a good reaction. There are some recently positive charts over the last few days.

Good luck and let me know.

Today's email exchange:

Hey Brandt. If u have time, how is P looking today? Thanks.

All versions of 3C show the same thing, it looks like they accumulated the dip that was the worst around noon today, there's good consistency between the different versions of 3C and the different timeframes. Overall, it looks bullish.

Brandt, up huge now! Thanks

P was up over 20% in after hours, our member sold near the top and because of hi cost basis, he made 27% in a day. I didn't post this as a general trade because of the limited history, but as always, I'm willing to work with any member's ideas.

Here are a few charts of P that made me think they'd do well.

 P 30 min chart showed accumulation over the last 3 days and strong accumulation on the dip around noon today, it went into a leading positive divergence from there, the strongest kind.

 The 15 min chart looks largely the same, look at the leading divergence today, it made new highs,even though price was
$2 lower then 8/17


 The 10 min chart also showed several days of accumulation and a leading divergence that hit new high ground.

And the 5 min chart also hit new leading divergence highs above higher prices from 8/17.

This is the nature of the market, and this is the nature of our edge in being able to see what smart money is doing. It's not a level playing field at all, but if you follow along with the rest of the sheep practicing traditional Technical Analysis, you'll eventually be led to the slaughter.

Nice Trade N.P. !!!

PMs Update

Here's yesterday's post about seeing a bounce coming up in GLD/SLV

This is from this morning, outlining what the charts were showing and what to expect

And here is today's intraday 2:30 update so you can see what has changed since.

Here are the charts as of the close today for GLD/SLV
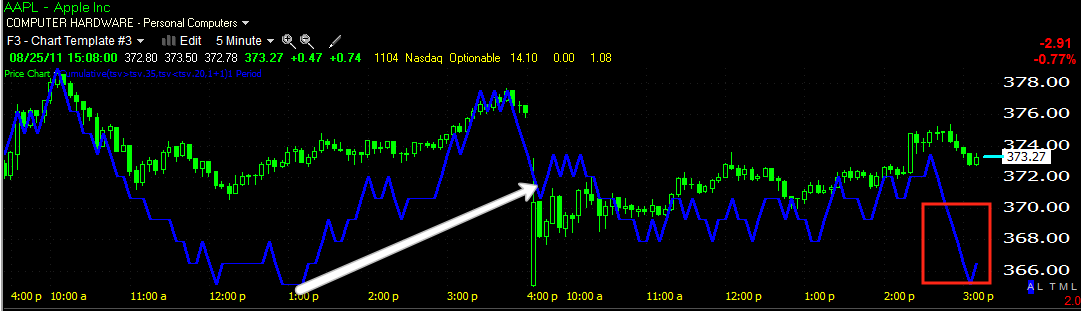
 GLD showed a negative divergence this morning, but I said that it would still go on to make higher highs, the 1 min chart (above) is showing the intraday action and the longer term charts were still very positive, telling us GLD would pullback a bit, but continue to make higher highs as you can see GLD did since the 11:30 a.m. update. However, at some point we expect to see distribution and that occurs in to higher prices or a flat range bound market. The 1 min chart is now showing signs of distribution of yesterday's and today's accumulated position. The distribution will show up on the 1 min chart first and work its way through the longer time frame charts.

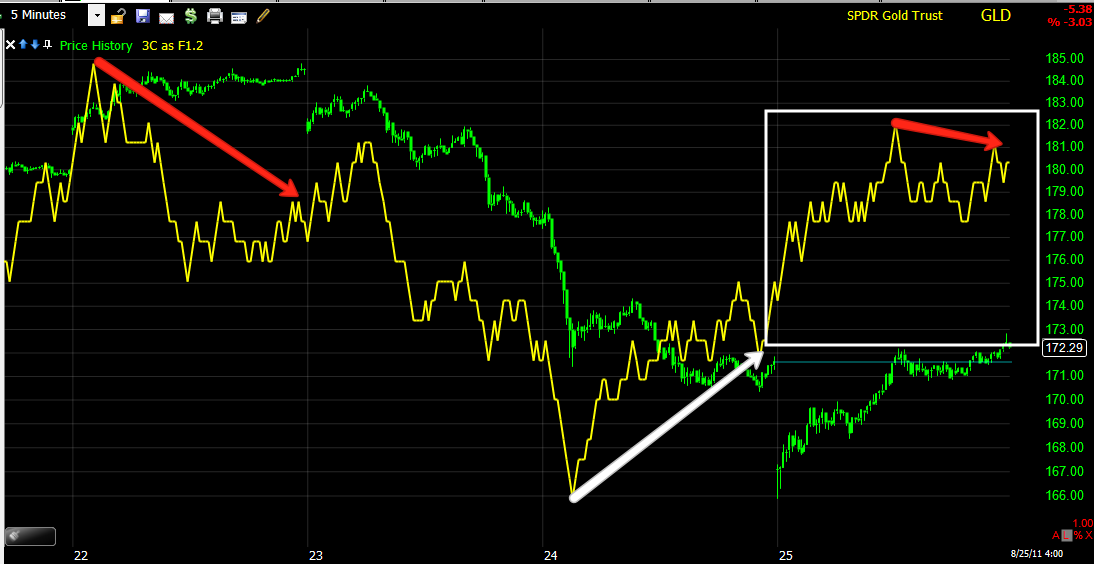
 This 5 min chart shows several days of action from distribution in to new highs that caused the reversal, to yesterday's accumulation in white. Between yesterday's accumulation and this morning's gap down accumulation, there's an average price paid on the position, since we are seeing signs of distribution on the 1 min and now the 5 min chart, we know that GLD is trading above their average price paid position.

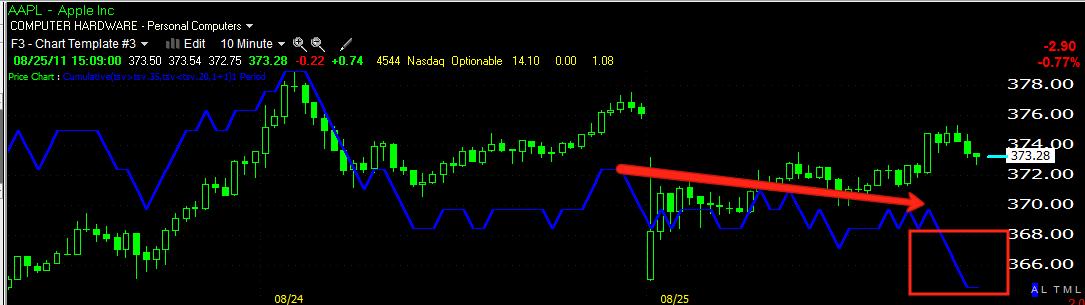
 The 15 min chart is where the reversal will most likely take place (when the 15 min chart goes negative), we can see yesterday's accumulation pretty clearly and today 3C made higher highs with price until this afternoon. You can see GLD moved higher but 3C stayed at the same level, so traces of distribution are now creeping in to the 15 min chart. We probably still have some more upside in GLD as distribution take place in to demand, not on declines in price. I would think that sometime tomorrow, GLD will be close to if not at a downward reversal. I know some of our options players were up over  100% yesterday on their GLD position, I wonder how they fared today?

 SLV was expected to be the weaker of the two PMs as of yesterday, but it did outperform GLD today. The white box represents the average area of accumulation yesterday, then add this morning's accumulation at the gap lows and you get an average position price much lower then the white band. SLV 1 min is also starting to show signs of distribution on the 1 min chart as SLV made higher highs in the afternoon and 3C stayed lateral.

 The 2 min chart shows several days worth of data from the negative divergence/distribution in to the high of SLV to yesterday's signs of accumulation. Today in the afternoon we can see the 2 min chart moving lower as SLV moved higher, so distribution is underway in SLV on this longer chart as well.

For newer members, this is an interesting dissection of Silver and how Wall Street uses Technical Analysis in its historical form, as practiced by most technical traders, against you. We saw the action in SLV on August, 18th and knew that it was going to reverse. 3C and our understanding of Wall Street and technical traders even allowed us to know exactly how it was going to go down, from a move higher to a failure of SLV's uptrend, it's an interesting read for anyone who wants to understand how Wall Street really operates. Here's the link.

 SLV's 5 min chart shows accumulation yesterday(white arrow), confirmation of the uptrend today (green arrow) and signs of distribution today (red arrow).

The 15 min chart shows the reversal of SLV's uptrend and a strong leading positive divergence currently. There are no signs of distribution on this chart yet, so SLV should have more upside, but I expect the 1, 2 and 5 min charts will start bleeding into the 15 min chart and by tomorrow we'll have signs of distribution and perhaps a reversal.

Quick Market Update

No commentary...
 DIA 1 min

 DIA 5 min

 DIA 10 mn

 DIA 15 min

 IWM 1 min

 IWM 2 min

 IWM 5 min

 IWM 15 min

 QQQ 1 min

 QQQ 5 min

 QQQ 10 min

 QQQ 15 mn

 SPY 5 min

 SPY 10 min

SPY 15 min

Tomorrow's Landscape

8:30 Q2 GDP consensus .7%-1.6%
8:30 Corporate Profits
9:55 Consumer Sentiment
10:00 Bernanke Speaks

I'll have to find out which channel CNBC is on so I can listen.

VXX Follow Up

Yesterday I mentioned VXX as a candidate for a swing trade (short) and preferably using options (but not holding until expiration) in this post.

As you probably know by now, the VXX trades inversely to the market. Here are some late day charts of interest.

 Here we have a 1 min positive divergence in the VXX, I used to describe this 1 min timeframe as the playground of Specialists and Market Makers, until HFT firms have made them nearly obsolete. Still the short term signals here can often tell us something about the next day's open. Looking at this chart, I would think we may see a gap down and if you are interested in the trade as described n the link above, it may be a good entry point.

 The 15 min chart, which is more in tune with smart money is in a leading negative position and this is one reason I like the swing short on VXX.

The hourly chart is more important then any of the harts above and it is clearly negative. So keep VXX on your radar, it might just be a great trade and you might just get a low risk/high probability trade out of it.

Volatilty-

Remember, as we often see, the first knee jerk reaction to anything out of the Fed is almost always wrong, we saw that as the last FOMC meeting.

Tomorrow we are also going to get a look at Q2 revised GDP, I've been saying ever since it hit 5% before being revised downward, that GDP is on the slippery slope to recession. I would not be surprised one bit if Q2 GDP came in at a number with a "minus" sign in front of it, that's just been the trend.

After that Bernanke will speak at Jackson Hole, Wyoming.

You should make hurricane preparations (risk management-take a look at any positions you might want to take a profit in or any positions that aren't core holdings that you may have been thinking about-it's just time to tidy up) as tomorrow is likely to be a very volatile day.

AAPL-If you bought the dip....

 Here's the bigger picture in AAPL on a 30 min chart, note that the "W" bottom has a positive divergence at the second low.

 This is the 1 min chart, this morning there was accumulation on the gap down, it's now starting to see distribution, so if you bought the gap down for a day trade, you might think bout taking some profits and trailing a stop loss.

 The 5 min chart confirms the 1 min chart above.

The 10 min chart is showing distribution into higher prices.

GLD/SLV Update

This was this morning's update and so far, so good. We are right on track from earlier expectations.

 GLD, here's the negative divergence I showed you in the last update, I said GLD would go on to make a higher high, which it has at the white arrow.

 The same thing with GLD's 2 min chart

 The 5 min chart has gone into a leading positive divergence.

 So has the 15 min chart. Remember the positive divergence or accumulation started yesterday at higher levels, I'm sure the lows were accumulated today as well, so there's an average cost somewhere in between, so GLD is still in stage 2 mark up, there is no distribution into higher prices yet, that may be because they have not reached their average price paid on this round of accumulation-the exact same goes for SLV.

 SLV negative divergence seen in the earlier update and the new price high.

 5 min SLV confirmation and a leading positive divergence.

 Also a 15 mn leading positive divergence-this is the same situation as described in GLD.

The 60 min chart is in line, so I don't expect this to be  major reversal.

Market Update 2

I just wanted to get that out quick, here's some charts.... So far this is going the way I expected earlier when I mentioned how 3C would likely react today.


 DIA 1 min is starting to show some strength, I believe this will continue and filter in to the longer term charts. Here we have a small leading positive divergence.

 The 5 min chart has an overall position that would be considered leading negative, but notice some strength filtering in to the 5 min chart incl. a positive leading divergence and a higher low for 3C as price made a lower low.

 The short term IWM or small caps seems to be looking better then the rest. Here's the 1 min chart with yesterday's warning and today's negative divergence off the open. Since then 3C has put in 2 positive divergences.

 The IWM 2 min chart shows the same on the open and 2 divergences, 1 a relative divergence and the second a leading divergence, so as I suspected, strength is starting on the fastest charts and filtering into the longer charts.

 This IWM 5 min chart is another good example with the same two positive divergences seen in the chart above.

 However, we still have a lot of work to do and probably some new lows with the negative divergence on the 15 min chart. We'll see if accumulation continues as price makes lower lows.

 QQQ 5 min-yesterday's warning I mentioned and a positive divergence on the 5 min.

 Even the 15 min which has a solid negative divergence is showing some sign of strength at the white arrow, refusing to make a lower 3C low.

 The SPY 1 min chart is looking pretty good here.

 The 5 min is inline, which is better then leading negative.

 The 10 min is showing hints of strength as 3C makes 2 higher highs with price making 2 lower lows.

Yet there's still work to be done until this 15 min chart starts going positive.