Tuesday, July 17, 2012

GLD as a leading indicator

I don't know if that correlation would hold up over the long term, but gold is definitely a sentiment indicator for more QE (gold rallies when easing looks promising and sells off when easing looks distant), take that to the next logical step and the only reason the market hasn't fallen in to a black
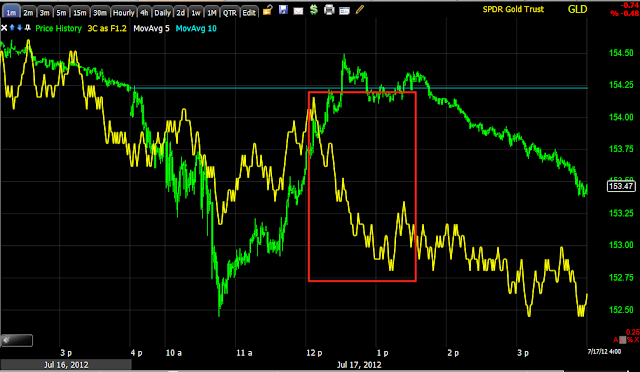
hole by now is because the market is still "hoping" for central bank intervention/easing, so in a way, gold could be seen as a leading indicator for the market and that's one of the assetsI was looking at today before we had any clear signals in other places, GLD reacted earlier.

 The market is fractal in nature, what occurs on longer timeframes also occurs on shorter timeframes. You can see several instances above of gold lading the market by either topping or bottoming first. Today GLD was much less enthusiastic than the SPX.

 Earlier today we identified negative divergences in GLD and suspected it would move down, taking sentiment and hope down with it, by extension, the market.

 This is what the 2 min chart looked like around the last time we looked at it today, leading negative, price followed.

 The 3 min chart showing what looks to be a pullback/correction of several days or so.

The 5 min is slightly leading negative, but much closer to in line, again along the lines of a near term pullback lasting perhaps 1-3 days.

ES / CONTEXT

 CONTEXT was inline with ES early today, as the early afternoon gains were put in, the model started diverging negatively from ES, it's not a horrible divergence, but it is enough for a short or near term pullback.

 Note also ES saw no positive divergence at the lows like other averages today, which is why I believe Schumer's remark to Bernie today was the initial catalyst as the market was reactionary rather than proactive, the only thing I really see that looks proactive appears to be selling in to strength. Es which was in line with 3C for most of the day, is now in a fairly large leading negative divergence .


 Yields are still bothersome as far as the sub-intermediate trend goes, they are one indication that doesn't quite fit the sub-intermediate trend theory, however on a short term basis, the negative divergence in to SPX strength for a pullback is there, just as it was earlier this month.

 Commodities have outperformed for their correlation to the FX market by a wide margin and even outperformed the market several days, it almost seemed as if there was a buy the rumor sell the news event in commodities today with the rumor or at least sentiment being Bernie would leak some sort of easing today as commodities have always been a beneficiary of easing; their late day underperformance relative to the SPX is the first in a while.

Finally High Yield Credit, the playground of the big boys and girls; the credit markets are huge, very few trade credit (I haven't met anyone on the retail side)-this means credit often leads equities. If smart money wanted to express a bullish outlook, they'd use High Yield, if they were looking for a flight to safety, they'd use investment grade. You have to also understand positions in credit markets are large and take time to build and change, they usually don't stop on a dime, that's why this chart of HY credit vs the SPX is interesting, you can see HY being bought in to SPX weakness just before an upside reversal and HY being sold the last few days in to SPX strength, this falls along the lines of the pullback we have recently been talking about. However the longer term position of HY credit still remains supportive enough for us to see that run to the top of the bar flag and possibly the final short squeeze move.

Still Really Like VXX / UVXY

Whether the short term VIX futures (VXX) or the Ultra long version (UVXY), I love the way the charts look, especially given the look of the SPY and the afternoon range after a move higher. From experience I usually don't like trading these two and always keep positions at speculative levels, but I was VERY tempted to add to the position today.

 The 1 min chart just marched higher all day.

 A good divergence should migrate through the longer timeframes, such as this 2 min chart with an even stronger leading positive position and most all of the leading divergence was in a flat range (as mentioned in the last post, flat ranges are where we often see accumulation/distribution because of the stable prices).

 The 3 min chart hit a new leading positive high today and has several days in positive territory.

Even the 15 min chart is in leading positive position, this is more than I could ask for considering I view this as a short term trade.

The FB position

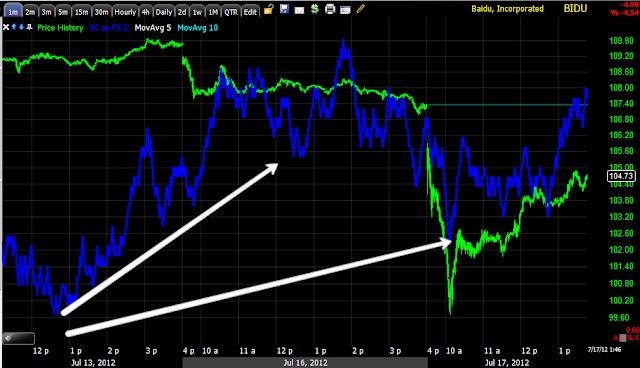
FB and BIDU are two stocks that have not been heavily correlated to the market, they've been off doing their own thing. I took a longer look at FB, one of the most hated stocks.

 Stage 2 is above the green arrow. We expected a deeper pullback at least to the support line, but that was when FB was further away from support, this move definitely will pull shorts in and shorts provide supply for accumulation. I'd still rather see the 15 min chart's base longer, but FB is a new issue and can't be expected to trade like a mature issue.

 The 2 min chart could have easily confirmed the downside in FB, it hasn't. The recent lateral range had shown some signs of accumulation, which makes me wonder if this sharp break is being used as a bear trap and sort of ignition source on a squeeze; the possibility is worth the extra 20% position size.

 The 5 min chart today showed an extremely strong leading positive move.

It's the 60 min chart though overall, I think if this was a real move down in FB, we'd see clear signs of distribution and there are none.

SPY/Market Update

Just had a little VMWare problem, in any case, the market is doing as expected as it was chopping around laterally.

The 3 min chart was last at the local low, it has moved to a new leading negative low as prices remained in a range, this is often a sign of distribution (the price range alone).

Now we are just starting to see the SPY break apart, but the selling in to strength seems to be pretty clear.

Added Aug $27 FB Calls

I added 20% more, this is 40% of a normal position or about 10% shy of a speculative position.

Charts coming.

Added Aug $27 FB Calls

I added 20% more, this is 40% of a normal position or about 10% shy of a speculative position.

Charts coming.

Added Aug $27 FB Calls

I added 20% more, this is 40% of a normal position or about 10% shy of a speculative position.

Charts coming.

You know what, Changed my mind on FB, Will add another 20%

I'll explain in a minute.

FB Update


FB is rallying off intraday lows... 

I started a very small position there in calls with the intention of adding to it at better prices, we have better prices and some upside momentum, it's a difficult choice as to whether to add or not here. I only have about 20% of a normal size position which is half of a speculative position so adding here wouldn't be very dangerous, but lets look at the probabilities.

 Here's the afternoon rally off the lows, the thing I do like here is the volume on the downside move. This kind of volume can sometimes be like mini capitulation.

 The FB 1 min chart chart shows the positive divergence for the rally, but it also seems to be telling us there's some selling in to that move.

 Overall, what I wanted to see on a pullback was positive divergences, the 2 min chart is showing me that

 So is the 3 min, but this is rather short, there are few moves in the market that take off from a "V" reversal, especially in stocks with a large float.

 The 5 min chart seems to be showing a strong leading positive divergence, it seems the price concession in FB is drawing in buyers in underlying trade, there's certainly enough supply.


Overall though, the 15 min chart to me looks like it needs a bigger base, especially if FB is going to try to tackle resistance and move to stage 2. I also have to consider what I think the highest probability is for the market over the next day or two and factor that in to my FB analysis, for now I'll be patient.

Why these intraday extremes are important

 This intraday move is going against my UVXY long, but I don't mind because in doing o it's giving me information that tells me that my position is likely to be successful. Smart money needs extreme dips to buy in to and extreme moves up to sell in to and they are often very busy during flat, rangebound markets when everyone is asleep at the wheel as well.


 As the SPY is sideways, look at the information I'm getting, this 3 min chart is from the very last update, the next one is from just moments ago.

 Note how much worse it looks? This tells me the underlying activity in the near term right now shows the probabilities are underlying selling in to price strength. And why would you want to do that?

 The VXX 3 min chart has improved even more

 So has the UVXY chart.

As well as the TLT flight to safety chart.

This is putting together a stronger case for my position and analysis

Market Update-Looking for the trend

The one thing I try to constantly remind people, "Price is deceptive". If you bought in pre-market today based on the surge in ES last night, look at what would have happened to you on the open.

A day ago the gap was faded the exact opposite way, but it didn't make a major move until 9:30 right on the open, this isn't coincidence. Morning trade seems to be the most deceptive of all.
As for the SPY (most of the averages have at least a similar theme if not the same signals)...
 The intraday 1 min is going negative as the SPX chops back and forth before the pros come in around 3-3:30 in to the close, note there was no positive divergence at the lows on the fastest of timeframes, it all seemed to be a reaction based on Schumer's comments to Bernie.

 This is what I was hoping to see, a more solid signal migrating through the timeframes (2 min chart)

 The 3 min chart is starting to make clear that same weakness in to price strength.

 The 5 min chart is really the fulcrum, we have the 3 min deteriorating, the next is the 5 min which is already in a relative negative position. How much it deteriorates tells us something about near term trade, but based on what we see and have seen for the last couple of days, my assumptions haven't changed that much.

 The 15 min chart really takes some underlying action to move and if the 5 min isn't going to make a strong move, I don't expect the 15 min to make a strong move so I'll stick with where the 15 min is for now.


Yesterday I erased the previous patterns that the market had been reacting to, they are history, we have this large bear flag. The current assumption is the very short term move (normally defined as about 5 days, but we are very choppy and volatile now and while the trend in the end may make it to the objective, there are likely to be noise days in between.) may move toward the bottom of the flag (red). If we add in market behavior, head fake moves, etc, then we should expect a break below the flag to draw in shorts. Should the 15 min chart hold up or even strengthen, we are pretty much back at our original assumptions (sharp move down-and a break below the flag will look like a sharp move down as volume would likely be high and momentum fast), followed by the move toward the top of the bear flag. Throw in market head fakes, etc, and we should expect a move above the top of the flag which would likely trigger the short squeeze we have only seen glimpses of but have expected.

This should finally set up an extreme move in an area we can add to long term trending trades such as the core shorts I continue to hold, several at 20-30% gains already. Unless the f_E_D steps in with QE, at that point I'd expect that the primary bear market trend will re-emrge. So you can see why even near term trade is important (a move below the flag could set a major bear trap and squeeze sending us toward the top of the flag).

So far today we have seen some decent clues, I hope we get more before the day is through.

BIDU Update 2

The first BIDU update today, BIDU was $102.28, it's now at $104.69 as today's move looks like a shakeout as mentioned in the earlier update.


And now? It seems to be making pretty steady progress.
 1 min large relative positive divergence and leading intraday right now. BIDU has been off on its own, away from the high correlation of the market, I wonder if that will continue. I suspect it will.

 1 min close up, in line pretty much all day and recently leading positive

 The 3 min has a small negative relative divergence, if the 1 min stays in leading position it should migrate to the 3 min chart and put it back in line with price.

 The 5 min with a large relative positive divergence and an in line/confirmation status today

The 15 min chart with another large relative positive divergence and a leading positive divergence today.

I intend to keep holding BIDU calls.

Looks like the Classic reversal with all the bells and whistles

First we have the negative divergence migrating through the timeframes, then a couple of concepts we always harp on: The head fake move before a reversal, here, a new intraday high and of course the parabolic move.

Quick look at confirmation

Following the GLD charts, here's the SPY and some confirmation assets, keep in mind these are still on the 1 min timeframe or intraday moves.


 SPY 1 min going negative as mentioned.

 VXX should look the opposite, it does with a leading positive divergence

 The same for UVXY

And the flight to safety trade, TLT (Treasuries) also leading positive.

GLD getting worse intraday

The reason I mention GLD is because the fulcrum event of the day was Bernie's testimony and the market's sentiment toward that testimony should be reflected in GLD first.

 GLD 1 and 2 min near new leading negative lows, should be seeing a turn down soon, I suspect the market won't be too far behind it.