Monday, October 1, 2012

RIMM Still looking Good-Pullback?

RIMM long as was covered here last week, the next day after I called it a, "Good looking longer term long position" RIMM reported earnings and was up nearly 20% in after hours. I think RIMM still looks good for a move higher, the question is, "Do we get a chance to pick it up on out terms?". I think the answer to that question is yes and you can see why we don't chase stocks, especially on a move like that in after hours, although it would have been a great place to take a quick 22% gain if you had bought it the day before.

So here's what we see in RIMM and where the opportunity appears to be shaping up.

*Also note that with even decent looking stocks looking like they'll come down a bit, this doesn't bode well for the market or those stocks that are overbought or are just moving out of institutional holdings.

 Resistance here is not as important as the concept of the double bottoms or other bottom price patterns being violated on the downside with top patterns being violated on the upside before they move. Technical Analysis says the first bottom or support area should not only hold, but subsequent pullbacks should fall short of hitting that support area, that is how they justify strength in a stock, but that's the old dogma of Technical Analysis and many things have changed since the days of hand charting. It' a lot more advantageous for institutional money to break support, cause a lot of longs to stop out and be able to pick up those shares in large quantities without anyone knowing what they are doing and at a better price. RIMM is a good case in point with two deeper penetrations of the original support level, watch what happens at each.


 On a 60 min chart the positive divergence becomes stronger at each subsequent break lower, this shows larger accumulation of the position and few longs suspect anything as they gladly give their shares away in the name of discipline.

 This is the most recent break below support on a 15 min chart, note the leading positive divergence which indicates increased activity. Then there's the gap up after earnings, we don't want to chase it so we look for it to hopefully fill a good portion of that gap, with a base this large, it will almost certainly be  worthwhile long position to consider. The 15 min chart shows the profit taking on the day after earnings and I believe we will get a constructive pullback to possibly enter a long in RIMM.

 The 5 min chart today shows some leading lows in 3C that haven't been there, it' not enough to do damage to the big picture, but should be enough to get price down near the gap.

The 1, 2 and this 3 min chart all show intraday distribution as price rises in to the afternoon, this also looks like short term liquidity traders/market makers, etc are getting in position for a pullback.

That's pretty much what we want to see with positive activity in to the pullback and with the longer term charts looking the way they do and as big as the base is, I don't think RIMM has even started it's move to the upside.


Follow Up IBM

Earlier today I opened a 25% of a normal size position short IBM at $210.74 which is at a small profit on the close. The point was to phase in to the trade as it seems to offer pretty good risk/reward here, but to leave room in case there's a better entry which i averaged in to the position.

Here's how IBM traded the rest of the day which was interesting, actually it was what I'd like to see.


 The 1 min chart put in a small positive divergence in the early afternoon, it was small though.

 Note on the 3 min chart it is barely noticeable, but the negative divergence in to the slightly higher prices it caused it quite noticeable as we go through the timeframes.

 5 min, what I want to point out is the divergence between 11 a.m. and 2:30 pm

 On a 10 min chart the positive divergence isn't even there, it was just enough to get price moving up a bit, the negative divergence on the 10 min chart is leading and much bigger, so there was a small amount of support for prices which looks to have been sold in to in a much bigger way.

 The 15 min chart picked up on it as well

 And even though the 30 min chart is already in a leading negative trend position....

The 30 min chart intraday also picked up on the negative divergence in to the afternoon highs.

Volume also picked up in that area, it wasn't huge and we don't want to see huge, but it was increased and that is what we do want to see. Huge volume would give away their element of surprise, but slightly rising volume most people won't think twice about, it's often the small things that make all the difference, as it has been said," It's the things the crowd misses".

All in all, a good day in IBM and I'm happy to have started the position there.

BIDU charts and progress

The simple fact is there are thousands of assets to trade, while we may see something we like developing, we want the trade to not only come to us on our terms, we want the entry to be good (low for longs/high for shorts), we want the risk to be limited (this is accomplished by letting the trade come to you as just mentioned and what I'll mention next), and we want the probabilities to be high and this is by seeing strong divergences (positive for longs and negative for shorts).

BIDU was a core short recently closed, in fact very close to its low and it has shown some improvement since. While I haven't done a comprehensive study of this thought, I do see signs the market is split or bifurcated and I have mentioned it many times recently. Instead of there being a risk on or risk off environment where most stocks all move in the same direction (relative performance is the only difference), it seems there are stocks that look like they are being sold and some that are being bought, for example: GOOG's chart and underlying trade vs RIMM's chart and underlying trade. RIMM gained about 20% in after hours earnings a day after it was mentioned here as a stock that will probably have some decent upside to it.

The main difference I'm seeing is stocks that have already seen substantial pre-QE3 mark up like AAPL or GOOG are the ones that have the worst looking underlying trade while stocks like RIMM or BIDU that were beat up pretty bad over the last several months or even throughout 2012 are the ones looking like they offer better upside potential.

I suspect this has to do with one of the major differences between former LSAP's (QE1 and QE2) and now (QE3); former LSAPs have seen prices at much lower Price/Earnings multiples (P/E). I never thought P/E would matter again and while BIDU still has a high P/E, price has made it more of a value now than it was in March. During QE1/2 the average dividend yield for the SPX was 4, it's now half that. The average P/E for the SPX component stocks was 10, now its 14.9. As I said, I haven't done an exhaustive study on this, but it seems to me that if there are going to be longs bought, institutions are more concerned with a reasonable valuation now then they have been in many years (before all that mattered was sentiment). I think there's an "air" that the equity markets are in bubble territory (as pointed out last week) and valuations matter when you are at risk of a bubble.

In any case, BIDU isn't the best example of a low P/E, but it has burnt off some of the frothiness from earlier in the year.

Since we saw the pullback coming in BIDU, we've been waiting for accumulation in to a pullback to look at BIDU as a long position, here's how it is coming along.

 BIDU 15 min showing the negative divergence on the right timeframe for a reasonable pullback. I don't expect to see accumulation right away, first the stock needs to be at an area in which it is considered a value.

 The 3 min chart and accumulation and distribution areas, that's the same reversal point as seen on the 15 min chart above, today we saw the start of a positive divergence in BIDU-the start of a positive divergence is just that, it' not necessarily the best place to buy, but it is headed in the right direction, for it to meet all of criteria mentioned above, it needs a bit more work.

 There's some migration from 3 min to the 5 min chart as it starts to lead positive.

 And we see the same including the reversal and the recent positive divergence on the pullback on the 10 min chart.

 The 15 min chart has lost downside momentum, but it's not positive yet. Considering a 15 min chart went negative right before the pullback, I'd like to see at least a positive divergence on the same timeframe.

Which means, it would be most likely and most helpful if BIDU chops laterally a bit and builds that positive divergence, maybe it even pulls back a little more. We have an advantage over Wall Street in that we DON'T have to be in the market all of the time, we can pick and chose our battles, so should BIDU continue with constructive underlying trade and give us a nice entry, low risk and high probabilities, we can take a shot with BIDU long. If BIDU doesn't offer us that edge, there's no reason in the world we have to trade BIDU, it has to come to us and offer us the trade we are looking for, but so far, it looks like it has started so BIDU remains on the radar as a long position to consider as it develops.

Probabilities for tomorrow

In looking real quick at the chart and the probabilities for tomorrow, at least early on, it's a tough call because the divergences move from the fastest timeframe to the longest, there's a lot of short term timeframes with damage and it would seem they will keep moving toward some intermediate timeframes like 10-15 min. since we have had this several day "bear flag like" move.

It looks that the probabilities are probably for some more upward movement in this move, but I think deterioration will continue. Here's an example of what I mean.

In white is the bear flag like move I mentioned, although today's shooting star is very ugly, volume doesn't seem quite high enough, the way things look now, it seems tomorrow it may in fact be ugly enough. I'll post charts showing more.

BIDU Update

Since that BIDU pullback we were expecting, we've been waiting for there to be accumulation in to the pullback, I'll try to get charts up soon. BIDU doesn't look ready to buy here on the pullback, but at least now there are signs of the positive divergences we are looking for.

Just be patient and let it come to you on your terms.

MCP Update

The last MCP update on 9/26 I said that I couldn't rule out MCP building a larger base, but I am inclined to think it has at least a decent swing move in it. You can click the link and look back at the charts, but the main charts other than the macro environment and break below support that looked like a head fake move as MCP moved above and MCP is just about at that support level today on a move down of -5%, where the 3C 3 and 5 min which were positive and 30 min which had recently been negative, moving MCP down and was yet to turn upward.

Looking at the same charts and how they have progressed since... Really there's been no technical damage and in fact some improvement.

 From left to right on a daily chart: Likely capitulation, support formed and broken on heavy volume , resistance broken on a breakout move with heavy volume and new support at the hammer at September, support holds a test and remains above thus far.

 The 3 min chart since the 26th which was positive, intraday support has held and the divergence is even more positive in a leading position.

 5 min chart with a small positive on the 26th, since then it has been in leading positive position and put in an even larger relative positive that started with the positive from the 26th.

 The 30 min chart as of the 26th was still pointing down (see red arrow around the 26th), now it has moved up and is in a decent size positive divergence. This is where the most improvement is seen.

The longer 30 min since the capitulation event with large accumulation on the break of capitulation support as supply was abundant at cheap prices, the negative divergence that we had seen still facing down on the 26th and another positive divergence developed thus far. The next thing that would be good to see is 3C turn up in to a leading positive divergence.

All in all, I still like MCP, a base isn't an event, it's a process and the stronger the base, the more upside it can support.


Collecting QE3 Data...

The F_O_M_C / F_E_D released QE3 upon the masses of traders that are convinced they need a steady intravenous drip of Quantitative Easing to raise asset prices, so much so it appears they have inflated asset prices in what has become known as "Front-Running the F_E_D" in anticipation of September 13th's announcement, that's how convinced they were that QE3 is not only coming, but they needed to buy  in anticipation of this event, that in their view will lift all boats to all time new highs in to the stratosphere.

On that day I posted that my "emotional" reaction would be to tell everyone to close all shorts, but everything long and just hold on, but I didn't. I said, "Lets collect the data, the evidence" because history may rhythm, but it doesn't repeat and we have many things that are much different now than at QE1, 2 , Twist 1 and 2.

I have gone over the differences, not to justify a position or opinion that QE3 will be a dud, but just to point out that we can't just assume. 

Here is what I am now watching in the market to get  feel for what is happening in underlying trade, how the market is reacting to QE3 announced. I will point out there have been numerous articles that didn't appear in past QE and numerous opinions and facts about how this time it's different. We just heard from Goldman Sachs who has lowered Q3 GDP guidance 2x in 2 days (consecutively). Also from GS, their clients are more concerned with inflation and its effect on stock prices than they are happy about QE3, in fact they are concerned QE3 will bring about inflation and asset price shocks, they connect QE3 and blame it for their concerns rather than celebrate it. Goldman's own Chief Equity Strategist has his year end S&P forecast at 1250 since the start of the year, QE3 didn't change that so he thinks the S&P falls as QE3 is unleashed.

Lets face it, since QE3 was announced, the market hasn't performed all that well.

One scenario I thought about as QE3 was announced is, "Smart money isn't going to chase prices higher, they'd likely pull the market back and accumulate at lower prices". So along that line of thought, here's what I continue to watch and what I'm watching out for, but so far, I'm not seeing it.

 From the SPY 1 min chart, here's a negative divergence after the 10 a.m. ISM bounce, then the positive divergence I mentioned just a bit ago and a move higher, a 3C/price pullback. Remember I said the divergence is out to about 3 min charts in most cases, still all intraday timeframes.

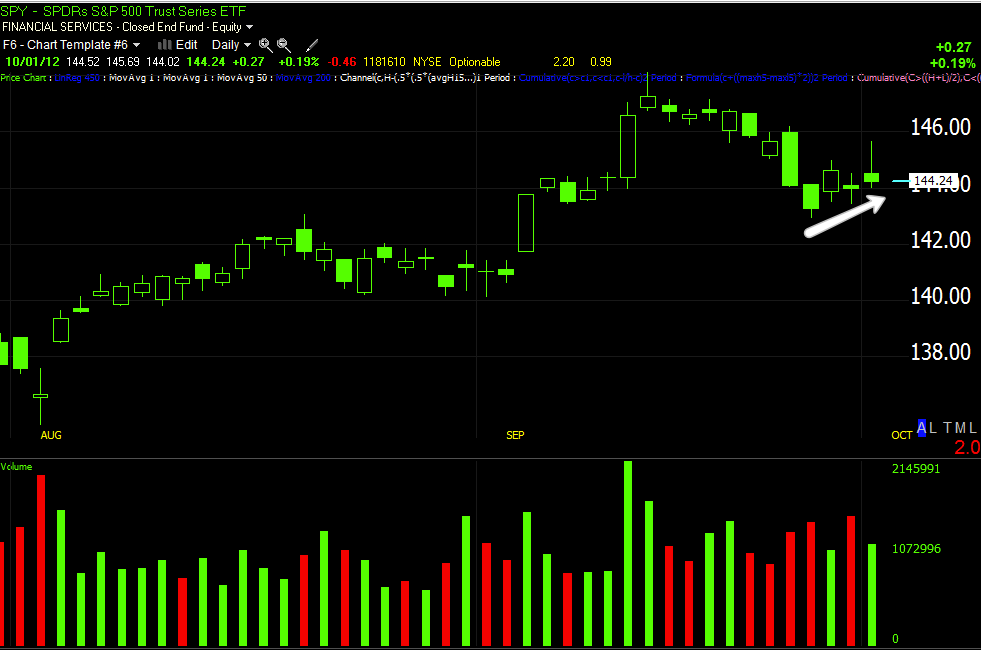
 SPY 2 min chart, positive at the dip in the white box, price moves up in to a larger negative divergence, still we have hints of a small positive today as mentioned and 3C/price in line at the green arrow.

 The 3 min trend and today shows a series of smaller negative divergences sending price lower at each, today we have an even uglier leading negative divergence in to price moving up, that's typical of selling in to price strength.

 SPY 5 min sees NO positive divergence through this entire timeframe, but it does have a negative and leading negative divergence as prices move up on this wave within the downtrend. So far, this is not bullish behavior and doesn't show the signs of accumulation in to lower prices on the theory that I was watching for in prices moving lower.


 The 15 min was already negative in to the QE3 announcement and even though I've been trying to collect data post the announcement, it seems this chart was still very much relevant as price responded to the negative divergence. Note also here on the 15 min chart, there are NO positive divergences, so no accrual of accumulation.

 The 15 min chart on a closer view, no positives, just in line counter trend waves in the move down, but there i a negative divergence here.

This is what I was watching for in the theory of lower prices that could be accumulated, which isn't something I expected, just something to watch for. "IF" price moved lower and 3C moved higher like you see with the arrows I've added, that would indicate a positive divergence. A positive alone wouldn't support the idea of accumulation for QE3, it would need to be large, but that is what I have been watching for and so far nothing. That's what I'll continue to watch for as long as prices move down. If prices move up, I'll be watching for either leading positive divergences, in line trade or distribution in to higher prices. So far we've been able to start answering the QE3 question and so far it doesn't look as positive as the market assumed.

AAPL-Symmetry?

Looking at the AAPL chart as a long term chart, I have to wonder if we are going to get some symmetry in what looks to be a complex Head and Shoulders top, I'll show you why.

 AAPL on a 5 day chart, each bar represents 5 days so the percentage gains aren't exact to the day, but close enough. Note AAPL gains over 6000% from 1998, probably more if I used a longer chart, during this time volume rises as it should to confirm a solid uptrend. Although recent gains look MUCH bigger, they are actually much smaller, only about 250% since the end point of the measurement from the green arrow, note there's not only a parabolic move which is the type of volatility that we often see right before a top, but also volume is not confirming as it declines in to the parabolic move. Because of the parabolic move, a long drawn out top in unlikely, but a "V" reversal is unlikely also, a tight "U" shape reversal is more in context of the trend.

 On a 60 min chart we can see what appears to be a complex Head and Shoulders top, complex simply means there seems to be more than the typical 1 head and 2 shoulders (there can be many variations on this theme, multiple heads, but usually multiple shoulders. If we count the shoulders in place on the left side, we have at least 2 and the first one may be a 3rd but it's questionable. Don't ask me why, but through well over a century of charting H&S tops, they tend to have some symmetry about 85% of the time. If that holds here, then we might expect 1 or 2 more shoulders in an upward slanting H&S top. Although this may seem to be a large top of 6 weeks or so, in context of the trend on a 5 day chart, it's actually very small and similar to the tight "U" shaped top I would expect from a parabolic move up.

 Many a trader has been fooled by rndom price patterns that look like H&S tops, early on in the recovery off the 2009 lows, there was a H&S formation in price that I didn't agree with, but many traders did, I didn't because volume in such a top is just as important as the price formation. What we look for is declining volume on the rallies and increasing volume on the declines in such a top for confirmation, it is the exact opposite of what you expect to see in a healthy trend. To help you visualize volume at the different rallies and declines in the pattern, I built a custom cumulative volume indicator in white. At the green arrows at what "might" be the first shoulder, volume acts as it should in a healthy manner following the green arrows, it increases on the rally, decreases on the decline. After that you can see rallies see volume falling off and declines see volume increasing, this confirms a H&S top.

So do we have 1 or maybe 2 more right shoulders likely after the head? It's reasonable.

 The 1 day chart for AAPL is definitely negative in a big way and right at the H&S top area.

 The 4 hour chart is leading negative at the same top area.

 The 30 min chart is leading negative, so 3C would seem to also confirm distribution in a top formation which is often short selling.

 The 5 min chart negative off the last right shoulder.

However on a 30 min chart zoomed in, we see the Head at the left, the first right shoulder starting the 26th and a relative positive divergence (because the 30 min's trend is already deeply negative), which suggests to me the probability of another shoulder on the right side of the head being created.

This is not for sure, but I think it's the highest probability and we'll keep monitoring it. If you were to build an AAPL position (I'd stay away from options for now if there's the chance of a shoulder or two coming), shorting in phases at the top of each shoulder would be ideal.


Intraday upside coming

This looks to be not much more than noise, but it's visible on the averages in the 1-3 min. timeframes intraday, it stops at 5 min and some averages look weaker than others such as the QQQ/IWM. The easiest way to show you is with the ES (S&P ) and NASDAQ (NQ) e-mini futures as they tend to lead the market. I'll show you both the 1 min intraday timeframe and the longer 5 min timeframe which is more representative of the probabilities of the near term trend, in other words the 1 min shows intraday noise while the 5 min shows the higher probability of the direction of the asset beyond noise, actual trend.

 ES 1 min intraday positive divergence, may be a ramp in to the close?

 ES 5 min negative at Friday before lower prices, positive earlier today or overnight and leading negative now, the 5 min trend is way more important than the 1 min.

 NQ 1 min leading positive 1 min intraday.

NQ 5 min negative Friday before price dumped, positive overnight and leading negative now.

I wouldn't be too concerned about upside unless you want to use it to maybe get better positioning in a short lie IBM or GOOG.

IBM Follow Up

This is what IBM looks like right now, I'm thinking I'll start a small 25% phased in entry (short) IBM in the Equity model portfolio, I don't want to use leverage here. I also want to leave plenty of room in case IBM moves higher, but remains negative as these head fake moves in the past have lasted more than a day. More or less, even with a total loss on IBM, the position size would only be about 5% of the portfolio size which leaves a lot of room to add and a wide stop. I've just seen these head fake moves last longer than this and volume isn't that large yet, this is phasing in to a position, but even if IBM broke to the downside without any further upside, there's still plenty of profit potential to make it worthwhile as price is so elevated.

*Glad I closed the IWM long , URTY when I did.

 IBM 1 min leading negative with no confirmation.

 2 min even worse.

 3 min leading negative, which is why I'm interested in starting the position now.

 5 min relative and leading negative.


 IBM 15 min hasn't moved at all toward confirmation.

and the 60 min as well as the daily are both negative, with the 60 min leading negative

Market Update

This is fascinating, I know Bernie is/was speaking, I'm not sure what he said, but there are some very interesting signals, again developing very quickly, there's still much more to look at, but for now I am showing the 2 min charts that didn't confirm, the 1 min charts next that did confirm this morning and then the longer term 5 min charts that reflect more of the trend and probabilities, very interesting and clear signals.

 DIA 2 min

 DIA 1 min now falling apart.

 DIA 5 min has remained in leading negative position.

 IWM 3 min

 IWM 1 min mostly in line

 IWM 5 min leading negative

 QQQ 2 min non-confirmation this morning and leading negative


 1 min saw confirmation, not sure which way 3C is going here as it is turned down.

 QQQ 5 min  leading negative

 SPY 2 min leading negative with no confirmation this a.m.

 SPY 1 min roughly in line

SPY 5 min  leading negative