Wednesday, October 17, 2012

More near term and long term evidence: Futures, FX, Treasuries and Volatility

Futures have had strong 3C underlying trade, in fact so strong that the signals for intraday trade have all come from the typical market update favorites: SPY, QQQ, DIA, IWM, etc.

We are just now seeing some softness in the short term 3C charts for futures like the S&P and NASDAQ mini futures (ES and NQ).

Here's a look at some different timeframes (trends) in the futures arena as well as a look at the FX markets that have a high correlation to market behavior.

 ES 1 min is for the first time today starting to show a decent size negative divergence, we'll see how the European open effects futures in about 5 hours, I'm inclined to think we'll see some softness by the US pre-market trade.


The ES 5 min chart has been strong since the move up started, while there have been a few minor negative divergences, this is the first that is starting to lead to the downside.

 ES 30 min is where the strength for the uptrend I've been talking about, is ultimately coming from. This is still a strong chart, that's why I think even with a decent pullback, we'll see more upside before this is over.


 NASDAQ/NQ
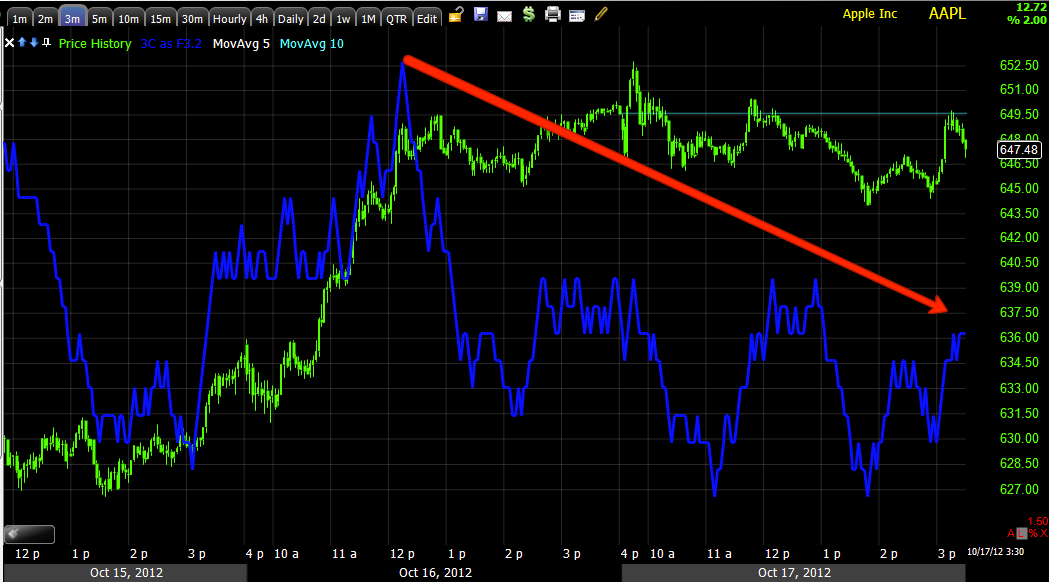
 NQ futures started off the US session with a positive divergence, that faded near noon time and around the time I said to watch for a pullback and closed long/leveraged ETFs.


The 5 min NQ futures are showing a little more recent weakness, I believe this is the rotation from Tech yesterday to Financials today as the SPX has more exposure to financials and the NASDAQ to tech.

The 30 min NQ chart shows the size of the positive divergence, not only is it large compared to the negative divergence, but it also needs to turn negative before the market is likely to turn. It appears there's a lot more upside for smart money to sell in to, as I've said, I think the move up "JUST" got started.


FX-EUR/USD
 5 min chart since this Sunday night's opening, it's apparent that the ROC is definitely falling off, while this isn't a great leading indicator, it is a good confirmation indicator.

 The daily EUR/USD shows some resistance nearby, this is exactly what could cause a pullback, the market needs to gather some strength before attempting a break through resistance, this has some correlation to the stock market.

AUD/USD
 5 min AUD since this week's open, this is more of a leading indicator and while it's losing some momentum, it's still in excellent position.

On the daily the June bottom that matches the stock market's June 4th bottom is clearly visible as is the uptrend working in to the QE3 announcement, since we have seen a longer term breakdown in this leading indicator, this matches up very well with our market and different trend expectations.

As for some other near term and bigger picture indications...

This is TLT, Treasuries, a safe haven asset that typically trades opposite the market, so a positive divergence in TLT would have a correlation equal to a negative divergence in the market averages, we check assets like this for confirmation.

 TLT 5 min is in a leading positive divergence, this suggests TLT wants to move higher, remember the market moves in the opposite direction so the near term pullback idea seems to hold more water.

 Here's a closer view, as the market averages have been turning negative on an intraday basis, TLT has been turning positive, this is confirmation and again gives more weight to a near term/short term pullback.

 The long term/big picture TLT 60 min chart is in a large leading positive divergence, this is confirmed with the market averages having a negative divergence in the same timeframes, essentially giving more confirmation of a bearish big picture for the market.

VXX/Volatility indicators.

These also move opposite the market.
 The last 2 days we have been seeing market short term charts turn negative, at the same time we have confirmation as VXX and UVXY short term charts are going positive, this may even be a quick trade you might want to consider, but it is for a market pullback only in this case.

 The intraday UVXY 2 min chart is also showing a strong leading positive divergence suggesting VXX and UVXY see upside, remember the market moves the opposite direction so our consolidation that has been lateral looks more like we will see some price pullback.

Finally the 4 hour VXX chart is leading positive in a big way, someone seems to be accumulating volatility, this is a positive signal in a big way for volatility, remembering that the market trades opposite these assets, this is more confirmation of the market averages' 4 hour negative divergences or essentially the big picture. This gives us more confirmation that the big picture, the primary trend is likely to turn bearish.

EOD Wrap

My opinion as expressed in the market updates today hasn't changed much, as I warned before the move to the upside got started, we would see days where nothing happens, days where we lose ground, but the trend should be up and that's the short term trend worth playing right now.

I and many of you closed out some leveraged long ETFs today that were bought for this bounce higher, the reason is simple, we have good evidence for a pullback, although the market has been consolidating nicely and laterally, still a pullback is the highest probability which should allow us to re-open those leveraged longs and make money on them again.

The bottom line and we talked about this before there was ANY sign of AAPL moving higher, is that a volatility shakeout of the AAPL shorts was high probability and that move has started.

AAPL could have fallen from the break of the neck line, according to Technical Analysis, AAPL should have broken lower in one of the most reliable price patterns in Technical Analysis, but we knew the odds were AAPL would move higher to shakeout new shorts that chased the breakdown and we knew that before AAPL gave a hint that it would move higher.

So why not just turn back now? The mission isn't accomplished, in fact, where AAPL is today makes for a great Technical Analysis short set up, that's why if it is worth doing, they do it right and should launch AAPL up higher until they scare the shorts out, take their positions and let AAPL fall.

The bottom line argument for the strength of a move up is as simple as this and we watched this build over the last week plus...
Since the negative divergence early in the month and the decline from that, we have seen a positive divergence building and the SPY has now moved above the accumulation levels and still maintains a positive position that should have no problem lifting the market even more, but in the very near term...
The shorter term charts are showing some negative divergences along the lines of a pullback, that gives us a new opportunity to get long and make some more money on another leg higher.

In fact, the probability of more upside (other than the job in AAPL isn't done yet) can be found on this 30 min chart that shows no hint of a real downside reversal yet.

This should easily propel the SPY/Market higher, however we already have and have had signs that this move up isn't going to last forever, but long enough for us to take profits on longs and set up short positions.

When we look at the longer term (more reliable, longer term trend) charts, they'r pretty simple, long term probabilities are very bearish.

This is the worst negative divergence on a 4 hour chart I can find in 5000 bars, essentially a very long time.

So the plan has been (and it will change if the data gives us good reason) to get in on some longs on a short term pullback, several were closed today for a profit. This move just got started, so those longs should work well.

When we see the market giving us distribution signals, we take our long profits, enter short positions and get ready for the next leg down which should be a very serious one, much more serious than the first 2012 decline (and even then, most of the core shorts made well over 20% with no leverage-imagine what a primary downtrend can do).

In the meantime, we'll keep looking for the opportunities that are showing up in sector rotation, both long and short.

As of now, the signals look pretty clean and the trends seem fairly obvious.


MCP Up 5+% Today

Yesterday I updated MCP which is more of a longer term trade as it seems to be carving out a base it can launch from, it's not along the lines of a UNG style base, it's smaller, but in my opinion should be treated as a longer term trade. 

In any case, in yesterday's MCP Update I said,

" MCP's daily chart hasn't seen any damaging moves and has held up well recently in this tight triangle.

 Here's a dip below the triangle, but MCP pulls itself back up and seems to see accumulation in these areas.

And Finally based on this chart...


And the 2 min chart turning up recently, taken with the pinching triangle, I wouldn't be surprised to see a move or breakout soon. There is clear support so a head fake move before a breakout is always possible, but I don't know that MCP is attracting that much attention."

And today's update, this may not be the breakout from the base we are ultimately waiting to see or it may be if we see some follow through, but those who are long may be able to trade around this for a nice profit and enter back around the base for the larger move, we have to let the market tell us and thus far it's saying, "Fair ball", there's confirmation on the breakout with increasing volume.

 Here's the breakout move that looked so likely yesterday I had to mention it, volume isn't huge, but we don't need it to be, we need it to be higher and that is what it is. These 4-10X volume scans are insane in many cases, everyone sees the same thing and there's no edge in that.

 1 min 3C chart with a leading positive divergence yesterday afternoon going in to today and confirmation today where so many other charts are not even coming close today.

 2 min chart with the positive divergence, again when we have longer term divergences in place and the short term charts start showing big moves in 3C, I believe this is the market maker or specialist that filled a large order, knows what is going to happen and is picking up supply or dumping it (depending on the move) in advance of the move, not only because they make a market in the stock, but because at least 30% of the daily volume is the middle man trading their own account.


Finally the 45 min has been leading positive at these breaks below support, each one was accumulated, this is why I say "Don't get lost in the lines', intraday or day to day trade can really grab your attention, but quite often things are happening that price doesn't yet reflect. 

Congrats to the MCP longs, we'll keep an eye on trade management.

Quick FXI/FXP Post

Although FXI has a strong correlation with the market, it does look like it comes down perhaps with a market pullback, sending FXP higher for at least tomorrow and that's probably a trade I would take as a quickie, as far a longer term, FXP is still building, looking good, it's the FXI correlation that is holding it back, but I get the feel that China will break before the US bounce.

Had to go for it

As mentioned in the last post, I was thinking of a very small AAPL call in November in case we don't get a pullback and just consolidation, well the position is so small it's silly, but I added AAPL November $640 calls.

If AAPL pulls back as I would think it would with divergences out to 10 min, I'd add to that position.

AAPL UPDATE

the negative divergences in the market are doing their job, at minimum they should cause a consolidation, that can be through price or time, I'd like to see AAPL and the market pullback through price to set up new positions, thus far though it has been through time.

If I had time today I'd probably open a small November Call option, VERY small allowing me room to add to it on the pullback I'd like to see, but something to have some coverage there.

AAPL in 4 charts...
 3 min negative has thus far caused a lateral consolidation.


 The 30 min is still very positive, or at least it has a large enough divergence to send AAPL much higher than we have seen and that is what we expect.

We do have a 10 min negative leading divergence, if this doesn't pull AAPL down by tomorrow, I have to think sideways consolidation is all we get before another leg higher.

GOOG Analysis/Update

GOOG is currently a core short position that is about 2/3rds the size I'd like it to be, GOOG does report after the bell tomorrow, right now I don't see any earnings leaks in it as we have caught in the past in GOOG, but I'd remind you we caught that leak at 3:45, 15 minutes before the close and their report.

In any case, here's what we have...


 GOOG's most recent run is actually parabolic, it just broke below the channel and will likely break above the channel before it's all said and done, but the parabolic move up in 2012 is not a good sign for GOOG's long term trend.

 Former GOOG parabolic moves on a 5 day chart that show they end badly, they also reverse faster than most reversal processes.

 As for the Trend Channel and the parabolic 2012 move, the Channel called a stop on the trade about 7 days ago, so something has changed in GOOG's character for the worse recently. If you were playing the trend trade here, it would be advisable to exit the trade here and not scrap for the few percentage points of very volatile trade after a Trend Channel stop, for the rest of us, we are looking for the opportunity here.

 This doesn't appear to be a H&S top as volume is totally wrong, but it is lateral trade rather than a clean uptrend, it's a change in character which leads to changes in trends.

 The Daily MoneyStream is not only locally negatively divergent, but on a longer timeframe as well, the embedded Stochastics (I think they are a measure of strength) are starting to come undone.

 The daily 3C chart agrees with Money Stream, it seems GOOG has been under distribution, for a stock this big and institutional positions as large as they are, I can see this taking a while and the signals don't surprise me.

 The 4 hour chart also shows something changed for the worse with a leading negative.

 The 30 min chart changed as well from confirmation to a leading negative and wouldn't you just guess it, right in the flattest area of GOOG trade pretty much all year, right where we normally see it.


 Recently like much of the market, the short term intraday charts are going negative

 The 5 min chart is as well and it actually looks pretty bad, but it's not that far from the market so I can't say this is earnings related.

 The 10 min chart, like much of the market also suggests GOOG has more near term upside.

 Here's the SPY 5 min chart for comparison.

I'll continue to hold GOOG short and look for an opportunity to add, we'll watch close tomorrow for an earnings trade, but for now, I think it's right in sync with broad market action.

FAS and Financials

There's a little more upside in FAS since I closed it, not much and not worth the risk to me, but I thought we should take a look as FAS is doing exactly what we thought and said it would do, opportunities?

 For FAS/Financials we had VERY SPECIFIC expectations. The price pattern interpreted by Technical Analysis and what every trader out there is doing is as the green arrows show, an uptrend followed by a continuation/consolidation triangle followed by a breakout to the upside.

We also saw a head fake move on a break below the triangle, I mentioned we'd likely see 2 head fake moves here, 1 below and the second above. So taking a look at shorting Financials is what we wanted to do with a move ABOVE the triangle, we have that today, but shorting financials may be too early considering some of the charts suggesting the broad market has more upside, but at least we have broken in to the right area.

 FAS 2 min 3C negative divergence, even though FAS moved close to about the level where it was closed after having been down,  don't regret closing it at all.

 The 3 min FAS chart has a very negative divergence

 As does the 5 min chart. If you recall, there never was a good strong positive divergence and we didn't get involved with Financials/FAS until just before the break higher as it finally showed a positive divergence.

 XLF/Financial Sector did show a better positive divergence and now is at a relative negative on a 15 min chart, not exactly what I want to short, but at least the market is moving as we expected and have been planning for.

Again, like the others at 4 hours the XLF/Financials chart is in a HUGE leading negative divergence which gives us bearish probabilities and those are the setups we want to be on the lookout for as of now. Just be a little patient and wait for the signals.

Market Update

Believe me, I'd rather be feeding you trades, but most of you take the updates and make your own trades. I just think most traders have stock picking completely in reverse, they find a stock they like with no consideration for the overall market and industry group.

Before yo can even decide whether to look for a long or short position, much less the individual stock, you have to understand what the market is most likely to do and make plans around that. How many times has understanding the different trends lead us right to trades that fell right in our laps, that came to us with tiny risk, huge probabilities, all because we understood what the market was doing and how to play it from there.

I'll keep this to the SPX and NDX in the interest of time as they represent enough of the market for our purposes.

Lets get to it...

First, here's when I mentioned the market reversal coming and moved out of leveraged longs, I don't think you can ask for much more than that as far as timing.

 SPY intraday 1 min

QQQ intraday 1  min

Now for the charts, remember the leading indicators, but we will follow this wherever it leads us.

QQQ
 First the 1 min intraday chart gave a clear signal that an intraday pullback was coming, I was concerned about this yesterday and said so, "I had hoped prices would have stayed flat and let the divergences correct themselves", but the market didn't allow that, it wasn't in the cards however rigged the deck.


 The 2 min chart on the Q's with a smaller negative divergence today

 The 3 min QQQ divergence

 And just to show you, this now reaches out to a 10 min chart so this appears to suggest a decent pullback of which we have already seen some aggressive intraday downside momentum. If things stay on plan, then this will give us a great opportunity to add again to the long positions and make more money on another leg up. What is interesting here is how small the negative divergence at the start of October was compared to the size of the positive divergence now, that would suggest a move higher of some importance and this is why I don't mind trading around the positions.

 The same can be sen on the QQQ 15 min with a small negative that sent the market lower for nearly 2 weeks and a much larger leading positive that seems to be just getting started, it appears there's much more fuel in the tank for an upside move and any pullback here is more likely to be a psychological trap for the Twitter-vertse that is bearish now, this gives them what they need to have confidence to short the market. If we are indeed going higher as expected, they'll be extra fuel to the fire.

 It's still very difficult to ignore the big picture 4 hour chart with a much worse leading negative divergence than at April of 2012 at the downside reversal, plus prices are higher making the negative divergence that much worse. This looks to me to be large enough for a primary downtrend,

So to put it together, we started our upside reversal, it looks like a decent pullback is coming in that reversal to the upside which is fine, we'll have another chance to add longs and make more money on a move that should be MUCH higher and that move should lead us to longer term short positions for what could be a primary trend down or a bear market.


SPY
 The 1 min SPY intraday signal

 The 5 min SPY, even here, the positive divergence is larger than the negative that sent us down for nearly 2 weeks. The current negative/pullback divergence can also be seen.

 At the SPY 15 min chart it is interesting because it goes negative right at the 14th, the day after QE3 is announced and we see what "could" be a much larger positive divergence, although I have trouble accepting it as anything more than coincidental at this point, however the more recent one is not and it is hitting new leading positive highs, then look at the negative divergence that sent us down the last few weeks and how small it is compared to the current positive. It is VERY hard to believe we will see anything more than a pullback before moving higher.

 The 30 min chart has the same possible coincidence for a larger positive, but even without it, the leading positive is so strong, I can't imagine the market doesn't move higher, so I'm still very much in the camp that we see a pullback, but a much stronger move higher.

 The 60 min SPY chart is very negative like the QQQ 4 hour above, it's hard to argue against the biggest picture not being very bearish.

The same with the 4 hour, look at the size of that negative divergence now!


 ES 30 min shows the negative sending us down and the positive that has formed, again, much bigger.

NASDAQ 30 min futures show the same, I'm not even sure this is a negative divergence right now as it could be just the normal pullback in 3C like we saw a few days back.

In any case, I'll be looking for an area to add leveraged longs again, after that it seems entering shorts for a bigger trend is the most probable outcome and largest trend and theme in the market right now.