Friday, May 8, 2015

Looks Like Our VIX Call Might Have Been the Right Call

After the market (cash) closed at 4 p.m., Index Futures wiped out or nearly wiped out all regular/cash market gains since 9:30. The Russell 2000 futures wiped out any and all cash market gains since the 9:30 open in after hours futures trade, the SPX and NASDAQ futures are close to having done the same.

While the Dow futures have held up the best so far, the 3C divergence there looks horrible...
 YM/Dow Futures leading negative divergence.

 TF/Russell 2000 futures retraced all cash market gains since 9:30 a.m. (red trendily)...

And the 3C chart...

TF/R2K futures.

And the ES/SPX futures...

Remember yesterday's post which was a first in my experience....Market Update: DIVERGENCE BETWEEN THE AVERAGES AND INDEX FUTURES

"The one thing I keep thinking about is the fact that few retail traders are trading E-mini contracts. In other words my suspicion is the pros are not taking on any long risk but are more than willing to sell into it which has been the exact same position I have taken. Maybe I am projecting my personal feelings regarding long risk, but I can't argue with the charts above."

What better way to end what has been a strange week and not in a good way.

Have a great weekend and looking forward to Monday morning!!!

The Week Ahead

I'm going out a bit on a limb with the very near term VXX bounce/call position and market pullback, but from what I see in assets that have had a strong correlation from bonds to currencies to the simple 3C charts and basic Leading Indicators, I believe  we will see early weakness on Monday. HOWEVER THIS PART OF THE FORECAST IS NEAR MEANINGLESS COMPARED TO THE REST SO I WOULD NOT GET TOO HUNG UP ON THAT.

I'm still expecting a $USDX led bounce in the equity market as well as the bond market, certain stocks are going to be shorts before others, but this gives us a chance to open or add to any positions we may want to tweak a little.

As I have tried to make clear, it doesn't look like smart money is even participating in this move, thus my own participation level is so low at present having closed VXX puts today.

In comparison to what comes next, this bounce is nearly meaningless like Monday morning's forecast.

The main theme is strong market weakness and any chance we get to open or add to positions we like should be taken. There's simply no comparing the "bounce" charts (of the bounce expected) with those of the distribution and broad deterioration through all of 2015, but increasing at an exponential rate since the April 2nd forecast of triangles to be finished and a false breakout above them which we have seen already, the deterioration there is beyond anything I've ever seen.

Try to keep the bigger picture in mind as it is not off in the distant futures, we are in the middle of it right now.

Trade Idea-EXCEPTIONALLY SPECULATIVE...VXX Short Term Calls

I'm going to go ahead with a VERY speculative size VXX Call position for a 1-day or so bounce, the expiration I'm looking at is May 15th as I expect it to be a VERY short term trade and the strike is $20.00

Again, this is in my opinion, the kind of trade you only take if you are willing to lose the entire premium which is why it's such a small , speculative position.

The Treasury Counter Trend Trade

Treasuries have to be one of the thickest short positions right now, thus primed for a short squeeze as their decline recently has been near record setting.

This is not the reason we entered the TLT long (meant to be an options trade/Calls, but I couldn't get the tracking portfolio to recognize the ticker for the position so I used TBT short instead to create a 2x long TLT position), Trade Idea: Long Bonds / TLT

I said very specifically in the post above,

"I'm going with a half size position in TLT (20+ year Treasury Bond Fund) June 19th (monthly) CALLS with a strike of $122. If TLT pulls back a little, I'll add the second half of the position."

Then I posted the charts here, Bond Rally / Swing.

To be clear, I see this much as I see the $USD trade, a Counter-Trend swing, but counter trend moves in a bear market (which both are either in or moving toward, are SOME OF THE SHARPEST RALLIES YOU'LL SEE. Just look at the first rally after the initial Dow 1929 crash, it was nearly 6 months and was good for a +50% gain without any leverage. 

This is because a counter trend rally must be strong enough to overcome the presumption that bonds are in a bear market, which means the emotional component of touching on the "Greed", "I don't want to be left behind" is essential. The initial short squeeze provides a good deal of the upside momentum initially and after that traders start to wonder if "maybe" the rout in bonds is over and they are worth investigating as a long position. This is not specific to bond, THIS IS THE BASIS OF WHY BEAR MARKET COUNTER TREND RALLIES ARE THE STRONGEST RALLIES YOU'LL SEE AND WHY I'VE DECIDED TO PUT TLT (20+ year Treasury/bond fund) out there as a long swing trade.

Today as expected, TLT was up, but also as expected as I left room to add on a pullback, it looks like we will get that pullback.

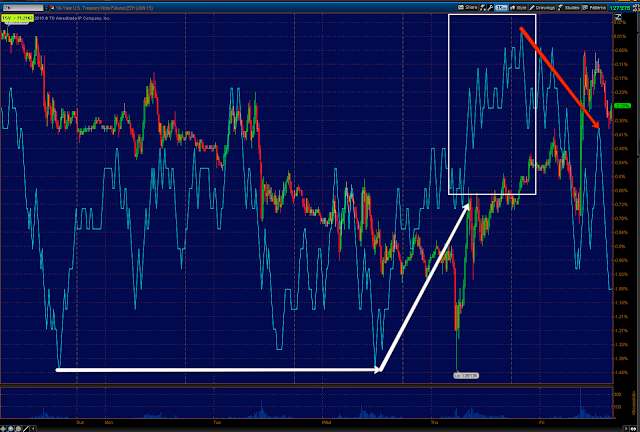
Here are the charts via TLT and Treasury Index Futures...
 TLT intraday 1 min in the green on a gap up as expected not only because of the charts, but on a surprise in the Payrolls data this morning. I SUSPECT THERE WAS A LEAK.

This tells us that a near term pullback is likely even though the position entered yesterday went green today. I left room specifically to add based on expectations we'd see a pullback as the chart above indicates.

 The 3 min TLT chart is a bit more clear with less noise, showing both the near term positive (larger) and the very near term intraday negative (smaller) today.

The 5 min 30 year Treasury futures show the same thing...

 5 min 30 year Treasury FUTURES showing an inline or price trend confirmation signal in 3C at the green arrow/downtrend in Treasuries.

Then the positive divergence and the pullback expected since yesterday near term which will build a slightly larger base "W" probably, to support the upside move. Small or sharp "V" bases are just like the foundation of a skyscraper, if your foundation is not strong, what you build upon that will be subject to the weakest link which in this case is the base or foundation, thus it needs to be widened out which is why I only entered a half size position yesterday.

The longer 10 min chart however shows the positive divergence that has accrued on the longer term charts and is telling us a counter trend rally/bounce is highly likely.

 The 5 min TLT chart tells us the same. The green line is the minimum price target based on where the divergence first started, however we usually suprpass that target by multiples.

And the longer/stronger TLT 30 min chart with distribution leading to the downtrend and now a leading positive divergence, not as big as the distribution so I suspect we get a strong counter trend bounce/rally, but at the end of the day...Bonds go on to make a new lower low which we should catch as another trade when the time is right.

VXX Follow Up & Market Update

I am combining these two posts because they are inseparable as to the reasons for taking the May 15th VXX $21 and $23 Puts off the table, even though we have a strong 10 min divergence in the averages (positive) and VXX (negative) suggesting the market has more to this move, I can't rule out a near term gap fill and with May 15th expiration next week, I can't afford any loss of momentum or consolidation, thus I decided to close the VXX put positions (for now) and book those gains which have only deteriorated since closing the two put positions.

First, here's the P/L for the VXX May 15th $21 and $23 Puts that were just closed at 12:21 pm EDT, Taking Both VIX Puts off the Table


Our VXX May 15th $21 Put had a cost basis of $.56 with a fill today of $.80 for a gain of +.42%


Our May 15th VXX Put with a strike of $23 had a cost basis of $1.69 and at a fill today of $2.49, the P/L came out to be a gain of +47%, not quite as good as if they had been closed a bit earlier  but still a decent gain for a 1-day move.

As for the charts and reasons, one of the main reasons was the expiration and increasing Theta decay of the options as they expire next week so even if this move is going to make another higher high, if it consolidates or fills the gap first, we'll have trouble that is just not worth taking the risk of when we can always re-open a new position with a longer strike and while we have a very respectable +40% to near 50% gain.  Bulls make money, bears make money, PIGS GET SLAUGHTERED".

 VXX 1 min intraday showing interesting leading divergences.

UVXY (2x long VXX) also showing interesting intraday positives.

XIV, the inverse of VXX showing a confirming 1 min leading negative divergence.

VXX 2 min also leading positive so there's some evidence of migration or a strengthening divergence.

UVXY 2 min confirms the same thing is occurring. While price would move similarly in UVXY as a 2x leveraged version of VXX, volume can and usually is totally different. If there weren't true, actual confirmation, it wouldn't show up hurter. The point is, just because these assets are locked t move in unison with regard to price, the actual demand via volume can be totally different, the 2x leveraged ETF is mandated to move 2x the underlying, IT IS NOT MANDATED TO MATCH VOLUME.

 XIV 2 MIN which is the inverse of VXX is confirming with a leading negative divergence and no confirmation the same as the averages (which it moves with as VIX moves opposite them).

 VXX 5 min is starting to see migration of the divergence to a strong intraday timeframe giving me some pause and concern as this just became more than simple intraday movements as the 5 min chart is the first or earliest timeframe I consider to show institutional movement intraday.

 XIV 3 min leading negative

And for now, VXX 10 min is still in line with the move lower as the averages are with the move higher. This doesn't mean a near term gap fill is not possible which would kill our VXX gains.

XIV 5 min leading negative as well

As for the averages, hopefully the charts are still relevant as these are fast moving intraday timeframes and it takes some time to capture and post them.

SPY
 1 min showing intraday deterioration in line with VXX findings.

SPY 2 min absolute lack of confirmation, not even trying. As I speculated earlier, this may be because the $USD hasn't moved much and I made a strong case yesterday for a $USD based or supported move.

SPY 3 min seeing some deterioration,

QQQ
 QQQ 2 min seeing the same and no confirmation which on this timeframe could have happened within the first 15 minutes of the market open.

3 min leading negative deterioration which is getting more serious, at least near term.

And QQQ 5 min showing the minimum 3C based price target on the upside according to where the divergence first started on this chart as we often see price move to that area as a minimum target, often exceeding it (at the green trendily).

The relative negative is obvious and while relative divergences aren't as strong as leading divergences, the fact that it is on a stronger 5 min chart is the issue.

 Like the SPY 10 min, the QQQ 10 min is still leading positive suggesting for now that we have more upside to go, but I can't rule out a gap fill first as FEW THINGS MOVE IN A STRAIGHT LINE IN THE MARKET (except perhaps an intraday short squeeze).

IWM
 2 min negative which may not be a big deal on its own,  but this is why we use MULTIPLE TIMEFRAME AND MULTIPLE ASSET ANALYSIS AND CONFIRMATION. Each chart is a piece of the answer, not the answer in and of itself.

IWM 3 min seeing increased intraday leading negative signals.

It simply was not worth putting those hard earned gains at risk when we can always re-open a new and more appropriate position if need be.

IN THE TIME THAT HAS ELAPSED SINCE THE CLOSING OF THE VXX POSITIONS, THEIR GAIN HAS BEEN CUT BY 1/3RD.

Trade Idea : NFLX Short (Equity/Puts)

I already have a full size NFLX equity short in the tracking portfolio, I'm going to start another here to keep track of this trade, I'm inclined to leave a little room to add to, maybe 75% of a normal full position leaving 25% to add to if we get a better price based on a $USD based move, but other than that, NFLX looks to be pretty close to the area I've been looking for since the last earnings gap

As for options, I'm going ahead with a nearly full size NFLX Put with an expiration on 6/19 (June monthly) and a strike of $570, they are at a discount today.

I'll have charts for the broad market and NFLX up shortly.

Taking Both VIX Puts off the Table

For now any way...

Still Strange...

Yesterday I noticed strange behavior. Actually well before yesterday. Below you'll see 3C charts of the major averages with leading 10 min positive divergences that appeared virtually overnight out of thin air, not the "normal" process of a divergence strengthening as more and more shares are accumulated, the process of migration in which we first see a divergence start on 1 min charts and as it grows stronger moves to 2 min, then 3 min , 5 min so on and so forth. However by the time a 10 min chart is leading positive, it usually has quite a sturdy, wide base as this is a process. These 10 min positives are like towers that popped up out of no where, almost as if this morning's knee jerk reaction to the NFP revision of March payrolls was leaked information.

Yesterday I posted some of this strange behavior in Market Update: DIVERGENCE BETWEEN THE AVERAGES AND INDEX FUTURES.

In any case,we have what we have and thus far we have positions at gains on the move so that's what we have to work with, I just want to protect them.

 Looking around this morning, the TICK Index is INCREDIBLE, I've NEVER seen anything lie it to my recollection...
 The TICK Index hit an extreme on the open that I don't think I've ever seen before, +2320. $1500 is a strong/extreme reading, I believe 1850 or so is the highest I remember seeing, I don't think I've ever seen +2000.

However look at TICK since, in a tight range of +750 to -250, that's also an EXTREMELY dull range, something more akin to a Max-Pain options expiration pin, although I'm not saying that's what it is, it's just reminiscent of that.

One thing I noticed is the $USDX did NOT rally, this is kind of the centerpiece of the market which I showed in last night's Daily Wrap.
 In fact this 5 min chart looks like near term $USDX may even pullback a bit.

However I have little doubt it's going to rally....
 This is the much stronger and solid 30 min leading positive $USDX divergence. This almost makes me wonder if perhaps we get a gap fill and another move on $USDX strength?


However, while divergences like these stand, I doubt I'll be closing any positions opened for this move unless I have very good reason...

SPY 10 min leading positive, but again notice how quickly it formed, off a "V" bottom!

 IWM 10 min leading positive, this at least is a bit more solid and why I have favored the IWM as underlying trade looked better.

And the QQQ with the bare minimum upside target based on where the 3C divergence first showed up on the chart at the green trendily.

Again, this is an odd divergence to form so quickly on so little base.

VXX 10 min is confirming leading negative, but don't forget this has teeth that will be brought to bear (no pun intended) soon...

The large and leading positive VXX 15 min chart. Notice the difference between the construction of this divergence with a sturdy base, a strong process building this divergence vs the 10 min chart just above this. This is a monster of a divergence, the other will still work as it has, but it has no where near the strength or staying power that this one does.

 High Yield corporate credit is often used as a lever to help move the market, although I'm not sure if it was needed today. It's also an institutional risk asset and they are wasting no time distributing in to the gap on this intraday 1 min chart.

Here's the 60 min trend in HYG of pure distribution. You want to know what smart money is doing with risk assets? Look above.

In any case, from my perspective it's a strange lot of charts, that shouldn't change anything for you/us until we see what I suspect will be very fast and strange looking distribution signals which is why I didn't take on any more long risk as noted the past 2 days.

Just some thoughts so you'll know where we are at and I don't need to explain a lot when things change quickly. I see no reason we shouldn't have the same fore-warning we had for this move so I'm not saying that to scare anyone.

Market Update

Last night I said,

"If there's another very weak print and there's some evidence to suggest it, then I'd expect equity strength, treasury strength, gold to sell off, $USD strength, etc. However that's just conjecture until we see the print, we were massively surprised last month, perhaps it surprises in a surprising way."

And we were surprised equally this month, just not about this month, about the horrible last month's print , revised lower to 85k from 126k ?

WOW! In any case most assets are moving as predicted above, but even though we have been expecting a bounce and have positioned for it, I HAVE TO TELL YOU... I've given the market enough time to let indicators catch up and I'm not thrilled about the confirmation or lack of it.

Take QQQ for an example (and I don't say this to rain on anyone's gains, this may al change, I just want you to be able to keep those gains)...
 1 min chart hasn't made any effort to confirm the gap up...

It "looks" like the 5 min chart is confirming or in line, but this leading positive divergence was there yesterday, price just moved toward it, that's not confirmation.

And the 10 min leading positive chart hasn't moved today.

I guess for now, it's better than distribution signals, but I'll be watching close.

I'd normally say with a divergence like that we should have a couple of days of bounce in the tank.