Tuesday, July 23, 2013

Email Scam

I've had several members say they received an email from me (Bt46n2 at g m_a_il), I believe it is called, "Review these documents".

This email was not sent by me.

I have changed my security/password for my normal email account.

If anyone is familiar with this scam or any other steps that should be taken, please feel free to contact me.

Sorry for any inconvenience.

AAPL Excitement

I have to run to a store before 6 p.m. when they close and I've been waiting for AAPL. I don't even know what they announced, but I see the after hours bid/ask on my chart flying so I'll check it out when I get back.

Could it be, 3C really pulled some kind of bottom feeding Wall Street scam off the ocean floor?

QQQ Update

I'm getting the feeling 1 of 2 things is happening, based on how fast the AAPL 1 min went positive yesterday (extremely fast and deep), there's some sort of AAPl earnings leak that is bullish for AAPL and thus the Q's or 2) as I said, whatever the earnings are, Wall St. will create the sentiment and the market will trade up based on that, fill the Q's gap and maybe some.

The 3rd thought I'm having is I'm glad I have started and nearly finished the longer term, equity core short positions, whichever way this goes in the near term because there's very little dispute with the big picture that is as about as close as it can be, perhaps so close that it's not visible (like standing 4 inches in front of a big screen tv).

 First here is the 1 min QQQ chart, you can see where the stops were congregated, it would make for a great head fake move, "if" the intention was to lift the Q's near term, which is what I've thought since Sunday night.

The NYSE TICK chart is BARELY NEGATIVE at -500?!?!? What the Heck? You'd think with price action like that it would be -1500.

The QQQ has an interesting range doesn't it, it's somewhat disguised as a H&S top, although it is no where near that formation, many traders would interpret it as that because they have no idea what one is.

However the range is what is really interesting, is it camouflaged?

 QQQ 2 min just went positive today, hasn't seen much damage, a short term chart like this goes positive right before a reversal move.

 QQQ 5 shows the leading negative is the big picture, but the 5 min short term has held up pretty well.

This is the bigger picture and ultimately where I want core shorts positioned.

 Just look at the SQQQ 10-15 min leading positive, but still that gap, otherwise it's nearly perfect for a longer term position.


AAPL Update

If there ever was a time for a head fake move in AAPL, this would be the one, but I have no idea what to make of it unless A) there's some leak in AAPL earnings or B) they don't care, they'll just spin sentiment the way they want and retail doesn't care what the earnings are if AAPL moves up AH.

I'm as puzzled by this move as I can be, but we'll see when the weight challenged  lady sings.

 You see that volume under intraday support where all of the stops or limit orders were congregated? That is the reason for a head fake move.

AAPL 1 min seems to have almost no damage at all, it doesn't really fit except with a true head fake move, but there's so little time left in the day, Does Wall St. know AAPL will have a good reaction to earnings or will they create one?

And the 5 min chart is still hanging in there, VERY strange

$USD

Considering the legacy arbitrage between the $USD and commodities, gold, oil, silver and yes, stocks (in modern vernacular a cheap dollar means inexpensive stocks to computers - there are exceptions, especially when $USD based carry trades like $USD/JPY are pushing market risk, but on a long term legacy basis...), beyond whatever else we have collected today (as I'm going through leading Indicators), this $USD vs SPX chart looks very interesting, lets see how it plays out.

$USD in orange vs the SPX in green intraday. The $USD is rather flat as the SPX and other averages make various short term bottoms (like "W" in the Q's), then suddenly the $USD falls and the SPX goes to make a new afternoon high.

Tactical and Strategis Situation Favorable

I'll do my best to make this simple although there are dozens if not hundreds of moving parts that all go in to making the outcome a high probability outcome, but more than that it needs to be an excellent entry which means low risk.

For those of you using risk management like the 2% rule (which can be found linked at the upper top right side of the member's site) and are familiar with position sizing relative to risk on the position, then you know that the less risk there is per share, you can either increase position size (with caveats like maximum position size to guard against gaps and to diversify, but not over-diversify which in my experience kills portfolio performance) or you can allow for wider stops and add to position size later, with shorts this can be done with very a favorable mechanism, I write about it in "Making more than 100% in a short"  , but this must be a true equity short, not a short/inverse ETF.

In any case, the idea is to get in at the best levels, but with the strongest underlying weakness, head fake  moves tend to be the best option.

So here's the idea when looking at multiple timeframe analysis with ES (SPX E-mini Futures) as well as the VIX (custom DeMark inspired indicator that is very accurate with VIX signals).

First the VIX signal as posted last night in the after market post.

 This is the last VIX long signal in January near the lows leading to a move higher, typically they are even ,more timely than that one was. Yesterday we started the first long signal, today it continues, today the VIX also is +3.74% higher which is what I'd hope to see considering where we are in the market cycle.

The longer the timeframe, the more important the probability of the trend because it represents much larger underlying flow of funds, this 4 hour ES  leading negative divergence with no accumulation at the bottom seen here (it was not strong enough to make it here) is a very bearish primary trend and ultimate trend probability.

ES 4 hr.

The 4 hour chart by itself just shows us what has been the predominate trend in underlying trade over a longer period and in much greater flows of money, but without multiple timeframe analysis it's just telling us that there's strong distribution, it's not giving us a probability of timing, it does give us a probability of how bad things will be when the collapse comes. I did a study of all major tops since the start of the 20th century and many of the divergences now are worse than the 1929 divergence which you might be surprised to know, was not as big of a surprise to Wall St. as it was to main street, after the roaring 20's, smart money like JPM himself, were moving out of the market, apparently seeing a bubble that was no longer justified.


 ES 2 hour gives us confirmation of the 4 hour chart and some more detail, it also helps to narrow down timing, if it were still positive it would not be likely we were close to a reversal point.

The ES 30 min chart is still a very serious timeframe as far as underlying trade, but it's more detailed and shows that there was strong distribution in to this recent top, July 8th still figures prominently as a date when something spooked the market.


ES 30 leading negative at the highs shows you what a head fake move is used for.

ES 15 min is negative, now we have a good chain of negative divergences, when more timeframes are saying the same thing, we are much closer to an actual pivot. However there are many other indications that go in to timing.

 The 5 min chart now being negative is another nasty sign.


Only the 1 min chart for ES is positive, the strategic and tactical view here is that the main strategic view is the market is severely damaged and has little to hold it any longer.

Tactically speaking, because of the same things, any upside in the market makes for high probability, very low short entry positions.

As the 1 min fails, we have all timeframes negative, this along with some leading indicators is an outstanding signal in multiple timeframe analysis, so this is not just an ordinary run of the mill day or week.


QQQ / AAPL Update

This is great, this is the "Week Ahead " post from Sunday night and specifically about QQQ and AAPL (you can go to the link and ctrl+F and type in "AAPL" for the remarks as it's a long post)...

"Remember in Friday's post I talked about the Q's filling the gap? AAPL sure would be helpful in that task and a such, I've recently gone from "Holding the long term AAPL equity position to closing it and now even thinking about a short in AAPL".

The last bit, AAPL "Short", this kind of probable move would be likely to set up that AAPL short, I am certainly thinking about it as a pretty high probability, in other words it's on my radar, but what about the AAPL/QQQ calls from yesterday and today? They are meant to be VERY short term and that's why options were used, I even warned in a post today that it may even be a day trade. 

If AAPL sets up at higher prices with distribution in to them, I'll be looking at an August or maybe September AAPL put or (depending on the chart's severity), possibly even an AAPL equity short. Other options would be XLK or QQQ shorts or puts, TECS, etc.

As far as the comments above from Sunday night's "week ahead", you'll notice the AAPL charts look better than the Q charts, AAPL represents about 20% of the price weighting of the NASDAQ 100, or roughly the same as 50 other NASDAQ 100 stocks combined.

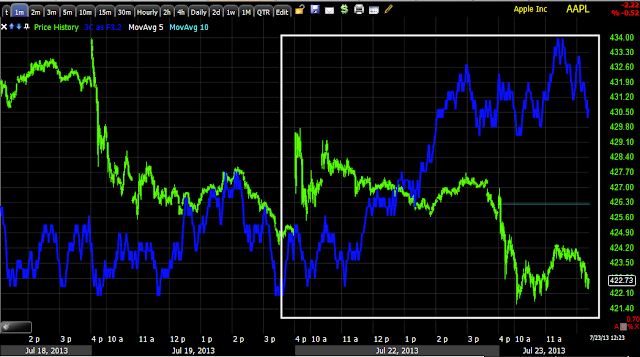
 You saw how far the AAPL 1 min chart was leading positive, I don't need to show that again so I zoomed in to intraday action only and as I suspected a "W" type formation, look where the intraday chart goes leading positive, at the second bottom of the "W".

The AAPL 5 min chart wasn't positive yesterday, it started today at a.m. lows and then the second part of the "W" today.

AAPL 10 min is still showing AAPL upside to be best used to short in to.

QQQ 1 min, note where the positive divergences are, at each of the bottoms of the "W" pattern with the second bottom being stronger than the first as is often the case and often seen right before a launch.

 QQQ 2 min, the same "W" theory played out here, but note the QQQ charts are much weaker than AAPL, thus as I said Sunday night, the Q's will likely need AAPL.

QQQ 3 min is barely positive at the second bottom of the "W", VERY weak overall.

QQQ 5 min is leading negative with in line as good as it gets intraday so yes, the Q's absolutely would need AAPL.

Going with the QQQ Aug. $74 Calls

 A little late, but should be fine. If they run AAPL, I think it has to be before earnings

USO / DTO Update

This is more of a head's up for any tactical positioning you may want to do. The USO put I have open is August $38 and I think it will be fine, the DTO (2x short crude) equity long is meant for a longer term trending position than the Call position.

There should be a bounce in USO and Brent, it's nothing unusual or game changing, but I figured I can see it, I'll let you know and some of you might even want to use it to your advantage if you want to add to or start a new position in oil (short) of course we want to see the intraday charts go negative (distribution) on any bounce as confirmation and timing for new positions, but I'm not concerned about the trade idea, just a heads up on position management.

That said, oil does remain speculative with events on the ground in MENA.

USO represents WTI crude (West Texas Intermediate) whereas the CL futures below are Brent E-mini's, but the difference between Brent and WTI pricing has collapsed and they are about as close to each other as they have been for quite a while, in other words, I don''t think it effects the analysis by hopping from USO to CL.

 USO 5 min chart with a negative divergence right at the head-fake highs, note the scale of the head fake and the scale of the reversal, they tend to be proportionate. 

The 3 min chart shows the positive in USO better, but the 5 min chart shows the context better, yes there's a positive, but within a very normal (bounce) context.

 USO 10 min deeply leading negative at the head fake, look at how negative, how fast USO goes at the head fake or failed breakout, this is why these are so important for timing and great for entries, not to mention the much lower risk, but they are harder emotionally to enter as that is a new high for the period.

 USO 60 min has seen a sharp leading negative on a long term/important chart, no 5 min chart is going to turn this.

This is Brent futures, 15 min shows the positive within the context of a larger leading negative divergence.

Again, the high/head fake or failed breakout is where distribution picked up, if you read my head fake articles you know why.

 The CL 30 min chart, again any one buying the new breakout highs was left holding the bag, one of several reasons for head fake moves. The deep leading negative divergence and the positive divergences' size and scale within that should give a sense of context, thus I'm not concerned about the trade, it's just tactical.

The CL 4 hour chart, deep leading negative, this is one of a few reasons why I don't think any bounce in Crude is any danger and probably represents more of an opportunity than anything.

AAPL Add to- Change

If I were going to add to AAPL, which I have seriously considered because of today's continuing signal, I'd do it through the QQQ's with Aug. $74 calls, I've been slapped around too many times with options before earnings based on high implied volatility.


Market / AAPL Update

Why both, because I think near term (today), they are inseparable. The Q's have a pretty decent gap and if there's one thing that has defined the era of HFT trade, it is that no gap is left unfilled which is a shame because break-away and exhaustion gaps were so reliable and gap resistance/support was the best you'd find.

I mentioned yesterday or the night before actually that the Q's would need AAPL, I don't know anything about a leak in AAPL earnings and I still think the bullish action that was in AAPL was counter trend rally based as a leak in earnings (unless it was a product that no one knew about), wouldn't explain the AAPL base forming over a quarter ago (earnings out of the question).

As you know, based on the AAPL 1 min chart yesterday I opened a VERY speculative AAPL Weekly (July 26) $425 call, I "might" add to that today "if" things move in the right direction, but it wouldn't be uncommon to run AAPL up right before earnings leak or not.

Remember the earlier 1 min positives I called out this morning in averages and Index futures?

 SPY 1 min positive has grown since then, remember the price formation since the positive divergence started...

SPY 2 min is more or less in line which is an improvement from the earlier negative, but not positive yet. Still with a 1 min positive only the chances (intraday )
 are 50/50 between a price consolidation through time and a pullback, add the 2 min chart and through price becomes the highest probability (in this case that would mean an SPY intraday bounce, which would be fine as long as HYG keeps seeing worse and worse negative divergences, it would actually be the most common scenario.

 Now look at the 2 min QQQ leading positive, interesting huh?

The IWM is along for the ride, but not really leading anything.

The reason I asked you to remember the SPY price formation since the positive divergence is because it "looks" like a small "W" base might form, that would make way for a stronger intraday move than just a positive at a reversal point as we already have.

 AAPL's 1 min leading positive was so sharp yesterday I took a chance on those weekly calls. Today it's even sharper.


Also popping up is an AAPL 5 min leading positive divergence, on this alone I think yesterday's position at speculative size (about half of even the smaller size option positions) is warranted and if there's a "W" with a continuing positive, I may add, this VERY WELL could be a day trade though so keep Reg. T in mind if you are thinking about it and aren't compliant.

As far as the bigger picture in AAPL, nothing has changed- 30 min.

AAPL may very well be the market's pivot point today or asset that all the action is based on.

IYT / Transports Update

I've had several emails about this one, I have an open put position, but considering the overall position and tone, I wish I had made that a straight equity IYT short and thought more toward the longer term.

In any case, here's what we have, I think IYT can be had at better prices, you may need to set some alerts, you can of course jump to the sub-industry components of DJ-20 (Transports) and look through those for more specific trade options, I may be able to look through those 20 if we get a little slow down here.

 This daily chart of IYT would not be a major head fake or failed breakout, but it would be one nonetheless, typically I expect more volatility on these moves, but recently the volatility has been lower as have been the moves. Last night I reviewed some historical tops and the head fake moves in those were not very large, but then again the use of Technical Analysis against retail traders has only increased if anything over the last several years.

At the yellow rectangle, (the one Technical Indicator I still trust is Candle Sticks), we have a near perfect reversal formation right at the area of the head fake or failed breakout, it's nearly text book with a large bodied breakout candle from an ascending triangle as Technical traders would expect and since I already had the trendlines drawn in, I'm almost certain the last IYT update would have warned to look for a head fake move out of the ascending triangle. As a matter of fact I did a quick search and the last update on July 19th IYT / DJ-20 (Transports) Short said this...

"This is the triangle I mentioned, bullish ascending triangle, traders would be waiting to go long on a breakout which is why I was waiting on the breakout, but information was already in place that probabilities were sky high it would be a head fake/bull trap."

Obviously there were some updates just prior to this as that is what I was quoting from.


 There's the volume that a head fake move is good for among other things, if you still haven't read, "Understanding the Head Fake Move" articles linked on the member's site, you are missing a key market concept that will not only give you a new understanding of the market, but how to use that to your advantage,

The 60 min IYT as well as DJ-20 which looks almost EXACTLY the same, are negative here, even worse on shorter timeframes.

This is all I'm concerned with right now, an opportunity on the 2 min chart, a small positive divergence. This could give us either an add to position or for those who are interested, a new short position at an excellent price point and lower risk.

Here's the DJ-20 (just because I already had the trendlines drawn in on StockFinder for the ascending triangle breakout, the 5 min chart clearly shows the distribution, therefore the head fake or false breakout (one in the same) which we already expected as you saw from a previous post based on the charts that were in place at the ascending triangle.

If interested, I'd set some upside alerts, I will too and we'll take a look for a good timing/entry area.

URRE Adds another 15% So Far

Congratulations URRE longs, you had to wait, but it is looking more and more like this is moving to stage 2, at some point there will be profit taking and a pullback, new URRE longs can enter at that point, but for now we'll keep monitoring and confirming, thus far other than intraday profit taking here and there, URRE is holding up very well.

 Adding another 15% today for a 2.5-day move of +48% and on good volume.


The 5 min chart is not breaking down so this looks good so far.


It's redundant if the 5 min isn't breaking down, but the 15 min is also very healthy right now.

Looking good. Congratulations, patience pays.

High Yield Corp. Credit (HYG)

I talked about this asset a lot the last several days because it's one of the most important signals right now, the market is broken, it's like a child's tooth just barely hanging on, HYG is an asset that can basically help us narrow down "When the tooth drops".

Take a look at what we have, especially from where we have come. From what I've already shown you, HYG was not being used as a mass, "Risk on" asset, I'm sure some used it as a trading tool, but the majority of the money was long gone, that means it was used more of an arbitrage asset to HELP the market on the upside as the market didn't have enough of its own juice. The SPY Arbitrage is a quick, dirty way of seeing when these assets are being used as market levers, but just looking at the 3 (HYG, TLT and VXX), you can get a good feel for when they are being deployed, as I said last night, the abandonment of HYG positions, even small ones will be a key timing indicator, even more so in the thinner markets of High Yield credit.


 HYG with simple momentum indicators has the gentle roll that would be consistent with a topping process, typically a bit more stretched out than the averages in a case like this because HYG is the cause and the averages are the effect.

Even with simple ROC on price, MACD (26/52/9) and RSI (6), the negative divergences can be seen, by the way, MACD divergences or RSI or Stochastics divergences are typically the best use of the indicators no matter how they are most commonly used, for MACD, there are typically 3 parts to the divergence for a solid signal as you see above. This is just a simple momentum screen, but the point is the change in character, changes in character precede changes in trend.


 This is the late day HYG intraday negative I posted yesterday, even though a 1 min chart it was a big deal. why? Because HYG is only supported by 1,2 and 3 min charts, the rest have left town.


 HYG 5 min in a flat range.

HYG 10 min

The larger mass migration out of HYG a while back on the 15 min'

And the 30 min.

This is one of the key assets to be watching for market character, health and timing (health is used VERY loosely and very short term)