Tuesday, April 7, 2015

Daily Wrap

This afternoon, after watching the trend in 3C deteriorate more and more (see market updates), after taking a look at as much data as possible and trying to put together the pieces, I think the AAPL example in this afternoon's Market Update was as close on as we can expect. See the bottom of the update for the specific subject matter at hand, the rest of the charts are of value in judging the process and where we are.

Essentially the increasingly tight range of the last 7 to 8 weeks as represented by these triangles, is similar to a Bollinger Band pinch in which volatility dies down or coils up like a spring and then energy is unleashed. The same concept is true of triangles when they reach maturity and the two trendlines converge to form an apex,  this is how last Thursday's near term forecast was so close in the actual move expected early this week (yesterday).

Although I already went over the various market averages and how the triangles differ (some being symmetrical, some being right angle triangles) as well as how sloppy they are (they don't make for nice trendlines), the pinching range and volatility can be seen with the naked eye without the help of trendlines.

For example, the SPY...
 While the trendlines themselves are sloppy and not well formed, the pinching volatility (despite a pick up in intraday volatility) is what was important as well as the appearance of the apex of the triangles (breakout or breakdown point).

What I was trying to demonstrate with the last Market Update and AAPL in particular was a corrective pullback today which is right in line with the textbook Technical Analysis concept of breaking resistance (the top trendline of the triangle) and re-testing it (they pullback at the yellow arrow above).

Whether this was meant to be or just happened, I can't say for sure as the 3C divergences are moving along a trend rather than the intraday steering divergences and they did not look good yesterday and in almost all cases even worse today as demonstrated in the Market Update.

Below is an example of the pinching volatility of the market using Bollinger Bands, it's not a perfect demonstration, but close enough.
 Note the width of the Bollinger Bands on the SPY 2-day chart above at the yellow arrows to the left and the pinching of that volatility to the far right at the other pair of yellow arrows, this is almost always a dead giveaway to expect a highly directional move, although you need additional indicators and information to tell which way the break will occur.

I was asked why I used AAPL for Thursday's post, IMPORTANT: AAPL Set-up & Market Movement, as a market proxy. Honestly if you recall that day, I was going through a watchlist of numerous stocks as well as market averages looking to see if there was a trend or pattern among them as last week was so difficult to extract any meaningful information from the market without torturing the charts.

The fact is, I could have used any number of different stocks or market averages as an example, I had just seen enough to realize there was a pattern by the time I looked at the AAPL chart and it had a better formed triangle as an example with strong 3C charts for multiple timeframe analysis (multiple trend analysis).

Looking at AAPL, although this chart doesn't show the triangle as large as it really is (the lower trendline should stretch back further), we can see the forecasted breakout from last thursday's Market Forecast and today's pullback to what was formerly resistance, after the breakout it becomes support which AAPL tested today, a common textbook concept in Technical Analysis, also one that is often used against traders.

Looking at what the market has really done since the triangle's axis at the apex which is a period of 37 days, or just over 7 trading weeks, you can see why it has been increasingly difficult for short term traders to stick with any move for very long.
Along the axis of the triangle's apex from 2/2/2015 to present, there's only a slight move of -0.36% with March getting tighter and making it harder for options traders or swing traders or really any kind of traders to stick with any move long enough to make it worthwhile (depending on individual trading style, risk tolerance, account size, etc.). I pointed out the exact same thing Thursday and at the bottom of last night's Daily Wrap with an AAPL chart as of the close Friday with a  meager +0.03% gain which is for all intents and purposes dead flat, but this isn't just AAPL, it was merely a proxy for the broader market. There are exceptions to every rule, but generally any individual stock's movement is influenced by the broad market to the tune of about 66%.

before I leave the subject of triangles, there's a small tightening triangle in the spot VIX just under the 50-day moving average, that looks like it could be a mover to the upside not too far off which fits with our broader analysis beyond this week's head fake triangle breakout or expected failed breakout based on the charts.

As you probably saw again today in an excerpt from Thursday's IMPORTANT: AAPL Set-up & Market Movement in today's And There It Is, Less than 2-Market Days! post, our expectation or suspicions about what would not only happen on Friday morning with the Payroll data, but after with F_E_D comments...

"The NFP tomorrow could be the catalyst for such a move (the breakout of the triangle I was pointing out),especially if it comes in on the light side and even more so, if the conspiracy minded crowd is right that the F_E_D could use that as an excuse to kill $US Dollar Strength by mentioning something DOVISH like, "We probably won't hike rates this year" or something mentioned about QE4. 

Was right on with Kocherlakota's comments at a pre-arranged speaking engagement today, not only mentioning "Not hiking rates this year", but mentioning a case to be made for "Asset Purchase" which is the same as saying QE4, without giving it the title.

Last week you may recall not only a gut feeling, but the 3C charts I posted that showed that these triangles in the market are NOT coincidence, they were purposefully formed. Mu guess at the time was that it had to do with a VWAP/Stable Order Filling scenario. While this may or may not be the case, the one thing I had been thinking about last week, but didn't want to mention as I don't want to be part of the conspiracy minded crowd without objective evidence, but as you can see from yesterday's A.M. Update I was thinking about this last week, was the following...

I thought the Whisper Number that leaked from Wall St. to main street last week, a number that was ridiculously low seeing as consensus for Payrolls was a gain of +247k with the previous month being a gain of +297k and the somehow leaked whisper number of mid 100k (around 150k) which is ridiculously low with the actual print coming in even lower than that at 126k all seemed to me to be too accurate and too far outside the realm of believability to not have been purposefully leaked.

The question then became, "Why would that be leaked?" I first doubted whether or not the actual BLS data and the huge miss was even truthful or creative tinkering. This theory may not be far off as yesterday, THE F_E_D HAS SPOKEN...NOT EXPECTED..., when the Philly F_E_D posted on their website that the data revisions to the BLS employment data was so far our of whack for their state, that they weren't even going to post them anymore until further notice. Additionally the post on the website mentioned there's an investigation in to all 50 states.

 I thought to myself that if we were to see such a weak print (even at 150k), there would be market perceptions that the data would put a June rate hike on hold. This was just exacerbated yesterday when Yellen's favorite overall employment Index, the F_E_D Labor Market Conditions Index, one of the F_E_D's main indicators for employment hit 3 year lows and this on TOP of Friday's NFP!

Something just didn't feel right and now that all of this has actually taken place and worse than the tin-foil hat crowd anticipated, it just stinks of something rotten even more.

A miss would change expectations and also allow the F_E_D to come out with some of what suspected we'd see on an NFP miss and some of what we've already seen this week, extremely dovish talk which started with the F_E_D's favorite Wall Street bank, Goldman Sachs. Monday morning in a note GS put out using the F_E_D's own modeling systems (for increased credibility) it boiled down to the assessment that rate hikes should be put off until 2016. Today we got the upped ante from noted dove Kocherlakota which if it had just stuck to delaying rate hikes until 2016, it would have had some credibility as that's pretty much his position, but the added the "Asset Purchase" talk, which I think we all know by now is VERY unlikely to happen as the F_E_D seems and has seemed dead set on tightening policy for over 2 years now, slowly moving in that direction at nearly every policy meeting.

However, what it does do is changes the strong dollar dynamic and the bottom line is it has been my opinion that all of this was leaked to create fear in $USD longs, carry trades and the like to essentially put the notion of losses on the table and then to back it up with this show we have seen since Monday morning in a well choreographed effort to kill any remaining $USD strength without actually having to resort to policy action.  It's essentially a Mario Draghi stunt of talking down the Euro, but much more creative, even though the actual prints in data are bordeline UNBELIEVABLE in the literal sense of the word.

My thought process is very simple as to how this goes and the chain reactions it causes:

1) BLS data is manipulated (it would be far from the first time) creating a perception that the F_E_D will not only put off a summer rate hike, but may engage in further loosening policy measures such as the talk about additional asset purchases today from Kocherlakota.

2) This weakens the $USD enough that carry traders with a $9,000,000,000,000 (trillion) $USD carry position on are forced to close the carry. To do this, the $USD has to be sold and the Yen bought which causes a stronger downside cascade in the $USD and larger carry trade losses. Remember carry trades are often at huge leverage and 100:1 is nothing unusual, 300:1 leverage is common place so even slight losses can be catastrophic.

3) While it is common place to invest in higher yielding quality bonds with carry trades, the profits flow in to equities as well. I noticed something about TLT late last year after it outperformed the SPX on the year, the long term 3C confirmation had suddenly declined and was no longer offering the support that it did in 2014 when treasuries outperformed equities, that has changed, hinting that the Carry trade position has and is changing.

 While most of the confirmation of TLT's upside had been in 60 minute charts that no longer have enough history to show the whole trend, even this 15 min chart shows the same area the 60 min charts deteriorated at, this is something I've been talking about here and there for the entire year.

The longer trend, but less detailed 4 hour chart shows the accumulation area in late 2013 with a double bottom and leading 3C positive to higher highs in 3C failing and now lower highs have replaced confirmation.

This is one possible and probable sign that the carry trade is unwinding.

4) While I confess I don't know exactly what would be scarier to the F_E_D than hiking interest rates and damaging the economy, it does seem there is something that scares them more than that they've seen coming and have been consistently creating scenarios in which they can tighten monetary policy, but you don't have to take my word for it, QE 3 could be alive and well right now as it was open ended, they CHOSE to tighten monetary policy by ending QE3, that's fact, not hypothesis.

I suspect I can think of several scenarios that would cause this fear, one being highlighted by the BIS in their annual report in which they say Leading Central banks have balance sheets so overstretched that they doubt they have the ability to respond to even a garden variety recession and this is coming from the Central banks central bank. Perhaps the F_E_D sees the same thing we all do, deteriorating economic conditions and sitting at ZIRP policy, they have no room to maneuver as the BIS pointed out.

Tje end result of the F_E_D's unprecedented experiment in monetary policy finally ends with a market collapse, which I've written about in terms of the business cycle to at least open people's minds to the idea that wealth transfer means the F_E_D can't only be a Plunge Protection Team, but must instigate market corrections, just look at the interest rate hikes that popped the housing bubble and created one of the largest wealth transfers away from the middle class and to the ultra-rich. Between the F_E_D's monetary tightening and the carry unwind, the punchline is it doesn't end well for the market and no matter how hard the F_E_D may try to create a soft landing scenario, they have been consistently wrong on everything from QE1 to inflation forecasts and didn't do a great job in 2008's market decline, but what we have now is so far above and beyond the scenario in 2008, it easily rivals the 1929 market.

It simply stands to reason that a $USD/JPY carry unwind sees the Yen appreciate and the Dollar drop. Whether this is one of the factors the F_E_D needs to see before hiking rates as the Euro and Yen have been devalued via QE while the $USD has gained and stopped QE and hit multinational (exporting) corporations hard because of the currency war the ECB and BOJ are waging, is a possibility as they likely would not want to cause a stronger dollar via interest rate hikes and a greater US multinational disadvantage during a time when the economy is certainly "cooling" at best.

I suspect an unwind of the $9 trn $USD carry as laid out above would cause a snowball effect in the $USD to the downside, again, this would not end well for the market. Apparently managers like Soros and Tepper must have similar feelings given their positioning in Q4 2014.

When a carry trade goes south, you have to remember a simple 1 pip loss in the trade amounts to 100-300 pip loss on average because of the leverage, thus this is not a far fetched idea by a long shot.

I have said for several years that I believe the Yen will appreciate as the US equity market enters a true primary bear market.

You've seen this chart before, you don't even have to buy in to the 3C signals, just look at the price trend alone, what does this tell you?
Daily Yen Futures / 3C positive divegrence at the flat trend change in price

And the wildly strong $USD which also had 3C confirmation most of the way up is also giving signals suggesting the carry unwind is already in play, but again even ignoring 3C, just look at the price trend in the $USD with the first significant primary trend pullback.
$USDX daily with a 3C negative divegrence and the first serious pullback on the chart.

Now that you have a rough vision of how I see the endgame unfolding and some very strong evidence that we are well in to that end game...

Onto today...

I think you probably have a pretty good idea of what I expect. Trannies and small caps are both red now since thursday's close and yesterday's "breakout" from the triangles. I have been seeing unusual activity in Small Caps/Russell 2000, from no Dominant P/V relationships, to being the only average with a negative 15 min 3C chart which was the basis or a large part of last Thursday's forecast for this week.

Treasury yields were mixed today, the short end as you might have figured by the Leading Indicators post and the 5 year yield vs the 30 year yield indications, as well as today's strong 3 year Treasury auction sent the short end up by 2 bps and the long end down by -3bps, this was what I was talking about earlier in Leading Indicators today.

 It has been the 30-year yield in line with the SPX the last several days, even upside support, but as you see intraday today, yields fell and the market wasn't far behind. On a longer term basis, yields are severely dislocated from the market, however there are so many moving parts that we'll have to take each event as it comes.

Tomorrow's 10 year treasury auction should be an interesting one. Today's strong 3 year obviously tells us that the bond market believes the employment data will delay a rate hike.

Our custom SPX:RUT ratio not only gave a positiver divergence just before the pop higher yesterday (another link in our analysis from Thursday for this week), but has spent the last 2-days in non-confirmation so it isn't all that surprising the market come down today.

I posted that the VXX underperformed the market correlation in to the close as well as spot VIX, but spot VIX strengthened in to the end of the day and was in line as it should have been with VXX still at slight under-performance in to the close.

Everything else posted in Leading Indicators stands as posted in to the close which is why I think this move is not over, but it may need some outside assistance (F_E_D) as the 3C charts ended the day horribly, much worse looking than the percentage decline on the major averages, which was anticipated in Thursday's forecast for this week's triangle based breakout/bounce.

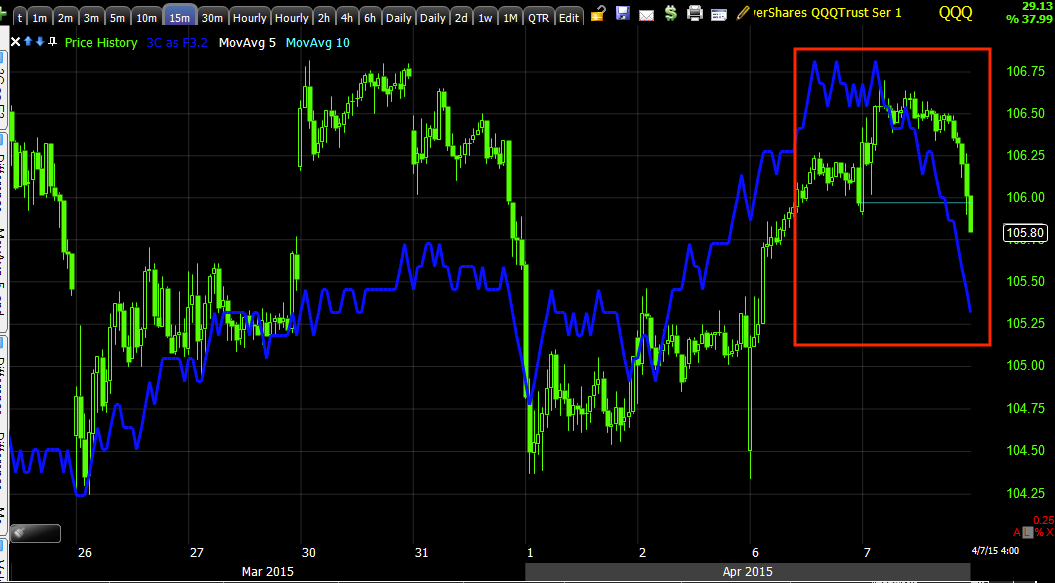
While the SPY 15 min chart is still intact and able to support a move, the 10 min chart, as suspected yesterday when I said I think we'll be posting negative 10 min divergences today the way things are going, has fallen apart, it's a small leap from the 10 min to the 15 min at this pace.

 SPY 10 min ugliness in to the close.

XLF/Financials 10 min in to the close.

HYG is still leading, thus I suspect the move is not done, but saw some ugly 3C action as well today.

 QQQ 15 min is now starting to lead negative, this is an issue.

And IWM 15 min which never went positive with the rest last week is in even worse shape.

This is the DIA 15 min chart, check it vs the charts posted earlier today, lots of damage and it has been noon-stop since the market broke above the triangles or thereabouts using AAPL as a clean proxy.

Oil which I posted an update for today, USO Update as recently it has been in line, showed a change in those divergences and I thought it would be coming down soon.

Tonight's API Oil inventories after market came in at the largest build  in 30 years at 12.2 mn barrels vs. consensus of 3.4 mn barrels, which did this to crude as the charts were suggesting earlier today...
 Crude futures intraday and negative in to the API divergence.

30 min crude futures with a positive divegrence, the confirmation I mentioned at the green arrow and today's negative divergence.

Index futures are just about in line, but only after posting an intraday negative divegrence that was posted here earlier today, Quick Market Update which warned of the divegrence that took over afternoon trade.
ES / SPX futures 1 min chart and the divegrence I had to get out quickly this afternoon. right now we are about in line.

Finally, internals...

The Dominant Price/Volume Relationship wasn't great and as usual didn't include the Russell 200, but it had 12 Dow stocks, 52 NDX 1000 and 231 SPX 500, they were all Close Down/Volume Down. Other than being the thematic relationship during a bear market, this is the relationship with the least next day influence, I have nick-named it, "Carry on" as in keep doing what you were doing as it doesn't have a strong oversold or overbought bias, allowing the market to carry on in the trend it is usually in, however that trend is just about flat right now so it's not of much use.

As for the 9 S&P sectors, these were closer to a 1-day oversold condition with 7 of 9 closing red. The leader was Health Care at a mere +0.24% while the laggard was Utilities at -1.15%.

Of the 238 Morningstar groups, only 69 of 238 closed green.

Again, both of these sector/group readings imply a short term 1-day oversold condition, although slight which is in line with the forecast for the week or at least the start of the week moving forward until the 15 min charts are all used up. We still need to see the Index future charts deteriorate too so I don't think we are there, I do think we will have VERY clear signals and Leading Indications and I don't think we'll miss the trade.


I still feel introducing long risk generally in this area probably is much more risk than any reward and I'd prefer to let the trade come to us.

That will do it for now.

As always, I'll take a look at futures before turning in and let you know if anything is standing out, but I haven't changed Thursday's forecast for the triangle breakout move, we have just seen the anticipated distribution in to the move occur much faster and stronger than anticipated.

Have a great night 

Leading Indicators

After a quick peak at Leading Indicators, the assessment of the last market update seems plausible if not highly probable, a pullback (see AAPL) to technical support levels or viewed as a consolidation with the probability of continuing the bounce.

The $USD analysis will be separate, but the longer term charts are pretty definitive as the strong confirmation of the $USD's uptrend has turned negative. I'll check on near term indications.

Interestingly out SPX:RUT Ratio once again led the market lower, also Yields led the market lower intraday after a strong UST 3 year auction today. However, interestingly with an important 10 year auction coming up tomorrow, it wasn't the shorter 5 year yields that had the most effect, but rather the 10 year and 30 year as they led the market lower by a good hour or more before the 3 p.m. sell-off.

There's still HYG / High Yield Credit support in the area, this fits with the pullback, bounce that was demonstrated best in the last Market Update post with the AAPL charts at the bottom.

Spot VIX and VXX are underperforming on the 3 p.m. sell-off, which also fits with near term expectations of today being a consolidation-type day and we should see some additional upside and break the positive divergences on the 15 min charts which represent this aspect of a breakout/bounce from the triangles I have been showing and that made up a large part of Thursday's analysis of what to expect this week with a directional breakout to the upside, like a Bollinger Band pinch (that was the exact analogy used).

So the bottom line is both intraday negative indications led the market and continue to move toward the last update's assumptions of additional upside as a 1-day breakout bounce from those triangles simply doesn't make sense from any point of view.

However there are still some strange implications with the IWM 10-15 min charts which have not been in line with the broad market which includes not only stocks, market averages, but Index futures as well.

The 7-15 min Index futures that were also part of last week's forward looking forecast for this week are largely in line right now, rather than positive as they were before yesterday's breakout in most triangles in various market averages and assets (again AAPL is a fine example).

I would expect to see these to also deteriorate in a very clear way before anything of significance happens.

Otherwise, it's just more volatility, choppiness and risky long trades while waiting for the right time to enter high probability/low risk short trades and a few select longs as well.

In other words, thus far it has been a continuation of the choppy market that has made short term traders' lives such a pain in the butt recently, but with earnings coming up, the second most over-valued market in history and a lot of good reasons to suspect things will turn south, like the NFP print Friday, I suspect we are very near something much more tradable, right now keeping your chips is the most important aspect and to do that, patience is key.

As to F_E_D induced volatility on these crazy dovish statements we expected since last week when the NFP whisper number appeared to be leaked, I suspect that will have a lot more to do with near term $USD analysis which I will look at.

I'll have more to say on the probable NFP leak as it relates to strategy from the F_E_D.


Market Update

It's very difficult to get a market update out to you that is both timely and complete. For me a market update includes futures, the averages, what the trend among a watchlist of stocks is, Leading Indicators, any of the levers like Currency crosses/ carry trades, VIX levers, bonds, etc. I obviously can't get that all in at once, but I'm doing my best to keep track of all of it.

The AAPL triangle breakout was the gist of forward looking expectations for the week with a twist of F_E_D interference via trying to talk the $USD down through some unusually stronger than usual dovish language, for instance "QE4" or "delayed rate hikes", both of which Kocherlakota mentioned today. I must also say that all of this happening was prefaced with the prerequisite that the Friday Jobs report miss and miss pretty big.

There are admittedly a lot of moving parts here and I prefer K.I.S.S. (Keep it simple stupid!), but the market is what it is. I'll leave that for another time, but if you are wondering what I'm referring to, Dovish F_E_D statements to knock down the strong $USD, as the $USD comes down, $9 trillion in $USD carry trades go south forcing an unwind which is in all reality almost certainly underway. That means assets bought with carry proceeds are sold, I think you follow.

I can't do this update the justice of 6 timeframes for each of the 4 major averages as well as 4 or 5 for each of the 3-4 Index futures so I'll try to pick charts that represent the particular timeframe the best.

I think the most important thing you know about today's intraday action is that the short squeeze that lifted us yesterday early on which was followed by negative divergences has not only NOT seen follow through today, it has seen a continuation of the trend of negative divergences which is something I expected as I wrote yesterday (paraphrasing);

"If the negative divergences from yesterday were intraday only, they would have had a steering effect and sent the market lower intraday. Rather these are more of a trend of distribution which is what was expected in Thursday's forecast, although I didn't expect it to hapen so quickly".

Also as of yet, two F_E_D speakers who have been back to back and increasingly more dovish from yesterday to today are not having the intended effect on the $USD so far nor the (what I would consider a side-effect) on the broader market either. Rather it seems we are just caught in more lateral chop which has really defined the year if you look at some longer term charts, the change in trend from up to lateral becomes obvious as does the 2015 chop. Again, I'll leave that for later, for now the intraday update.

It looks like deterioration is real, it also looks like this may be a short break/consolidation if I include AAPL, the increasing probability of stronger dovish F_E_D language if the $USD doesn't start to weakness could be what pushed the market back off today's mediocre performance, but if you follow the events I laid out (in brief) above, then I think the AAPL example will make sense.

The NYSE TICK Index is quite mellow,
Yesterday's early morning saw TICK / Short Squeeze extremes (on one of the strongest open/close or candlestick body days in about 5 months since the December Yellen lows). Since it deteriorated in to the afternoon yesterday and is lateral in a mellow area of about -600 to +750 which wouldn't be a surprising reading to see if the market closed with something like a Star candle on the daily chart, maybe even a Doji. In other words, there just isn't much if anything in the way of positive intraday breadth.

As for the divergences in the averages...

Remember as of the Forecast (near term) from last Thursday, IMPORTANT: AAPL Set-up & Market Movement, it was the 15 min charts that were the so called, "Gas in the tank" and negative divergences would have to migrate until they started turning those charts negative. The exception has been the IWM which has had much weaker looking 10-15 min charts, while having slightly better intraday performance until today (of the last 2 days- Mon/Tues).


 QQQ intraday is a good example of "You need higher prices to sell in to" or you could replace "higher prices" with "demand".

Today's negative divegrence is clear and worse, but not as intense as yesterday's nor is the upside move.
 DIA 1 min is showing a worsening chart, this is what was expected moving forward until we break the 15 min "gas in the tank" charts, but today's move here looks especially sharp considering. It's still within reason with the concept above about needing demand/higher prices to sell in to.

The IWM which has not had the stronger intermediate 10-15 min charts of last week, has had better local 1-5 min relative performance (I suspect on a short squeeze yesterday), that fell off sharply today and at a very specific time.


 Carrying on with the "Migration concept since this is the first day of stronger IWM downside in 3C, we see it has migrated to the next longest chart as well and forms a cleaner trend. At this point 3C is leading negative below last week's levels.

SPY 5 min is leading negative, a lot from yesterday with very little additional upside today.

This is an example of the IWM 10 min that is out of character with the rest of the market which had strength in the 1-0-15 min charts, although only for a short period of time. It has also had strange character divergences vs the rest of the averages in other indications like the Dominant P/V relationship.

And IWM 15 min is pretty far from a supportive leading positive chart, unlike the other averages.

SPY 10 min, as suspected yesterday when I said, "I think tomorrow we will be seeing 10 min negative divergences at the rate things are moving today" is now showing that initial break in the gas tank at the 10 min chart, next stop is the 15 min chart and then we are close to taking action.

The SPY 15 min chart which I showed Thursday as I made the near term case/forecast, is still largely undamaged as we are just hitting the 10 min chart today, but in 2 days that's a lot of negative migration.

The DIA 15 min chart does show damage already starting. Past divergences have shown to be effective as you can see at the F_O_M_C knee jerk and highs just after, then all F_O_M_C knee jerk gains were retraced and then some.

The current point though is damage already at the 15 min chart.

QQQ 15 min (in yellow I'm just pointing out a short term (fractal) head fake move and how they happen just before a reversal, a concept that can be used on any time frames in any asset in either direction.

So far the 15 min chart is holding here, but showing initial signs of some damage migrating out to the longer chart and we have only had less than 2 days so far.

As for VIX futures (and related ETFs), strangely Thursday, the day in which you'd think a 3-day weekend alone would crate demand for protection, not even to mention Greek Default fears and most importantly the Payrolls data on a day in which the market is closed (which should tell you something about the market and leaks), is now confirming (as it was yesterday), the market averages as it moves opposite the averages in price, but the divegrence is...
 Leading in actual Index futures for the second day in a row, even more so today.

VXX/Short term VIX futures are also leading positive on the 3 min chart for the 2nd day in a row.

The 2x long VXX, UVXY is shown for confirmation as its 5 min chart is also positive over the last 2 days as it failed to see any bid Thursday strangely.

And the 10 min XIV which is the inverse of VXX and moves with the market rather than opposite it, is confirming on a 10 min chart with a negative divegrence, essentially the same signal as any of the market averages showing a negative divegrence in the same timeframe.


 Since starting to capture the charts and put together the post, the TICK Index has broken to a more extreme low reading of  more than -1000.

 Looking at AAPL, one thing I consider to be a high probability is a pullback toward the apex of the triangle, this is old school technical analysis, probably what most TA traders would expect, a test of former resistance which should act as support.

AAPL is giving some signals that would tend to confirm, thus we "should" be able to get additional upside a originally anticipated and see those 15 min charts crack, opening up the "Come to us on our terms" trade we have been looking for during this choppy/triangle forming area.

 In support of the AAPL pullback/support theory above, a weak, but effective steering divegrence of 1 min intraday that is positive in to its pullback today.

However that doesn't change the broader damage that has been done that has now migrated out to a 15 min chart above. We need continued demand to see those 15 min charts crack, whether it comes from a more Dovish F_E_D statement if the dollar doesn't break or just the market, it should come as forecasted last week.


 This is AAPL's 15 min positive divergence which shows it forming in to AAPL's apex of its triangle (yellow arrow represents the triangle), this is where we'd expect it and was a big part of the AAPL market proxy example for this week.


However as pointed out Thursday, any upside move or directional increase in volatility that the triangle alone represents as it hits its apex has the highest probability of failure as the 4 hour chart has been leading negative through this area, which I explained made sense from what we know of Q4 2014 sales of AAPL among some of the best known/highest paid hedge fund managers that are outside the hedge fund herd.

This is still the bottom line and is very much in line with the patient waiting we have been engaged in to find the right spot to enter additional or new positions at the best entry and lowest risk, something the market chop/triangle range has prevented and 3C charts have told us to stay out of the way during that period.

I'd still say, Patience is the best course. We are on track, perhaps a bit more zealous in distribution than originally expected, but seeing the F_E_D dovish Qe4/no rate hikes until 2016 comments have thus far failed to do what we expected in moving the market higher, it seems another tact is being taken, which doesn't rule out the wildly dovish comments I still expect. You really have to keep your eye on the catalyst/ball which is the $USD, it's the key to just about everything at this point.


Quick Market Update

Intraday charts were expected to continue to post larger negative divegrence, but in to higher prices , more so than today.

The intraday charts are turning south, the IWM is obviously leading (it has had a different relationship and absolute lack of a Dominant P/V relationship, suggesting it has some different dynamics) , but the others should be in tow intraday.

I am right in the middle of a larger market update, but wanted to get this out ASAP. As far as larger implications as we head in to earnings season and the F_E_D will have to up the Dovish talk to get anything done apparently, unless even a change of character there is underway which would be one of the most significant F_E_D Perception developments since 2009. I don't think chasing or acting out of emotion is a wise strategy, but in case some of you shorter term traders need the info, there it is.

The market update should be out in the next 10 mins or so.


USO Update

I haven't had many USO updates recently because it has been largely trading in line, this is fine for the 1/2 size long position in USO which originally was meant to be the partial entry of either what was first suspected to be a counter-trend rally, but was starting to see a base a bit too large for that so it would act as either a long for a counter trend rally or the start of a larger Intermediate to Primary USO/oil trend change to the upside.

You may recall the initial divergences (positive) in USO back around January and at that time with what we knew, the probability was that we'd see a counter trend rally off the approximate -57% decline from the June 2014 highs. The timing and place of the initial divergence was well within what you'd expect for a sharp counter trend rally which are some of the strongest rallies I've seen in any market and as such, worth trading. However as the base grew larger, it was well beyond what would be needed to support a counter trend rally and started looking more like a primary trend base that could support a real reversal, rather than a counter trend corrective rally that would ultimately come back down and fail.

Just to give an overview of the charts and the symmetry that is often found in the market, I'm posting these as recent USO behavior is falling out of line (as mentioned in this morning's A.M. Update with a Crude Futures 5 min chart) and suggesting a swing+ move that may be tradable, although I prefer trading USO from the long side at the right entry. It may be worth while taking some small gains in that half size position (long USO), but I don't think we are quite there yet. I do want to give you as much early notice as I find to be probable and reliable.


 This USO 2 hour (long term/strong signal) chart is one of my favorite as it shows USO going through chop with appropriate signals for that kind of price action on this timeframe, then something changes and we get one of the deeper negative divergences on a strong timeframe (meaning a strong signal) as a H&S price pattern is traced out, by which time the 3C chart is in a definitive leading negative divgerence way stronger than anything previously seen.

The USO downtrend sees 3C confirmation until the first positive divegrence at the Jan. lows, this is where I suspected a counter trend rally, but as it grew larger, it was simply overkill to have a base that large with signals that strong for a counter trend corrective move, as strong as they may be.

I have drawn in a trend line, which can be drawn several different ways, but it's fine for our purposes and a proposed path in the near future for USO to finish up a proportional base when compared to the top and the downtrend just after the top.

 Here is a 30 min chart/positive divergence, just without any 3C divergence signals drawn on it (they should be obvious). As I said recently, USO longer term is still in a fantastic spot , low in the base, but I suspect we can get even better positioning and my drawing which is not a proposed exact forecast of where prices will go, but more of a probable directional move is also proportional to the rest of the chart which is something you tend to find the more charts you look at.

 The 15 min chart has had several smaller divergences since the most recent pivot lows to now. This is not a "SCREAMING" reversal signal, but it is the first time in a few weeks that I see enough of a divegrence rather than trading in line, to post a USO update and have an idea of what we might expect.

While I'm not a huge fan of shorting a pullback in what looks to be a large stage 1 base, that's my preference, I want you to have the best information I can give you so you can apply it to your own trading style and risk tolerance levels.


 The 5 min chart has more details as you'd expect and shows several smaller swing moves as well as a negative divergence in the area and a larger relative negative from the highest point of 3C to the left to the current reading to the far right, I just didn't want to draw a large arrow across most of the chart.

 Intraday charts are getting more active and migrating. This 1 min intraday chart also shows a larger relative negative divergence at the red arrow as well as intraday action today.

And migration of that divergence is showing up on the 2 min chart in the form of a broader trend with less detail, but since we already have some intermediate 5-15 min charts falling out of line finally, I would take these signals seriously.

I wouldn't consider this the ideal area for a short entry if you were looking for a pullback trade, but the point is to give early warning so you know what we are looking for when it is posted as a trade idea or at least an update as I said, I prefer trade this from the long side at lower levels and on a longer term trend basis.

Interestingly one of the strongest signals for me is the actual change in character as I have been watching the charts for a week or two and just haven't seen much except in line trade (3C confirmation), the change in character in which that in line trade has started to fall apart is what I believe will end up being the warning flag that leads to the signals sooner than later for a swing+ move or pullback to the lows of the base, which will probably have us pretty darn close to a base that can support a true trend reversal.

Remember we have the API inventory data out after the close today and the EIA inventories tomorrow at 10:30. You may want to set some price alerts.

And There It Is, Less than 2-Market Days!

First it was the Whisper number of the Friday Non-Farm Payrolls coming in below consensus of 245k around the mid 100k level (150k), which was optimistic as they missed even that low threshold. The fact the whisper number hit main street is also interesting.

However, as you may recall last week in our forecast,  IMPORTANT: AAPL Set-up & Market Movement, not only did we suspect the whisper number was correct with a massive payrolls miss on Friday as the market was closed (except for Futures which traded for 45 minutes after the NFP was released), but we suspected some "Talking F_E_D" would come out with some ULTRA_DOVISH comment, some suggesting a mention of QE4 to get those headline scanning algos (the same one's who sent TSLA up nearly +1% on the April Foll's joke of their release of the Model "W" for WATCH!).

Here's an excerpt from Thursday's f\market forecast using AAPL as a proxy for the broad market (linked above)...

"The NFP tomorrow could be the catalyst for such a move (the breakout of the triangle I was pointing out), especially if it comes in on the light side and even more so, if the conspiracy minded crowd is right that the F_E_D could use that as an excuse to kill $US Dollar Strength by mentioning something DOVISH like, "We probably won't hike rates this year" or something mentioned about QE4. 

THIS DOES NOT MEAN THIS IS WHAT THEY ARE REALLY THINKING, IT'S AN EASY WAY TO TALK THE DOLLAR DOWN WITHOUT HAVING TO CHANGE THE COURSE OF THEIR TIGHTENING PLANS"


There was a lot more on the subject, I thought that excerpt just summed things up nicely and so far has been on track as was pointed out yesterday morning in AAPL Proxy & Conditions primed for F_E_D

Although I suspected it would be Bullard who came out with the wildly dovish comment that the market would chase and the dollar would run from, it was Minneapolis F_E_D President Kocherlakota just a short time ago.

The exact comments were right on track with the QE4 theme. Again remember what I said in the second paragraph of the IMPORTANT: AAPL Set-up & Market Movement excerpt above (in CAPS) and remember yesterday's comments that if the $U"SD didn't start showing some weakness soon, we'd be hearing from the F_E_D on one of these cockamamie quotes from someone connected to the F_E_D (we haven't seen the $USD weaken overall as it just pushed back to pre-NFP levels as mentioned in this morning's A.M. Update)...

Kocherlakota in a pre-announced speech in Bismarck, North Dakota this morning said a couple of things we might have expected....

Like there's a "Theoretical argument" to be made for making asset purchases if the economy faltered, in other words, QE-4. It seems the F_E_D is the only one who has been hiding their head in the sand as the economy and macro surprise index slips lower and lower all of 2015, to the point they couldn't retain credibility without mentioning it in the last F_O_M_C policy statement, in which they toned down their assessment of the economy, way behind what the actual economy has been showing. This has seemingly been on purpose as I suspect they are on the path to tightening and a rate hike and for a reason that may be scarier than we know, a soft economy and employment doesn't help their cause and a strong dollar helps less.

Kocherlakote also said the "Debate ABOUT raising rates is a drag on the economy".

This is an important choice of words, it isn't the possibility or probability of a rate hike that is a drag on the economy if we take his words as well chosen, but rather the debate which comes right back to the thing the market hates the most, UNCERTAINTY.

Kocherlakota is probably right if what he said is what he meant and the economy and market would probably be less upset with an actual rate hike and that certainty put to rest than the actual debate. It's the same concept as , "When the missiles fly, it's time to buy".

Forget about the bias of the market of buying or not, it's the uncertainty. It's not that the market likes war per se, although some sectors/stocks obviously benefit, it's the uncertainty of what will happen in the pre-war saber-rattling that the market doesn't like or put simply, it's uncertainty that the market doesn't like. So if Kocherlakota did in fact chose his words carefully, the Dove may be actually saying, GET on with it one way or the other.

The difficulty right now is that in the initial news I'm finding more economist parsing of what they think he said than what he actually said, which I'll spend some time on later, but even if he did say 

“Under my current outlook, I continue to believe that it would be a mistake to raise the target range for the fed funds rate in 2015.”

As I said, I'm finding more parsing of words and economists arguing their points than actual full context quotes, the effect is the same, the intent and timing are the same.

The problem... I haven't been very fond of the way the market has been trading this morning. As you know from last week's forecast and last night's Daily Wrap a well as yesterday's updates, I see us as early in making the move out of various triangles throughout the market, yet they have shown a great deal of distribution immediately after making higher prices to sell in to.

This morning has been a strange morning and the Kocherlakota words, apparently aren't having the same effect as the Jim Bullard flip-flops unless the market is simply getting tired of the F_E_D trying to talk the dollar down just like it got tired of Draghi doing the same until the half life of his "talk" was about ZERO.

The USD since Kocherlakota...
 $USDX made a new high for the new week as mentioned in the A.M. update, retracing the initial losses from the post NFP print and moving back to pre-NFP levels,  in other words, thus far Kocherlakota is not as effective as Jim Bullard has been in the past and surprisingly the headline scanning algos didn't pick up on the comments or react, perhaps he didn't use the actual words they are programmed to scan for, but I would think "Asset Purchase" would be in their dictionary.

And the a.m. trade for ES, which has been sloppy, choppy and in line thus far, but we have those stream of migrating negative divergences from yesterday such as...


SPY 5 min, any other time if we didn't have some 15 min positives, I'd be close to calling this an important inflection point and likely reversal.

The intraday breadth as represented by the NYSE TICK data is not helpful here either.

Beyond yesterday morning's short squeeze on triangle breakouts, the trend in breadth has been a slow, painful leak lower.

While VIX futures that no one was interested in over a long 3-day weekend with the Employment data out on a market holiday and the possibility of a Greek default looming, is now changing its tune and is positive for the second day in a row in to lower prices, now protection is being bid as pointed out yesterday suggesting some rotation out of risk assets and in to protection as prices give bigger institutional money the opportunity to do so.
Intraday 1 min VIX FUTURES with positive divergences for the second day in a row confirming the negatives in the broad market averages.

I did expect this to happen, but I didn't expect a 1 or 2 day event. Any head fake move is meant to be convincing, while I'm using AAPL as a proxy for the general theme found last week pretty much market wide, it's not specific to AAPL, it's more of a proxy for the broad market and this is not what I had in mind...
That's really not much of a convincing move other than a short squeeze, but perhaps as shown in the broader updated charts of AAPL in the IMPORTANT: AAPL Set-up & Market Movement post from Thursday, there may simply be too much damage to maintain any kind of support for long.

I don't want to jump to conclusions and I do want to give the market some time to digest Kocherlakota, but this is not the reaction one would expect from a similar event if it had occurred just several months ago.

I'll be digging through some charts to try to find some answers, so far it looks like they need Bullard.

While I don't want to pretend I know what Kocherlakota is up to or how genuine his comments were vs how much they were meant for a specific task , we need to remember to keep our eye on the ball. The Strong $USD is the F_E_D's enemy right now and if we take that to its logical conclusion, if they manage to knock it down, guess what follows? The Carry trade,$ 9 Trillion is $USD carry since about 2008 that gets unwound, and you know what that does to the market.

More as I have it...

Amazing that this whole scenario since before the NFP was easily forecast in its likelihood and is now playing out exactly on cue. I don't think any of this is coincidence ,, from the triangles to the NFP leak to the F_E_D comments slowly coming out with greater and greater force (Dudley yesterday, Kocherlakota amps it up a bit more today).