Thursday, August 30, 2012

UNG Update

UNG is one of the very few long positions I like, but I like this on a long term basis, I added some as a core long position and I rarely look at it; I just kind of put it away and will wait for it to do its thing.

Here's the update, everything looks to be going fine, UNG's next step is a volume spike and stage 2 mark up; that's where UNG will trend and make for a really nice position.

 5 day UNG chart, the change in character that got us interested is quite obvious,

 UNG with an ascending triangle (bullish) base with a breakout, but stage 2 wasn't achieved.

 UNG  with a distribution day, the candlestick makes it clear along with the high volume, we had to expect a pullback from a day like that.

 The X-over screen to prevent false crossovers gave a long signal, also the first pullback is almost always to the yellow 10 bar moving average, the second to the blue 22 bar moving average.

On the pullback, obvious support was in place, note the break of obvious support which created some supply, this can be easily accumulated, but was it?

 This 2 min chart suggests it was

 The move in the 1 min chart is confirmed by 3C.


 The hourly chart building the base, also shows a positive divergence at the break below support shown above.

 The 30 min chart shows the same.

 As does the 15 min chart, that's pretty good confirmation and what we'd expect to see on such a move once we understand why such moves exist and once we understand the long term bias of the stock.

Finally the 3 min chart confirms.

Now we look for a break back above the base's resistance and wait for stage 2, that's where the easy money is made in a trending stock.

TECS (Technology Bear 3x)

This is the replacement ETF for TYP, the charts here confirm just about everything else we have seen and also hints at timing. For a equity long position I think TECS is in a fine place to go long the ETF, for a Call Position (I haven't checked what kind of open interest TECS have, but I would make sure there's some liquidity), I'd probably wait a day or so for the best entry.

 TECS daily.

 This is a bullish Ascending Triangle, it's about 2/3rds complete, any breakout of a price pattern lie this around 2/3rds completion is a very strong breakout, rather than waiting until the triangle reaches a full apex. This is an inverse ETF so the price pattern here is highly unlikely to be anything but naturally occurring as it is simply the opposite of what is happening in XLK so head fake moves, etc are highly unlikely unless they were to occur in the underlying issue, XLK. There is a gap just below today's action, from what we have seen in Tech and Tech stocks today, it seems likely that the gap will be at least partially filled, this is where I'd be looking at a possible Call position as timing is more crucial when you are dealing with 10x leverage rather than 3x and you have a built in time decay issue.


The underlying issue, XLK forming (whether intentional or simply organic), a bearish descending triangle right at it's had fake area represented by the long red trendline which is former April highs. As I showed in several issues today, the actual break below or confirmation of a head fake move is very close, it's not as far away as one would think, therefore the downside momentum created by a head fake move, at least in Technology's case, is right below today's close.

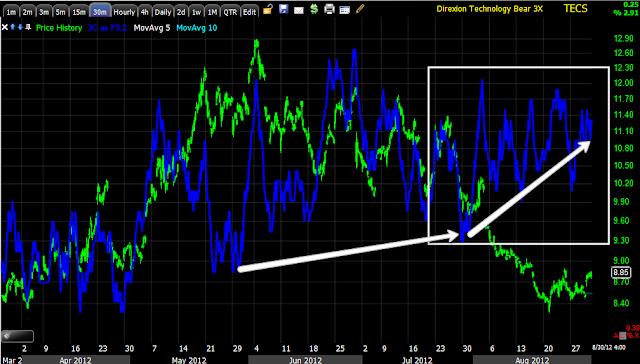
 TECS 60 min chart, the first run from the April lows was on a fairly strong positive divergence, the current divergence is MUCH stronger.

 30 min positive divergence in TECS.

 15 min positive or rather leading positive like the others.


 5 min leading positive.

 3 min leading positive, that is a LOT of confirmation. We sometimes have a rare false signal in 1 timeframe, but when we have so many timeframes all looking so similar, it is excellent confirmation.

 The 2 min chart shows accumulation and a short term divergence in to today's strength, which confirms the positive divergences in Tech seen today, this also makes the pullback to the gap more likely.

Here's the pullback area, for Calls, anything in or below this area with positive divergences.

The Aussie as a leading indicator

I touched on this in the last post, but it deserves a closer look. The $AUD is by far my favorite leading indicator among the currencies as it is a carry trade currency which is clearly off which is not good for the overall market and the currency is a barometer of Chinese/Japanese economic activity.

From the last post...

 Short term the SPX has fallen to the mean represented by a falling $AUD, this is ONLY short term and gives the market breathing room to make a short term move up, again when I say short term, I mean short term, it could be opening activity or perhaps on the Jackson Hole Speech "knee-jerk" reaction at 10 a.m. tomorrow morning. This leaves plenty of time for short term last minute re-arrangement of positions by both smart money and us.

Longer term the $AUD is clearly in the "Carry Trade" off mode, when carry trades are closed out, this is a sign that institutional money is de-leveraging risk, otherwise known as selling (which should always be considered as shorting as well as both a sale and a short sale come across the tape as sales-there's no way to look at the tape and know whether a sale was a straight sale or a short sale as in both cases the underlying stock is sold, there's no note with the sale that says, "This sale has to be covered at some point", that's only available in the short interest data which lags way too far behind to be of any use in figuring out what is on the tape.).

To give you a few examples of the power of $AUD signals, I give you these charts.
 The divergence here alone doesn't look that spectacular, but this is the 2009 bottom, to give you some idea of the size of the divergence, when the $AUD first started being accumulated for a carry trade or risk on move by institutional money, the SPX lost another 20% as the $AUD gained 4% which is a fairly large move for a currency, again, this was the 2009 bottom.

 Here the $AUD was in line with the SPX while the F_E_D had "accommodative policy" in place, when that policy/QE was ending with no mention of a new program, the market saw a de-leveraging phase, the $AUD warned first as the SPX made a new high. After the slight consolidation/decline, the $AUD bottomed and started making higher highs and lows while the SPX was still moving sideways/down, this led to the rally from 2010 to 2011.

When we started shorting the market with core positions in March, the $AUD signaled trouble as the SPX made a new higher high, from there the SPX lost 10%, most stocks on average lost about double that, at least most of the core shorts.

What these all have in common, like now, the $AUD signaled the reversal first.

Here's the last reversal (represented by the chart above) and the 3C 4 hour distribution, compare to the current distribution in the $AUD.

It doesn't look like the carry trade is coming back soon.

STRATEGIC AND TACTICAL

I'M GETTING THE FEELING THT OUR STRATEGIC VIEW AND THE TACTICAL EXECUTION OF THE STRATEGIC VIEW HAPPENS TO BE NEARLY PERFECTLY ALIGNED.

As I ALWAYS warn, F_E_D events almost always cause a knee jerk effect, but it may be this knee jerk effect we are seeing on the charts if indeed Bernie's Jackson Hole Speech tomorrow is either leaked, or obvious enough as to the outcome that Wall Street is setting up plans in to the event, which coincides with the weekly option expiration.

Looking at the Risk Asset Layout seems to confirm this, there are only a few questions left open as to the set up, most center on credit, but credit is also VERY near breakout highs which means probable head fake highs.

Here are some of the charts that relay this view in addition to the last two previous posts, if so, then our weekly call positioning, our longer term core positioning and patience in opening September/October Puts may be about to pay off all in the next day or so.

Unfortunately the charts didn't load in the order I wanted, we'll have to make due.

 Energy, remove the noise with a 4 hour chart and the last turn down was a fairly small divergence, although it seemed large at the time, it is dwarfed by the size of the current leading negative,

 The same is true of the USO 4 hour chart, the first divergence sending USO lower is dwarfed by the current one, this makes me confident in USO core shorts as well as September puts.

 In fact, I may consider adding to USO puts in to October expiration if we get a move above the white trend line area or above recent resistance,

 Financials are actually leading the market right now, a Financial position in both short term weekly calls and perhaps tomorrow longer term puts may make a lot of sense, the 1 min chart was positive, but is already seeing a negative divergence as Financials have gained a bit today.

 Financials leading negative on the hourly is intense, stronger than the last major reversal.

 Tech is still showing an intraday positive, as I said AAPL/BIDU look ready to pounce.

 However as early as 5 mins, the leading negative in tech is overwhelming, possibly strong selling in momentum names like AAPL on any bit of strength.

 Yields have been an excellent leading indicator, they remain negatively divergent.

 If the SPX moves like this tomorrow and yields like this, we'll have an even bigger dislocation which have called the previous 3 major reversals.

 The $AUD seems to be in line today...

 The $AUD longer term is very dislocated, it also has called the last 3 major reversals with signals like this.

 When we had Euro strength in white, I showed you the 3C charts and that it wouldn't last, the next day (yesterday ) it fell apart and today the SPX reacted, they are short term converged, I don't expect this will last long, but I do think it will lead to lower Euro/SPX prices.

 HY Credit isn't in sync with the market intraday, it's not doing much. I have questions about junk and corporate credit, I'll look closer in to those.

 Energy was weak yesterday, today it's in line as the SPX fell.

 I'm expecting a short term pop in energy, thus the reason for looking for USO to break resistance to add shorts/Puts tomorrow.

 Momentum in Financials was weak yesterday, the SPX paid for it today, but now it is leading, this is why short term I'd be looking at FAS or an ultra long Financials, but ONLY VERY short term-remember Reg. T for day trading. After that, I'm looking to short Financial price strength, perhaps tomorrow, perhaps even early tomorrow.


 Tech is in line with the market the last 2 days.

I'll follow up with additional clues/insights. However I get the feeling we are very much on the right track.

FAS/FAZ

If I had time )I don't), I'd be considering a very short term long in FAS, maybe a day. I'd also be preparing for a longer term Financial short with FAZ.


Another Example

Here's an example with the NASDAQ Futures...
 Short term the NASDAQ Futures 1 min positive divergence looks ready to pounce.

On the 60 min , note the velocity of each arrow getting steeper and steeper.

The ES 60 min chart looks the same as well.

Pop Into Weekly Expiration/Bernie-Jackson Hole

Looking around, it seems the chances of a pop in to tomorrow's expiration is very likely with the intraday charts improving, supply available today, but at the same time the longer charts that show bigger institutional transactions are falling apart at a picked up pace. Is tomorrow perhaps the last hurrah?

Take a look at BIDU/AAPL to see what I'm talking about...

AAPL gave a lot of supply breaking support levels today, the price pattern here alone looks like it's getting ready for a move up

 The positive 5 min chart also hints at the same.

 However the velocity at which the 30 min chart and others are falling apart are pretty amazing.

 BIDU intraday

 The 3 min chart looks like BIDU is ready to pounce higher.

The velocity of the 30 min chart falling apart here though is worse than AAPL even, look at that leading negative today alone.

If someone is familiar with the weeklies, I'd sure like to know if the open interest is larger than normal