Wednesday, March 23, 2011

Finally a Q's Update

Thanks Jay!

Interesting chart today...


1 min chart saw almost perfect confirmation until 2:45, the negative divergence went into a more important leading negative divergence

 More importantly the 5 min chart did not confirm any of today's action, this is considered a leading negative divergence

 The 10 min chart is now negatively divergent as it could not produce a new high with price

 Here's where it's a bit strength, the 15 min chart looks fine which I'm suspicious of...

Being the 30 min chart is negatively divergent on a relative basis

And the 60 min chart is showing this entire week to have done nothing.

Clearly the outlook on the daily chart is negative. However the Q's remain in a well defined bear flag. When this flag was identified this week, my assumption was that we would see the same behavior we almost always see when a very popular price formation like this pops up, a big, scary false breakout to the upside proceeded by a downside reversal.

The SPY ended the day HORRIBLY on the 1 min 3C chart.

On the 1 min chart, I can only go back 2.5 days of historical information, but I know for sure this is the lowest 3C reading on the 1 min chart for that period and I'm willing to bet that it goes back further. THIS IS NOT A LITTLE E.O.D. PROFIT TAKING! This is a serious divergence. Because it was so late in the afternoon, it doesn't show up on the 5 min chart as much, but there is a slight negative divergence there. This is strictly a matter of timing as 3C has a look back period so enough time needs to pass to effect the longer charts.

The DIA had a similar close
The divergence in the DIA happened around the same time. The light blue indicator at the bottom is a custom indicator like 3C, I rarely use it because it is not very sensitive, but when it does show a negative divergence like it is now, then it's pretty serious.

The IWM which had looked the worst today, also got nailed at the end of day.
This is the lowest reading in 2.5 days as well and the most prominent divergence, a leading negative, which tends to lead price down with it.

This does not look like the EOD setup positions market makers and specialist take for the next day's open, this looks like something very serious was being discounted and sold. I can only assume this had something to do with Portugal, but it doesn't make a lot of sense being we already had seen the negative divergence in the Euro yesterday as the vote was anticipated to be a no.

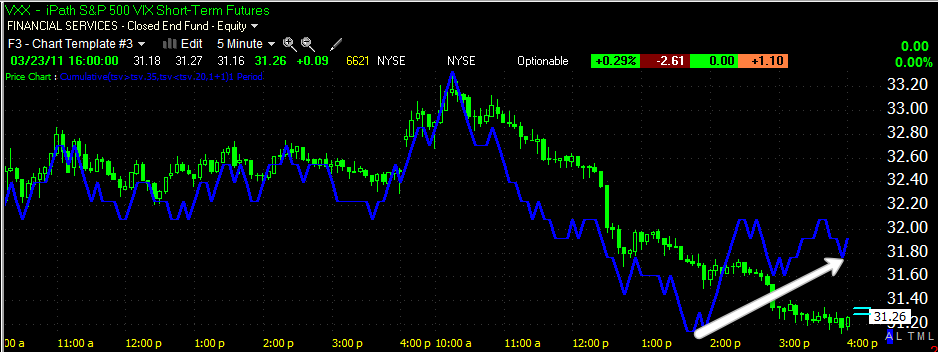
Take a look at the action in theVIX short term futures
1 min

5 min- a leading positive divergence E.O.D. (note that the VXX trades inversely to the market).

Here's how GLD ended the day
Again the blue indicator nose-dived.

SLV began to show more weakness today as it is now exposed to the possibility of a false breakout/bull trap

 1 min SLV

 5 min SLV-notably going negative into breakout highs

And now the 10 min also going negative.

USO
Based on the closing action, the daily candle and the resistance zone of the March highs, this is an ideal spot for USO to pullback a little, it wouldn't endanger the uptrend and would be good to wring out any excesses.

I wouldn't be surprised to hear some unexpected news tomorrow. Today's end of day action wasn't at all typical.

Portugal's Vote is in "NO"

Here's the story

And the Euro's reaction

Currencies

 The Euro trust ETF-FXE showing a 1 min positive divergence-so we should see some upside there.

Meanwhile the more important 5 min chart of UUP has been very positive today.

I'm thinking 1 of 2 things may be happening, either this is just a short term correction intraday or perhaps there's an expectation that either the G7 or the Bank of Japan are intending on intervention in the USD/JPY pair as the first G7/US/Japanese intervention hasn't moved the pair much.

Other then the initial intervention at the blue arrow, the pair has traded lateral with a slight downdrift. $80 is the key level and if there isn't upside momentum, that leaves the pair open to a downside reversal.

Intervention would of course cause the dollar to rise if it was significant enough. Should the Euro succumb to bad news out of Portugal (not Greece ), then the dollar would only rise that much faster. The Euro/USD accounts for half of the Dollar Index's weight.

Chart Request -ENTR

This looks like a pretty decent trade shaping up (long)

 ENTR picked up support from October which saw an 80% rally


 The 60 min chart shows accumulation so it's significant.

 I count about 8 days worth of accumulation so I'd venture to say that ENTR could be in for a nice upside move.

 The 15 min chart-

 And the 5 min chart shows the market makers stocking up right before the move started.

 There's good volume on the original move up and today's, it's nearing resistance, which may see a temporary consolidation/pullback, but it should blast right through that area.

Here's a possible stop that seems to make sense. I personally like this trade right now and here and would add a little on a pullback

Market Update

The market today is looking like the coalition forces, but we are seeing some signs of movement that haven't been observed in recent days in some averages. Unfortunately my data feed for the Q's has been out all day.

Here are the others.

This is about the extent of the move on the SPY, not much but something. I would make no observations based on the SPY alone.

 DIA 1 min has gone into a nasty negative leading divergence

 As has the 5 min DIA chart

 The 15 min chart is finally starting to show some movement with a negative divergence

 The 1 min IWM probably looks the worst, which makes me wonder what the Q's look like.

 Although there's price confirmation today, it's still in a leading negative area, so this is a bearish chart as well

The 10-min seemed to peak yesterday at the open and has been in a leading negative position today.

And the 15 min chart agrees with the peak yesterday at the open which was distributed.

While I did publish higher targets possible a few days ago (which are still possible under distribution), some of these charts, such as the IWM are showing some real movement. Unfortunately I don't know what the Q' are doing and the SPY isn't doing much beyond the 1 min chart, this makes confirmation difficult unless we see the averages come unglued from correlated movement.

Here are the target's I posted Monday. The SPY is yet to hit any of them yet and considering the lack of confirmation on the SPY beyond the 1 min chart, I would still put more weight behind the idea that the at least the SPY, still has a decent chance of hitting a couple. Perhaps the IWM will diverge.

Correction-

I don't know why I've been talking about a Greek austerity vote today several times as I watch the live coverage from Portugal. It is Portugal, not Greece that is holding what could amount to a landmark decision regarding austerity measures that are being put to a vote today.

The Libyan Situation

Events in Libya are going from bad to worse. In a never ending cornucopia of conflicting statements, Obama has gone from "All options are on the table" to "No ground troops no matter what happens". Germany has pulled their naval vessels and AWACS aircraft out as they don't want to have anything to do with this should NATO assume command, meaning they'd have some obligation.

Now an Al Qaeda commander has released a message backing the rebels! Of course the fall of these long standing Arab regimes has been an Al Qaeda dream that is coming true. They will have a hand in events yet to transpire and as in all leadership vacuums, it's the best prepared that win so I'm sticking to what I said over a month ago that Al Qaeda is probably very busy setting up communications, liaisons, provisions and other elements that will give them an early foot in the door once the people and in Libya's case (maybe the coalition) takes down these regimes.

The image the allies are projecting is going to cause long term trouble in the region, it sets a precedent that they don't have the ability to effectively stop a would be despot from doing whatever they choose in putting down rebellions or establishing new governments. It's amazing to me that so many leaders show so little leadership. In the US alone, the message changes several times a day, it's no wonder Hillary Clinton is marking each day on her calendar with an X until 2012 comes. I have to say, in my opinion, this is largely the fault of the US. We have the ability (perhaps not the obligation) to put together a coalition, to have a plan and a set of goals as well as an exit strategy. Obama has been on Presidential vacation through all of this and can't even keep his cabinet on message, clearly because he hasn't formulated a message and more then likely, an opinion.

The consequences of what's happening now, in the long term, may be worse then the consequences of not having acted at all.

Again, the middle east just becomes more dangerous. Developed and leading economies are that much more in the hole and strategic alliances are likely to be tested to the breaking point. This is clearly happening in Europe, it's been happening economically for a year, perhaps this will be another nail in the coffin of that great experiment called the Euro-Zone.

On another front, I'm still waiting to hear the outcome of the Greek vote.

USO

A few days ago I was expecting a slight correction (healthy correction) in USO and some fundamental news came out pushing oil higher (I don't recall what it was at this moment with all the events going on, but I believe it was increased hostilities between the Israelis and Palestinians).

USO is nearing resistance now represented by the March highs, so now is as good of a time as any for a correction to brace for a move through resistance. I'd actually prefer to see that outcome as USO is getting a little over-stretched and maybe a little overbought. It's better to wring out the excesses before they get too excessive.

There are some preliminary readings that suggest that may happen, however, USO has not reacted to much in the Arab world in the short term, until Israel, so if events escalate there, USO may very well make a parabolic move to new highs, at that point, I'd expect a correction to hold near the former March highs.

Note today's daily candle has lost momentum compared to yesterday's as we near the March highs.

GLD/SLV

Gold still hasn't made a new intraday high, it's $.06 off.

Here's the current chart
There's an apparent negative divergence and lateral trade

Looking at the 5 min chart though, I'm not seeing anything here that looks ominous for GLD, it looks like most consolidations, whether they break up or down, so there may be some consolidation occurring to prepare for a move to that intraday high only 6 cents away. I'd actually prefer to see that happen as the 3C readings at that point would be more decisive as to whether the move is supported or a false move. Based on everything seen up until today, GLD looks ready for a downside reversal, unless a situation such as Japan or Israel is now being re-discounted.

SLV, not surprisingly being it has been the stronger looking of the two, has made a new intraday high by a comfortable margin.

 There has been decent confirmation on today's move with the small exception of the last 10 minutes or so.

The 5 min chart is very much the same.

I suppose now it''s Blythe Masters' move.

SPY Update

It looks like there's still some intraday upside potential in the SPY although it's filled most of the gap.

Positive divergence around 10:40, right now the SPY is just shy of confirmation, but in a consolidation so there's certainly the possibility of some more upside potential here based on the chart right now. I'm still not seeing a high probability trade/reversal on the SPY and it certainly doesn't have the edge I'd want to go long either. This one is a wait and see which is what your advantage over Wall Street is all about, you don't have to trade unless you find a high probability trade. Make sure you use that advantage and don't get caught up in the excitement of the "game". There's a difference between a good poker player and a gambler and that is odds and knowing when to press and when to back off.

Keep an eye on HDY

HDY is approaching the breakout level

EGPT

Finally around 10:30 the NYSE specialist opened EGPT for trade, one of the reasons I'm not crazy about the NYSE. In any case, it's down 7% thus far, which only goes to show that EGPT is not on a stable path of reform as far as the market is concerned. Heck, they can't even keep their stock market open without circuit breakers tripping.


Needless to say, this trade is moving in the right direction and I would keep it on.

Broad Update

OXGN from yesterday's early Trade Alert is up nearly 6% and appears it will add more. Remember these are not position trades, at double digit gains you want to start thinking about taking some off the table

Yesterday ADM was highlighted as a potential short, we were/are waiting for the 15 min chart to go negative.

Here's an alternative entry as well


FXE Short was another call yesterday, it's down this morning and filling some of the gap so this trade (if you like it) looks pretty good still


The same goes for UUP long.


The CAT trade idea (if you shorted at the time it was released) is already profitable. If you decide to take the more conservative entry (short below $106.03) listed, there's still plenty of downside potential in the trade.


The Israel/Oil post talked about USO being strong and the bigger picture charts looking like a new high will be made soon (above the March highs) especially if the tensions in Israel's conflict mount. Today tensions have continued to mount. A bomb has went off in Jerusalem killing 3 and injuring dozens. USO continues to climb.

As for the DE short, it didn't bounce as high intraday as I would have liked to see, but it did give a better entry on an intraday trend higher. This morning DE is down about -.85%; it's still in a decent area for a position.

HDY was a long idea which has pulled back this morning, I'd watch it for a move above $6.30, ultimately we want to see a break out above $6.38 or better.

GM was another short idea, one in which we wanted to enter on strength, we may see that strength today, so if you are interested in GM, keep in touch with me for updates on where it is in the cycle.

SLV is up today as expected, the high probability entry we are looking for has not emerged yet. However, SLV is making a new breakout move so it'll be watched carefully as these usually precede a reversal, just as we saw on 3/7.


GLD threw a surprise curve ball today as I expected it to be down. It may too be going for a breakout as it's only $.07 away from an intraday high. So GLD will be watched even more closely for a shot at a reversal. The 1 min chart hasn't kept up with price, the 5 min has. We'll have to see where the deterioration occurs and how quickly.

The LEI (long) trade alert, if bought at the time presented, gained nearly 17% yesterday and is currently up about 15%, this is in the double digits and I would personally be taking some off the table, however, the breakout was strong, the upside target was near $6 and it is in a consolidation right now, so I probably wouldn't dump the whole position on the double digit gain, but I would take some off the table to guarantee a profitable trade.

The Market is off a bit this morning, but there are some 1 minute divergences that suggest more of the gap may be filled shortly. As far as a solid reversal signal, there are hints of it on the 15 min chart, but I want solid, high probability trades. The current 15 min charts don't give the overwhelming edge I'm looking for in a trade so I remain cautious on shorting the broader market, even if I miss the boat a little.

 DIA 1 min

 DIA 15 min.


 IWM 15 min

 SPY 1 min

SPY 15 min