Wednesday, December 17, 2014

Beating the market takes "Considerable Patience"

The two key words of the day as the F_O_M_C left in the term "Considerable" time , but added a new one, "patient", leaving many considerably confused, yet the market which we have forecasted since Friday, fleshed out on Saturday and have been providing evidence for our theory all week, has made the move we expect, or at least is most of the way there with the IWM closing up +3.5%, close to my > $118 (or above) IWM target for the Crazy Ivan head fake.

However, if today's knee jerk rally was related to the short term positive divergences of this week and the levers including HYG, TLT, VIX and USD/JPY), then there was a leak. More likely as I theorized this week, the F_O_M_C knee jerk reaction would act as perfect cover for the move that we forecasted 5 days ago, all it took was the market to define the reaction to the F_O_M_C by leading strongly in to the policy statement which it did and which the leading indicators/levers did in advance of the statement.

When you really look at what was said, this was not a dovish F_O_M_C, thus the knee jerk reaction was either on a leaked policy statement which I doubt as it would have had to be leaked days before the meeting even began or 2)  it was as I suspected and the knee jerk reaction was defined by price action which had already been set up and in place as we have been showing all week or 3) it was a totally random knee jerk reaction in which case, as usual they are almost always wrong and faded (recently or the last couple of meetings) within 2 days.

I think after seeing the charts, the levers, and their subsequent reactions, you'll agree with me when I said, "Tomorrow's F_O_M_C's typical knee jerk reaction could be the perfect cover/catalyst for such a move." in yesterday's Averages, HYG, TLT Update post

 Or in last night's Daily Wrap, " I would suspect we'll probably see it sooner than later, in fact tomorrow's F_O_M_C looks like the most logical place as the Knee Jerk reaction would be a perfect place, perfect ignition and perfect cover for such a move. Remember that F_E_D events almost ALWAYS see a knee jerk reaction and it is almost ALWAYS wrong, so this would fit perfectly at the 2 p.m. policy announcement and the press conference following."

I believe price action set the tone for the initial interpretation of the F_O_M_C and thus the knee jerk price action, however as I pointed out, there were several things the market DID NOT like, such as this The Market DID NOT Like That when it was mentioned that data dependency could cause rates to rise sooner than anticipated or, the seemingly very blatant warning, "A couple of meetings" with the definition of a couple being 2 which would put a rate hike at the April 28/29th 2015 meeting. There were other statements such as the policy statement's, "Almost all participants see a rate increase in 2015" . 

Peter Tchir of Brean Capital believes this is a very direct warning to the market with the addition of Yellen's notation that a rate hike does not have to be on a meeting with a press conference or a press conference could be held by telephone and his notation of her comments, "I keep telling the market what we are going to do, I wash my hands of the market if they won't listen". As such Tchir has taken on an instant bearish bias with recommendations to take positions in 3 year treasuries (SHORT), Front End EuroDollar Futures (SHORT), and SHORT Equities/Stocks.

However we make our decisions not based on Tchir's interesting comments, but on objective data, the same objective data that told us nearly 5 days ago that the IWM > $118 was the  target and all levers to ramp the market had been engaged by yesterday. 

Of the 4 major market averages,  the IWM had the best relative performance which I said to look for in yesterday's Quick Market / Leading Indicators Update "The SPY 1, 2, and 5 min chart now have positive divergences. The IWM 2, 5 and 10 min charts have positive divergences, this looks to be the strongest and should have the best relative performance vs the other major averages." also as early as Monday night's Daily Wrap in talking about the Dominant Price/Volume Relationships, "...of all 4 averages shared the same relationship which may be reflective of only the IWM needing to make the move I mentioned, the others can lag with worse relative performance or even be red!"

The two strongest averages in 3C underlying trade have led the market, the SPX and the Russell 2000 at +2.04% and a much more impressive +3.11% respectively with the NDX coming in at +1.85% and the Dow behind at +1.69%...all impressive moves to be sure, but there's only one average that can draw the Mass Psychological attention of the market and that's the Russell 2000 for this very reason which is why I suspected this move as early as Friday based solely on Mass Psychology until the charts began giving us confirmation Sunday night and through the rest of this week.

The market is not that strong to pull off the move on its own, thus the need for levers which we saw activated all week, furthermore, the most obvious range and breakout which has not yet seen a head fake move would be the 6 week range in the Russell 2000. See the SPX, Dow and R2K's price charts and you'll see why the market that "should" lead a risk on move and get bulls to commit, thereby creating a bull trap, is also the easiest to hit and create a clear breakout that technical traders will buy.
 The SPX has already run a Crazy Ivan shakeout of it's large Broadening Top (megaphone top) with the first shakeout of the pattern at October lows and the second in the yellow region above the top, telling technical traders the breakout above invalidated the topping pattern. This would be quite a ways to go and psychologically, not as obvious or as clean of a breakout.

 The same can be said of the Dow Industrials.

However the very reason we first suspected such a move was based on the Russell 2000 being caught in a range for 6 trading weeks with only 1/3rd of a percent of movement over the entire period, creating a very obvious target for a head fake or a VERY visible, obvious price range...
Russell 2000 has seen no head fake move which is almost unheard of for a range this obvious, this long in an asset this closely watched,  thus our IWM $118+ target which the Russell fell only about 1 point shy of today as it added 3 and a half points today alone!

With by far the best relative performance of the major averages today, the IWM added 3.5 points, only 1 point shy of our minimum target for a breakout/head fake move ABOVE the range (closing at $116.93, it's barely a point away from the target area and the best relative performer  as all indictions portrayed before today).

Now for the interesting stuff...

As far as Leading Indicators go, I listed many of this week's posts earlier here, Levers In Action which can essentially be boiled down to the thing I said this week and the same thing I said on October 10th near the October lows when we expected a MONSTER RALLY that would scare all shorts, even those who knew it was coming... "THERE'S ONLY ONE REASON TO ACCUMULATE HYG, TO RAMP THE MARKET"

 As you can see and as posted numerous times this week, HYG was accumulated as a ramping lever and was leading the SPX at yesterday's close at #1 already and well in to today.

It seems those who did the accumulation to ramp HYG and the market with it, are eager to exit the position as soon as possible and as pointed out earlier today, are already well in to the distribution process, although it's not near done which will serve as one of our best indicators as to when and where to enter shorts as this move fades and reverses to continue the stage 4 move lower to a new low below the October lows.

Intraday distribution on a relative and leading basis interrupted HYG's performance intraday and migrated all the way to a 5 min chart in a single day.

HYG's earlier in the week accumulation and a relative negative divergence in to today's highs.

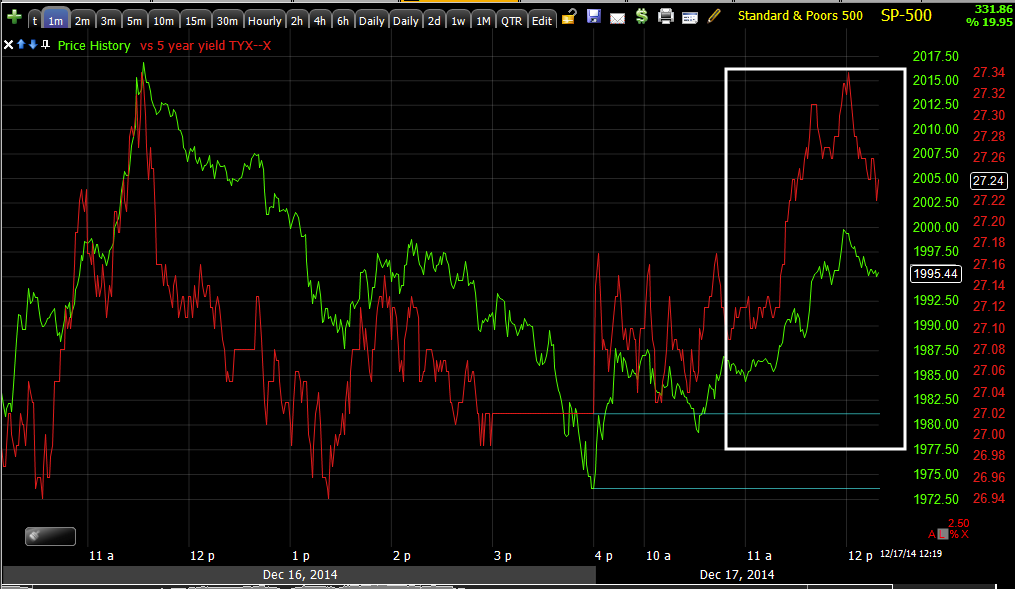
Of the other ramping levers, TLT was mentioned at least 4 times or more this week to be showing the kind of distribution that would send 30 year yields higher and lead or ramp the market as well.
I have inverted the SPX's intraday price (green) so you can see TLT's relative performance which out-performs near the close of the day, interestingly just after the bond market closed, making the 30 year yields not seen decaying in to the close as the SPX ramped and yields (leading indicator) fell.

As you can see, 30 year yields (red) were in line and leading the SPX as they were meant to do with the 30 year bond futures and TLT under distribution this week sending yields higher and pulling the market with them like a magnet, however as the bond market closes at 3 p.m., you can't see how yields fell in to the SPX's last hour's ramp.

THE LAST TWO F_O_M_C MEETINGS SAW YIELDS DIVERGE FROM THE SPX WITHIN 1-2 DAYS, AN EARLY INDICATION OF THE FADE OF THE SPX'S KNEE JERK REACTION SENDING THE MARKET LOWER.

As such, the initial accumulation starting back up in TLT and lower yields in to the close (via higher 30 year bonds) is one of the first early indications of a downside reversal after IWM > $118 is posted.

As warned all this week, TLT distribution to send it lower was in effect (thus bond yields and the market higher) as you can see on this 10 min chart.

 However I also warned that one of the things telling us this move up would be "short loved" and a head fake move is the strong 60 min TLT chart that went from pullback accumulation to a 60 min confirming positive divegrence seen above.

 Intraday, interestingly the 20+ year Bond Fund (TLT) saw positive divergences just after the F_O_M_C, just as HYG saw distribution at the same time start.

TLT's intraday positive divegrence, like HYG's negative, also made it to the 5 min chart, a strong accumulation sign for that much migration to occur in only 2 hours.

While the divergences are not yet strong enough (with only 2 hours behind them) to call for a reversal and likely won't as long as the IWM needs support to break $118, the fact the divergences are there are initial confirmation that our entire theory from start to finish is on the right track as the distribution needed this week in the asset was confirmed, the move lower in 30 year bonds was confirmed today, ramping the market and just after the F_O_M_C, the process to unwind the levers was confirmed.

The exact same signal (distribution early this week and late day accumulation) can be seen in the 30 year Treasury Bond Futures' 15 min chart as well.
15 min 3C chart of /ZB 30 year Treasury bond futures.

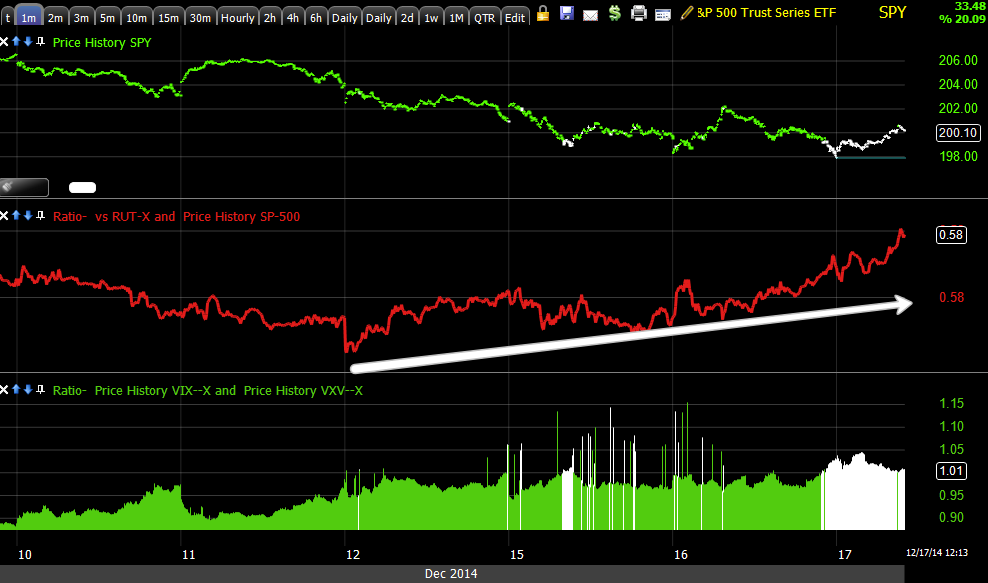
The next ramping lever, the VIX was showing signs as early as last Friday of a downside move with a Star on the daily chart. As I warned then, "I don't think VIX is done on the upside, but it doesn't and usually won't move straight up".
On a daily chart at #1 the VIX highs and our custom DeMark inspired buy/sell indicator with a sell signal, followed by a buy signal on 11/10 @ #2 with Bollinger Bands pinching indicating a highly directional breakout to come which did and the star or loss of momentum on Friday as our theory for this move started to come together followed by a lower close Monday, a Doji Star (signal of a loss of upside momentum) yesterday and today's obvious move down and back in to the Bollinger Band as VIX futures were used as well and seen earlier this week headed that way in yesterday's post, VIX Update.

Both VXX (Short term VIX Futures) and VIX Futures themselves also showed early signs of accumulation after being under distribution all this week, another lever apparently being slowly or at least gradually considering there were only 2 hours after the F_O_M_C, BACKED OUT OF...
 VXX 2 min negative divegrence in to this morning's intraday highs and late day positive divgerence in to the F_O_M_C.

VIX futures also show a late day positive divegrence in to the F_O_M_C.

And the fourth ramping lever, USD/JPY was ramped hard and ES/SPX futures with it.

USD/JPY (candlesticks) vs. ES (SPX Futures) ramping together as expected as the 4th major market lever.

There's no initial signs of a reversal here and I wouldn't expect one until the target is hit, but there is some Yen accumulation underway, but not $USDX distribution, which got an added boost today on Euro weakness as the Wall St. Journal reported the ECB's Coeure who is against ECB sovereign QE (as the Bundesbank made very clear yesterday as well), that among the ECB there is, "broad consensus around the table in the governing council that we need to do more to raise inflation and boost the economy.

The market took this as a sign to mean the ECB has broad consensus, despite the story just a week ago that Draghi has a virtual mutiny on his hands with ECB members, that sovereign QE, a thing that  is illegal under the ECB's charter, was imminent, sending the Euro lower.

This is how sick this market is and how addicted it is to QE which has ended in the US, is almost meaningless in Japan and is very unlikely to ever happen in Europe, but once again, the normal fight against deflation that any Central Bank would wage in the ECB's place right now is instantly equated with QE, although no one EVER SAID ANYTHING along those lines, in fact directly the opposite. However, QE is associated with inflation and the market desperate for anything , the story sent the EUR lower and the $USD higher, thus the USD/JPY as well.

So for our fellow Wolves in Europe, if you were wondering what sent the ERU/USD lower today, it was the Wall Street Journal article that again said there is broad consensus to fight deflation in the Euro-area, it did not say ANYTHING about sovereign bond purchases by the ECB, that was the market's wishful thinking, despite it being illegal for the ECB, despite Germany and the Bundesbank never likely to allow it and the "mutiny" Draghi has on his hands.

As for the EUR macro trend...As hard as this may be to believe (we only see what smart money is doing, we don't know why at the time just like the huge accumulation in Home-Builders after the Tech bubble popped, who would have ever dreamed that housing would lead the next bull market after the Internet literally changed everything in our daily lives? Well the accumulation of Home Builders was there for more than a year and a half several years before Home Builders gained +2500% in to their 2005 highs), but for whatever reason, the EUR's macro trend actually looks bullish.

The daily 3C chart of Euro Futures has been in line with the decline of the Euro, but recently has put in a positive divegrence as price's downward ROC has faded from down to lateral as if the Euro was putting in a bottom.

I digress...

While I do not expect to see any meaningful distribution until the IWM has passed $118, as this move not only comes at a perfect area for the IWM's 6 week flat range, but also playing off the "assumption" that this year we will have a Santa Claus Rally like any year (an assumption that may prove fatal for longs with this particular move as price "seems" to point in that direction)... There are things we can still see that tell us our theory is still on the right track as it has been proven right all this week since first put forward Friday and Saturday leading right in to today, among a horrendous downtrend in stocks, simply meaning that most probably would not have called for such a rally in such bearish circumstances and it remains one that I would not sleep well at night having entered on the long side, although yesterday's analysis of which average to take if you were to trade it long was right on...Our look at Leveraged ETF's TQQQ/SQQQ proved to be correct in picking Leveraged Market ETFs: URTY/SRTY, the 3x long IWM over the 3x long QQQ as IWM outperformed QQQ by nearly 100% today.

One of the biggest movers in the market today was the Most Shorted Stocks, but that's not hard to believe with recent market activity. The MSI (Most Shorted Index) saw it's best day in 3 years today.

Eric Hunsader from NANEX provided us with a Tweet of ES action today...
The second highest net change in E-minis in nearly 3 years!

As suspected, the RUT outperformed everything else by a fairly substantial margin, transports lagged at +.84%

However the SPX still put in its best day since January of 2013, this is one of those "seemingly bullish" events, when in reality, bear market rallies (after the last week or so) tend to be some of the strongest you'll ever see so the performance in an otherwise bearish market on a hawkish F_O_M_C isn't all that surprising and part of the wider RUT head fake move we are looking for.

Furthermore, the path of highest probabilities still remains with the longer term charts like SPY 30 min...
Highest probabilities-SPY 30 min leading negative divegrence... 

Remember this is a move we called as early as Friday, fleshed out the concept over the weekend and showed the levers of market manipulation being pulled right up to today so don't get lost in the short term emotion of the market.

Although the positive divergences we tracked earlier in the week are still there,
 SPY 2 min positive

IWM 5 min positive...

That doesn't mean some damage wasn't done intraday.

SPY intraday.

The IWM is nearly perfectly in line intraday, but remember this entire move is about IWM $118 so until it hits the area, this shouldn't surprise.


Oil and our USO calls, although round tripped back to unchanged, still have a very strong positive divegrence and our calls should have plenty of time.
USO 15 min positive divegrence, oil should see a nice short squeeze.

As for market breadth, the Dominant Price/Volume Relationships weren't surprising.

The Dow lacked a Dominant theme, however the SPX and NDX were both Close Up/Volume Down, the most bearish of the 4 possibilities with 258 and 67 stocks so very dominant, while the Russell 2000 saw 1083 stocks in Close Up/Volume Up, the most bullish relationship.

Although there are some next day implications, the fact that all of the averages were scattered doesn't leave me placing a lot of faith in them. However the themes do seem to tell us what we expected, the R2K is strong right now at least until it hits our target while the SPX and NDX are showing typical bear market rally breadth weakness. This is exactly what we should expect when we were looking for relative outperformance in the Russell 2000/IWM.

Last night looking at the Industry groups over a 1, 5, 10 and 21 day period, we had a deeply short term oversold condition, so that was right in line with our expectations for this move. Tonight of the 9 S&P sectors, all 9 of 9 closed green led by  Energy at +3.87% and lagging was Industrials at +0.93%.

Any other time I'd call this short term oversold, but I think the IWM keeps going until it hits its target. That doesn't mean the SPX, NDX and Dow have to keep up the relative performance in which they even lagged today also as expected.

Of the 238 Morningstar Industry and Sub-Industry groups, a WHOPPING 235 of 238 closed green, that to me is a 1-day overbought event that would normally close lower the next, but I still think the IWM keeps plugging away until the head fake move (Crazy Ivan) is in place > IWM $118.

Intraday TICK was easily hitting the +1500-+1800 range today, not unusual for a short squeeze, but as the levers like HYG back out, you'll see the signals of where a head fake reversal and short sales are best entered, emerge pretty clearly. Remember there's a reason I decided not to piggy back trade this market long, the support for a stable base is NOT there, you could easily wake up to a massive gap down, but again I think the Russell 2000 breaks out first as that's the point of this entire move.

A lot of our Breadth indicators seemed to move quite a bit today, however others are mired in bear market-like readings, for example the Percentage of All NYSE Stocks Trading ABOVE Their 40-Day and 200-Day Moving Averages   are still very low at 37% and 43% respectively so it will take a lot more than 1 day to make a dent in breadth, those rotting pilings under the pier out of view.

As for futures, surprisingly the Index futures that were in line (confirming) intraday, don't look so good tonight (this is what I meant by I wouldn't be able to sleep going long this move- charts like this)...

In line and confirming price during the cash market hours, but after hours Index futures have leading negative 1 min divergences and this is TF! Russell 2000 futures!

The 5 min charts are in line for the most part with some Nikkei 225 Futures weakness STARTING to develop.

The 5 min $USDX still looks strong, but as mentioned, the Yen 5 min is also looking like it will strengthen as it puts in 5 min positive divergences, so when the time comes for the lever of USD/JPY to fail, it will probably do so spectacularly.

As for the 7 min charts, where this move was built, the $USDX looks parabolic with no support, again, I take this as evidence that the move near term is strong, but should fade off pretty fast once the IWM makes the breakout move and fails shortly thereafter. The Index futures have good support here except for NQ/NASDAQ 100 futures, a bit weaker than expected after looking at TF and ES. Still I expect this move to finish playing out.

Tomorrow I'll be busy watching the levers, especially if we get close to IWM $118 as that's all that's needed for the market to fail and the levers will be the first place to see that happen. I'll also be very busy looking for the best short sale assets, although you know what some of my favorites are among the leveraged inverse ETFs, I'll be adding individual equities as well.

If anything pops up in futures tonoght (Which I don't expect), I'll post it and let you know, otherwise, keep your eye on IWM $118+ that's the finish line for this head fake move.

MORE EVIDENCE WE ARE ON THE RIGHT TRACK

And one of the reasons I didn't trust this market enough to ride a piggy back long. The market lever HYG accumulated all week and used today to lead the averages higher even before the F_O_M_C, but now that HYG has done its job, initial distribution has increased, as I said, smart money doesn't want to be sitting long HYG when the music stops for lack of a chair to sit in.


THIS IS EVIDENCE OF MIGRATION OF A DIVEGRENCE-DISTRIBUTION. HYG which has been accumulated right up until yesterday's close and all of this week is now under distribution and this is one of the market's KEY ramping levers. Smart money is closing the ramping position that led to HYG leading the market higher today even before the F_O_M_C. I'll look at the rest as soon as possible. This is EXACTLY why I don't trust this market for even a short term piggy back long.

 1 min intraday

2 min relative negative

3 min leading negative intraday

And now even a 5 min relative negative so soon after the F_O_M_C

The Market DID NOT Like That

I always try to watch the press conference while watching the market, Yellen said something about possibly raising rates sooner than later, if conditions warrant. This is what the market/SPY did...
SPY drop at Yellen Comment

NOTE THE CONSIDERABLE RELATIVE PERFORMANCE CHANGES BETWEEN SPY THAT WWAS LEADING VS IWM THAT IS NOW LEADING

Charts of Initial Interest

As I have been saying, this move is more about the IWM than any other average so I wouldn't be surprised to see relative performance lag in the other averages although that's not the case in outright price right now, it is the case in underlying trade as the IWM is more than half way to our target on the first day as we suspected the F_O_M_C would be the cover for such a move.

Also of interest, the lever of HYG which you saw leading the market earlier today, is already showing initial signs of them selling out the position they accumulated to lead the market today. I haven't had the opportunity to check everything else as I will, but these are definitely of interest initially, especially if they keep up.

 With the IWM half-way to our target, there are some interesting initial underlying trade signals.

Remember, this is all about the IWM's breakout, the other averages don't have such an obvious resistance level. You'll notice below in both the averages and Index futures, the IWM is the only one giving strong confirmation after the F_O_M_C.

IWM confirming...

QQQ pretty close...

 SPY is parabolic and NOT confirming thus far.

ES is NOT confirming.

NQ is NOT confirming...


Only the Russell Futures, TF are confirming intraday.
 TF confirming

And more interesting, with the F_O_M_C knee jerk doing the heavy lifting, initial signs are indicating there's already HYG distribution.
The lever seems to now be seeing distribution having done its job INTO the F_O_M_C, setting the tone of their message for the knee jerk.

If HYG continues selling off, we know we are not only close, but right on!

Now for Yellen's "Splaining"

USO Position management

Our speculative USO call position entered Friday December 12th, Trade Idea: USO (Speculative Options) Jan $22 Calls based on these charts, USO Charts is in the green, more so earlier today.

I suspected a rebound in oil and energy stocks would accompany any move in our larger IWM/market expectations and thus far it has as part of today's Most Shorted Index short squeeze.

While I don't have any intentions at the time of taking gains from last Friday's call option position out to January standard calls, I do want to quickly update the charts.


 Note the daily volume the last 2-day, a change in character.

I do not think this is a trend change, but a decent trade.

The 15 min positive divegrence after what looks like an exhaustion gap.

And the short term timing charts...

There's some light profit taking, but it still looks like further upside.

And the Trend Channel has broken the downtrend since the gap.

I'll continue to hold for the time...

Levers In Action

If this doesn't prove to you that Wall Street is not only predictable and that predictability can be used to your advantage and that they often control short term cycles starting days and even weeks or months in advance, I'm not sure what will prove it to you beyond an outright confession and still you'd be at a loss as to how to use it to your advantage.

Friday I first posted my expectation that the IWM will break a 6 trading week range that had seen it move exactly -0.14% over the 6 weeks, it was based entirely on mass psychology, head fake moves and more broadly our concepts! Only -0.14% over 6 weeks? That's as flat as you get.

It's also one of the most enticing head fake areas you could ask for to create a bull trap and downside momentum. I have two links on the member's site going in to depth about the head fake move , why, when, how. The larger point is that these concepts are fractal in nature, can be used in any time frame and any asset because they all deal with mass psychology and the way Wall St. uses that to their advantage which is so predictable at this point that I had already fleshed out grounds for a move in the IWM above $118 as a head fake move before I had the first piece of hard evidence.

Here's the IWM as of Friday's close...
 This was the closing chart of IWM as of Friday, note the 6 trading week range with -0.14% movement. This is one of the most obvious targets for a head fake move that creates initial upside momentum , locking in a bull trap, but like always with deception, it's true purpose is the exact opposite. 

The very next trading day, Monday, after 6 weeks of not breaking the range...
We have the first break, a day after our theory starts to flesh out. A Crazy Ivan shakeout in which trapping shorts below the range creates upside momentum for a break out the IWM could not otherwise pull off on its own over 6 weeks. I showed an example of this Monday in XLF in the post, IWM Crazy Ivan

As I said, the concepts are fractal so no matter what kind of trader you are, they'll apply and they'll work because they are based on Mass Psychology, the two things that move the market- Fear and Greed which are what create supply and demand dynamics, thus the market in many ways is little changed over centuries because human emotion is unchanged, making how Wall St. uses that predictable if you understand how they use technical analysis and price action against you.

For example, a larger version of the same Crazy IVan/head fake move in the SPX creating downside, but that wasn't initially the perception...
SPX's Broadening top. Just like now, we predicted the October rally almost 2 weeks in advance and a week before we had any hard evidence which built up over the next week. The move below the top's lower trendline created an extremely bearish environment, perfect for a squeeze and strong move which changed traders sentiment and fueled the move itself, followed by an upside breakout making traders think the top is nullified with the breakout as Technical traders are extremely predictable to Wall Street's advantage. However that created a bull trap and you've seen the results last week with the worst weekly Dow performance in 3 years, the worst weekly SPX performance in 2.5 years.

I believe the exact same pattern is playing out or will in the IWM now. 

We've been watching for the evidence to back up this theory since the new week started, we've seen it slowly build in the 3C charts of the averages and Index futures, but the market is so weak it needed the usual suspects, the market levers...Yields/Bonds, HYG, VIX and USD/JPY.

I've posted numerous times this week on all of them, for instance...


These are just some of the posts that have shown the evidence developing such as Yields needed as a leading indicator to ramp the market and as such TLT needing to move lower.
 TLT's intraday charts have gone negative until they reached a 10 min chart. While I believe TLT will head higher, near term it is being used as a ramp today.


TLT (blue) and SPX (green) with price inverted to show the correlation, TLT is leading the SPX higher today.

As far as the evidence in yields...which we have followed via TLT and Treasury bond futures...
 5 year yields, a leading indicator are leading the SPX higher today.

30 year yields, part of our TLT analysis are leading the market today as we have been forecasting due to 3C signals in treasuries.


The most obvious lever of all, HYG as there's only 1 reason to accumulate it as they have this week in such an environment and you see the reason on this chart as HYG leads the SPX higher as one of our best leading indicators.

VIX was the 3rd of 4, we posted a lot on this yesterday in VIX Update

And the 4th is the simple USD/JPY, which is also leading the market today.
Note how USD/JPY (candlesticks) really pulls ES / SPX Futures up (purple) at the cash open.

We have been making the case all week, but it started with no evidence, just a high probability, tight range that should see a head fake move before moving lower.

The relative performance between SPX and VIX was another signal in our SPX/RUT Ratio custom indicator and our VIX Term Structure, both supporting higher prices or giving a near term buy signal.

SPX/RUT ratio (red) has refused to confirm near term downside and I've posted the VIX Term Structure custom indicators recent buy signals this week (green/white).

And all for what?

Again, I believe the exact same thing I believed Friday and Saturday, the IWM range is too obvious, it'''s a simple head fake/bull trap set up that like the larger head fake in SPX above the broadening top, will lead to increased downside momentum making last week's decline (worst weekly performance in 3 years) look tame.

It all starts above IWM $118, that's where we'll want to be looking at selling short or adding to positions.

I have considered a piggy back long as I posted yesterday, Leveraged ETF's TQQQ/SQQQ and Leveraged Market ETFs: URTY/SRTY

However I just don't see the kind of strength that would prevent this market from gapping down suddenly, thus I'd prefer to keep managing my shorts and entering or adding to new ones at the trigger level which is a break above the IWM's range, around > $118...

The Crazy Ivan shakeout trapping shorts as price moves higher , creating a short squeeze which is already under way today and giving the market more upside momentum to make the breakout it couldn't over 6 trading weeks, is already in the books on higher volume. $118 IWM is the trigger level that we must at least reach, then we'll be looking in to short selling additional assets which I held off on last week and in retrospect, I'm glad as they would have been poorly timed entries considering what I believe we are seeing.

In any case the F_O_M_C is in less than an hour, while I don't think the signals this week and price move are an F_O_M_C leak, otherwise the averages would have more accumulation, price initially determines how the F_O_M_C is received even if it is very hawkish, if the market is rallying, the knee jerk response will be that it was favorable and it provides the perfect cover, obviously considered when we first considered this Friday/Saturday.

The second half of a Crazy Ivan shakeout (shaking out both sides of the IWM's range) occurs > $118, although price can move higher, it serves no purpose as a head fake move unless $118 is hit as the minimum upside target, from there we'll watch for HYG distribution and in the averages and can add additional short sales at that time.

Although I'd love to trade any additional gains as we foresaw this 5 days in advance, I won't risk the bigger picture and larger trend gains now and that remains firmly planted in the longer term charts such as...


 SPY 30 min

QQQ 60 min

IWM 4 hour

ES weekly

NQ daily

TF 4 hour.

I don't have any idea what the F_O_M_C might say or do, but a new economic forecast is expected this release as well as the removal of the "Considerable Time" language, if it is left in, it will be seen as dovish and the market will knee jerk higher, if it is removed, then the F_E_D is preparing the market for the start of rising rates. 

There will also be a press conference after in which Yellen can contradict anything in the F_O_M_C statement- 30 mins.