Tuesday, April 12, 2011

Furthermore....

There's no one of consequence reporting tonight and the only other big firm I see reporting tomorrow is another financial, Charles Schwab so there's nothing really that big that would interfere with the game plan.

Earnings

After looking around, it seems the only major earnings announcement will come pre-market tomorrow morning by JPM. From what I see in the market in general and ETFs like BGZ that look good, it seems like they'll pullback, it has me thinking that JPM's earning won't be so bad and that may give the market the room it seems to be looking for to bounce a bit (short term).

It makes sense on a couple of levels, 1) JPM is going to probably have decent earnings derived from trading operations, they don't manufacture anything so the margin squeeze is not going to cause a problem. The caveat is this, what JPM reports may be a decent report and the market looks like it's setting up to react to the headline. What JPM will do moving forward seems less sure as the market seems less sure. Don't forget that the relentless POMO regime has given primary dealers a free lunch, JPM happens to be a PD so that should help JPM's earning, again though the caveat is the increasing likelihood that QE3 will not happen, which wouldn't be good for JPM moving forward, but Wall Street controls the media spin and a beat from JPM could easily be turned into a one day rally on its own, even though we all know that what is really important is guidance moving forward, not what you did, but what you will do. Still I fall back to the Wall Street spin machine and their ability to focus attention on a headline beat, rather then the true discounting mechanism of earnings which is, " What will you do next quarter?"

Lets look at JPM's 3C charts.

 First of all, the consistency is not as good as AA's yesterday, but this is my theory. We are starting with the 60 min. chart which is one of the most influential, in this case however, for my theory, it's actually the least influential. We are not looking so much at JPM's long term status as we are the short term movement for tomorrow. We do have a decent accumulation zone around $44.


 The 30 min chart shows a positive divergence today, so is someone loading up in anticipation of the positive spin on a JPM report?

 The 15 minute chart shows the same positive divergence.

 Here the 5 min chart, which is a less influential chart with regard to the big picture, i actually more important for this theory. It's showing a positive divergence, I don't care about the recent dip in the red box as it just makes JPM shares cheaper to buy for a 1-2 day trade.

The same is true of the least influential 1 min chart, there's a positive divergence, much like the market's and we have a recent dip in prices, again irrelevant for my theory.

So what JPM does in the weeks ahead may be very different then what it does in the day/days ahead. That's my theory and I think the charts look pretty good to back it up. If my theory plays out, then it's a good opportunity to pick up shares like BGZ on a pullback. If this comes to pass, we'll see another example of media and Wall Street mixing and the enormous pull Wall Street has on everything. We'll know soon enough.

Earnings After The Close

I'm looking at several Calendars and don't see any big influential companies reporting after the close, there must be some, anyone know of anyone big after the close today?

BGZ (long) Trade Idea

As I just mentioned in the last post/market update, my scan returned a unusual number of large caps, so we've covered the small caps with TZA, BGZ is a 3x leveraged short ETF on Large Caps. Although I prefer a blend of inverse ETFs (especially when I want to quickly cover a broad sector), I also like to have straight out short positions as there are advantages to a short position that a long inverse ETF can not provide you with. There's also a danger in dealing with highly leveraged ETFs as they are intended to approximate 1 day's gains/losses and because they don't always hit the target exactly combined with the effects of compounding and leverage, they can be dangerous in a choppy market.


 Here's my X-over screen on a 60 min chart giving a long signal on BGZ, from the looks of it, a pullback is a probability and is in fact underway right now. The first two targets for the pullback are in red.

 Here's the daily Stoch/RSI combo indicator that has been testing so well, giving a long signal. One thing for your technical tool box, this chart shows a great example of what traders expect a market to do in the case of a double bottom and what the market actually does as it has transformed over the years, while traders fail to keep pace with Wall Street. In the past, a good double bottom price pattern would see the test (the second bottom) fall just short of the lows of the first bottom; this is meant to be taken as strength.

However, Wall Street quickly adapted to the expectations of technical traders, ever since the advent of the internet and the rise in popularity of technical analysis. Now, more often then not, we see the old ideas turned on their head as we see here the second bottom made a lower low. There are several reasons this happens, 1) in the low volume trading environment we've been in for a couple of years, anything to trigger orders (limits/stops, etc) increases the opportunity to make money on the bid ask spread as volume typically is higher on this kind of breakdown. 2) Firms receive volume rebates, therefore the more volume they can create, the more rebates they get. 3) It shakes out traders and allows Wall Street to pick up shares on the cheap. Wall Street knows that most retail traders will take one shot at a position and if it fails (due to the lack of risk management), the retail trader usually loses money, sours on the trade and forgets about it, again shares are picked up on the cheap. Many books have taught technical traders the following concept, "If your expected trade goes against you, you should turn around and take the opposite side of the trade", this gives Wall Street a chance to knock traders out of the same trade twice, gain on the bid/ask, increased volume and rebates, and gives Wall Street's trade a head start as traders close positions at a loss, it moves the trade in Wall Street's favor.

Just something for your tool box.
 Here's BGZ's 60 min. 3C chart, note the negative divergence occurred on a false breakout (similar to what I just wrote about, but in reverse) and it also shows a nice positive divergence which is leading.

 The 5 min chart shows a negative divergence and a pullback since then.

Here's my Trend Channel and several stops it triggered as well as holding that nice downtrend. The white box is an area for a longer term stop. ADX turned down in January suggesting the trend down was ending, it's nice and low now and set to move up with a new trend (up).

Market Update

Since the last market update showing some short term positive divergences, the markets are off their lows and in a slow steady crawl uphill.

I just ran a scan, it returned (less oil companies as I'm weeding those out for the time being) 102 candidates that need a closer look, but what seemed to be a common theme was a large proportion of large cap stocks looking a bit weathered and in some precarious situations. As I review and list ideas, you'll ave a better idea. For now, lets take a look at the market, I may also try to see who's reporting tonight and get a glimpse of any underlying action. If you saw last night's video which should have reached your email, then you'd see that AA was indeed one of the very few stocks that I would have called an earning splay on (short) and I rarely call earnings plays unless there's overwhelming evidence/probabilities, but in the past, we've had some very successful earnings plays. I think a couple of quarters ago I wanted to show you 3C's ability to see under price and determine what was really happening. It's not too often that I find what looks like a blatant leak that Wall Street acts on before earnings, but I do believe they are out there and that earnings season we had 22 picks, 20 responded favorably.

Here's the current market update
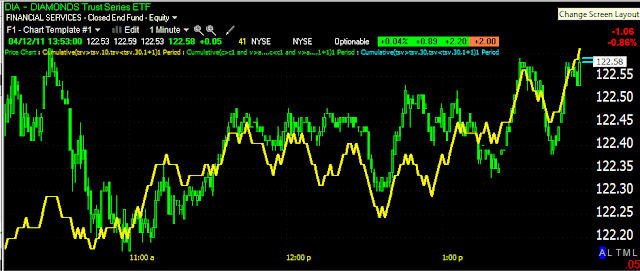
 Here's the DIA with a tight view, it shows confirmation since the last update around 11:30 in which we saw positive divergences suggesting an intraday bounce.

 The IWM is also showing good confirmation thus far.

 The 5 min chart looks downright bullish (still this is on an intraday basis as of now) with a leading positive divergence.

 The Q's appear to be struggling a little more then the others, there's a possible negative divergence forming , but it's not well formed as of yet and could fall in line shortly. We'll want to watch for evidence of deterioration, otherwise, at this point I'll assume that the Q's should keep pace with the other averages.

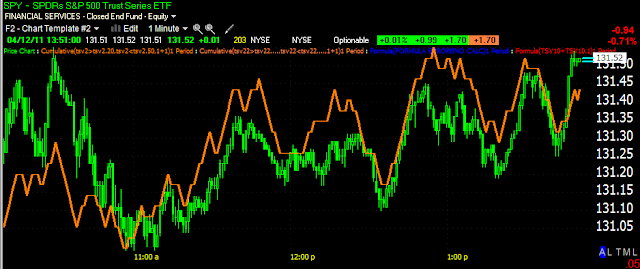
 The SPY is also showing a little bit of weakness very recently, but not at the point in which I'd start sounding alarm bells, it's not so far that it can't catch up.

 This is the same chart of the SPY, just zoomed out a bit. It looks more positive then the one above because the earlier positive divergence lifted 3C, but in essence what we still have is basic confirmation, there is no leading divergence which would be very bullish (short term/intraday) into a rising intraday trend

To back out of the trees and view the forest, here's the SPY 60 min chart which is quite negative, but the market never travels in straight, uninterrupted lines. It's just important to remember that even should we get a daily bounce/close higher, there's still a ugly problem on the more influential charts.

TZA (long) Follow Up

This is the second follow up since the original trade idea on Thursday, April 7th.


Since, TZA is up 10% in 3 days. More importantly for more conservative traders, it just broke it's first level of important resistance. There may be an opportunity to pick up or add to TZA on an intraday pullback.

 Here's our original trade idea and today's breakout through gap resistance. By the way, my opinion is that gap support and resistance is some of the strongest, just something to keep in mind.

 Here's the daily Stoch/RSI buy signal

 Just to show you how strong TZA looks, this is a 60 min very positive leading divergence

 Here's a short term 5min negative divergence which lead me to believe a little pullback may be coming, especially now that it's broken out.

On this hourly chart are two potential pullback targets, I lean more toward the yellow moving average or in between the yellow and blue. At that point, I'd give some serious consideration to initiating or adding to the trade. Feel free to email me on a pullback or whenever you might be considering a position, for an update.

Word is FX Carry Trades Are Being Unwound

In short, not good for equity prices.

Take a look at the Euro and USD (via FXE/UUP)

The pair is falling, meaning the dollar is gaining.

 FXE (Euro) a 5 min negative divergence, but note that it wasn't until FXE first posted a breakout new high or "head-fake" which is so common before reversals now it's nearly a prerequisite.

And UUP, makes a new low into a positive divergence before moving up today.

JPY will be interesting as it gains against the dollar, possibly sending it to the G7 intervention levels

SLV/GLD

For more then a few weeks now I've been saying SLV has been stronger then GLD, that appears to remain true. We have two pullbacks, but each are of a very different character. First SLV


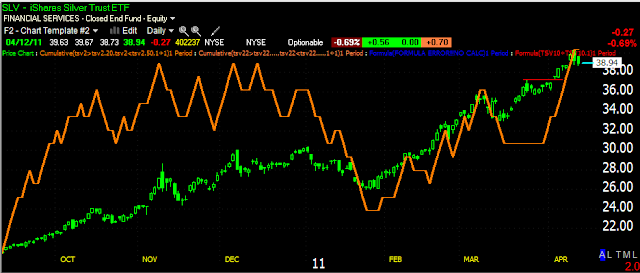
 SLV Daily chart and 3C, there's no negative divergence here, just confirmation of the uptrend.

 On the hourly chart, again confirmation

 The 30 minute is close to being negative, but more or less it's still confirmation.

 The 15 minute is almost perfect confirmation.

 Only at the 5 min and 1 min below do we have negative divergences and SLV is pulling back so it makes perfect sense.


Now GLD
 First, I included the sell signal on the Stoch/RSI indicator, I didn't show it on SLV because RSI is in confirmation, there's no negative divergence so no sell signal, that's a big difference.

 The daily 3C GLD chart looks almost exactly like AA's did, a negative divergence on an important breakout.

 We see the same negative divergence on the 30 min 3C chart at the same breakout point.

 The 15 min chart is in a leading negative divergence which is the worst kind, while SLV was in near perfect confirmation of the uptrend.

And the 5 min is negative as it should be on a pullback, but I suspect that GLD may experience more then a pullback. Should the support at the $140.75 area give way, we could see a very fast fall in GLD. It would probably be a trade worth looking closely at.

Market Update

It looks like an intraday bounce is in the making.

 I haven't tested the Stoch/RSI intraday, but there's a signal, so lets see what it does. The DIA is in a 1 min leading positive divergence.

 The 5 min DIA is in a relative positive divergence

 IWM is in a leading positive divergence (the lateral price movement is also a hint)

 IWM 5 min in a relative positive divergence

 QQQ in a 1 min leading positive divergence

 The SPY saw a volume spike near the bottom, also a typical feature before an intraday reversal.

 The Stoch/RSI 1 min on the SPY giving a positive signal

And the SPY 1 min in a leading positive divergence.

I can't say how far this will go yet, but this early with the market down this much, it has to avoid an oversold condition so an intraday bounce here makes sense. If there are shorts you like, this may be the time to use strength to dip your toes in the water, don't forget about EDZ, it's looking great.

Trade Deficit and Import Price Inflation

The Trade Deficit, like most economic data can be spun however you want it to appear. You can say it's better because it came in at $45.8 billion vs $47 billion in January, or you can say it disappointed at $45.8 as consensus was for $44 billion.This is why earnings and economic reports can look so different in the media, one headline saying there's improvement, another saying the Trade Deficit was a huge disappointment.

The one thing in the report and what has been a material fundamental factor for well over a year and probably will be the biggest underlying fundamental factor this earnings season is the continued price inflation. You can't really argue this one to much, the Import Price index came in at 2.7 from 1.4 previously and consensus of 2.1-Lose, Lose.

This will hit every sector in the economy in one way or another and I think it will be a central theme in earnings this quarter. Just another report in a long line of reports confirming what we've known for a long time and something the Fed ignored as long as possible, Inflation is here and I don't mean as if it just arrived in the manufacturing sector, it's so embedded now that it's creeping into consumer prices.

That's the Fed's easy money, Chinese Finger Trap that will have to be unwound and in the process may create the first secular bear market in equities.

AAPL -A Tool

You saw the post yesterday on AAPl and the channel

This a.m. it looks like someone is desperately trying to halt the slide in the market and their seem to be having the battle over at AAPL.

 Positive, but a real struggle.

Late in the afternoon the positive divergence picked up, even more so since this morning. Let's see how this plays out, AA certainly spooked the market and I think for good reason.

AA and Last Night's Video

This post is especially for all of you 3C users. When I gave you the code I told you, there's a steep learning curve with 3C, you are learning to look at the market in a different way, to see how the market internals and cycles work and how much influence Wall Street has.

Even I am learning some lessons still and I invented 3C and have been using it for a looong time. Yesterday afternoon I said this about AA,

"I'll get the 3C charts out soon, long term charts are negative. Short term charts are more or less in line, the mid terms are a bit questionable, otherwise I'd say AA is not going to have a good report."


There was one chart that stood out, that didn't fit in with the consistency of the others.


In this post I showed you the 15 minute chart that I called a possible anomaly.


It turns out it was. Usually, as I explain in this video, one version of 3C works best for each individual stock, but as the video shows, the other two versions looked identical on the 15 minute chart and matched everything else, AA was an earnings short. So the point is, when something just doesn't fit, see if you can find confirmation in the other two versions, not just one version because that allows you to cherry pick and that's not objective, both versions should match. You'll see that they did in the video above.

Second Day Down In USO

And thus far we've passed the first target, which was to be expected, we are nearing the second target and I want you to keep in mind what I said about this yesterday. It appears they'll shake the tree hard on this one and as I said, you may look at the chart when all is said and done and not even want to buy USO, but I remain very positive on this move, it's overdue, it's a good opportunity and shortly we will see the locals snapping up USO. We haven't even hit the more likely second target or the extreme 3rd target.


Targets can be found here.

Your main advantage over Wall Street is patience, you can wait, you don't have to be in the market al of the time. Use that to your advantage with all trades, but especially USO.

USO daily