Thanks for the understanding, as you know I serve as Secretary and Treasurer for our board and we had an insurance agent trying to rip us off for $35,000 in premium, little did he know I have my 2-20 license and specialize in the COA field, he thought presenting a lie with 1 day to renewal would work, I figured out his lie and had the entire 25 million TIV re-written in a day as we expire tomorrow, but I had a lot of papers to sign-he'll be surprised when he gets back from vacation that he lost our account and I figured out how he was milking us out of an extra $35,000 a year.
In any case,
nearly everything I said last night, came true today, from the market's tone, the change in character, the move up in AAPL that would set up a new short, GLD and SLV both looking like they are finding a tradable short term bottom, credit and on and on, but especially how risk assets are being sold off and safety and protective assets are being accumulated, for instance I told you yesterday TLT was under accumulation, it gapped up today to the largest 1-day in 5 weeks.
I said Macro economic data is going to be more important as the market has been ignoring it...
US MAcro Economic data hitting 8 month lows and after this mornings mess, it's no wonder the market struggled.
I've been telling you all week that price looks like one thing, but below the surface they are fighting and clawing with everything they have to move the market up and that risk is being sold at any opportunity they get.
Most importantly is that the herd has broken up among the Hedge funds, today started to look a lot like the "Every man for himself" stampede that took AAPL from $700+ down -45% in seven months and you know we were warning on that, but when it breaks, it's too late, you needed to already be in place.
I told you about the triangles in the market, how retail technical traders would take them as bullish continuation patterns, but despite the attempted breakout and nearly unprecedented pulling of the short term manipulation levers, they couldn't do it-sellers are too aggressive. It's rare to see a head fake set up like today fail, VERY rare, it tends to only happen right before the bottom is about to fall out.
Lets look at charts as they tell the story better than I do.
First the SPY Triangle...
This is the "Bullish" (by technical trader's dogma) triangle in the SPY, almost every average had some variation of a triangle. The attempted breakout time (which a successful breakout with heavy distribution in to the move would have made the perfect downside reversal head fake as
we already had the signs of a head fake as explained here this morning) was EXACTLY 11:30.
Take a look at the manipulation in the SPY Arbitrage model at precisely the 11:30 area.
There it is, 11:30 and the levers (mostly HYG, a little VXX at the start) were pulled, I'll show you how they did in a bit as I wanted (as I said last night), to see how HYG reacted to upside as I also said, "HYG has enough gas in the tank for another move higher", whether they sell it like the earlier attempt this week was what I was expecting and waiting to see, I wasn't disappointed.
To give you an idea of the damage done today alone, take a look at the SPY 5 min 3C chart (the first institutional money timeframe), the leading negative aspect was exactly at 11:30 in the white box on price.
The very important 15 min chart as shown last night got even worse today, also leading negative (leading divergences are far stronger than relative divergences).
The SPY 30 min chart-it takes a lot to move these intraday, that divergence is at... GUESS WHAT TIME before it starts leading negative?
11:30 a.m.
The SPY/Yen inverse correlation identified and proven yesterday is working fine at the green arrow, in the red boxes today, even the Yen declining couldn't help the SPY on the upside as I noted in several market updates today, REMARKABLE.
How about the long term IWM 30 min... Look at the leading negative as well as the larger relative negative stretching across the chart,
the little red box is 11:30 a.m.
QQQ 15 min, leading negative and getting worse, the red box-11:30 a.m. where the SPY had so much trouble trying to breakout on what was probably a head fake move any way, it's just the sellers are every man for themselves so instead of play along and sell or short at better prices, they are of the mind that, "
Whoever sells first, sells best", these are real supply and demand dynamics that we haven't seen in the market since March of 2009.
How about the Index futures? (ES=SPX futures; NQ=NASDAQ 100 futures; TF=Russell 2000 futures).
It is VERY rare to see a 60 min negative divergence on futures charts, they just trade differently than equities, but...
ES and note where it has gone deeply leading negative on a chart that rarely shows these divergences-
it has been over the last couple of days ALONE!
The same with NQ is a devastatingly huge leading negative divergence
And TF is no different, the last divergence that popped up here sent TF lower, this is leading negative, significantly bigger and much faster forming.
As I said, price is deceptive, you don't know what's going on below the surface, most people don't even know HYG was used to try to send the market higher, instead it just held it up from a deeper move down, but when the stampede starts, it's over.
As I said last night, the market WILL front run the F_E_D and since Hilsenrath, the unofficial WSJ mouthpiece for the F_E_D broke the bad news after the close last Friday, I expected selling to be strong today, the divergences show it was.
With the F_E_D backing out of the picture, this is why the macro environment is going to start mattering more and more with stocks at these insane valuations, but
more immediately, as I said last night, the market is going to have a hard time ignoring both the Yen bottom ready to break to the upside as I wrote about in "Currency Crisis linked on the member's page and more immediately, the breakout in the $USD from a large base I have been watching form.
Yen 30 min leading positive divergence at a more than half complete rounding bottom...
60 min Yen positive divergence, the market has been trading opposite the Yen so a move up will not be good for the market.
This is more immediate as the market can't ignore this much longer.
The $USDX 1-day "W" base that has broken out after the pullback recently.
Money Stream (daily) is at a new leading positive high. Thew $USD is about to enter a Primary uptrend or Stage 2, mark-up and the market and most risk assets have an inverse relationship with the $USD.
As for AAPL, yesterday I told you it would bounce and last night based on light accumulation...
There's today's bounce to the right, but as I suspected and the reason why the bounce will make for a great shorting or put buying opportunity is because of the negative divergence on this 5 min chart, as soon as AAPL gained ground today, look what happened, sellers stepped in quietly distributing AAPL.
I think we may have a little more upside so we'll be looking for our entry/add-to position in AAPL likely tomorrow if the op-ex pin activity isn't too strong, which will be another interesting data point-does the op-ex pin hold or does the market deteriorate from the sellers?
A lot of people were scared to short GOOG on what I'm almost 100% certain is a head fake move-I called it before it happened so I feel confident.
Today GOOG put in a Dark Cloud Cover Reversal candlestick (bearish) and on volume.
The 5 min 3C chart shows the intense distribution on the head fake move.
IF YOU DON'T UNDERSTAND WHAT THE HEAD FAKE MOVE IS, WHY WE SEE THEM RIGHT BEFORE UPSIDE OR DOWNSIDE REVERSALS, WHY THEY ARE A GREAT TIMING TOOL AND WHY THEY ARE A GREAT ENTRY, PLEASE READ MY ARTICLES LINKED ON THE MEMBER'S SITE, "UNDERSTANDING THE HEAD FAKE MOVE".
As for some other charts...
I assume most of you know about these so I don't point them out, but Dr. Copper went from leading positive to in line to screaming negative. This is a reflection of the global economy which we saw today -think about the European GDPs.
Copper (red) vs the SPX (green)
Most people don't think to look at oil, but during QE2 and before, oil showed it was a risk asset, not so much anymore and another reflection of Global manufacturing and activity.
Finally the Baltic DRYS Index in ornage vs the SPX in green, this is the price quoted daily to ship dry goods on container ships, dry goods like trade merchandise, not oil, another indication of economic activity.
I just assume people know about these, but I had a member point them out and I didn't want to assume, I wanted to show.
Moving on...
Commodities as a risk asset, which they were, especially under QE2, they nearly drove manufacturing margins in to the ground, did not help the SPX at all today and longer term, they are severely dislocated from the SPX-EVERY RISK ASSET IS!
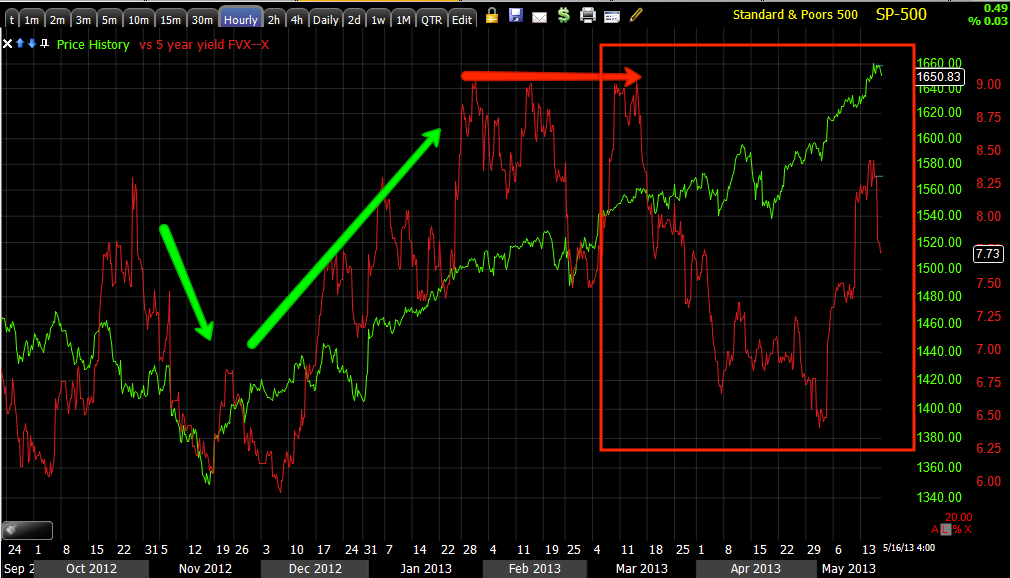
Yields-the Equity magnet fell hard today on TLT's major gains (Treasuries in general) as predicted yesterday. Stocks almost always revert to yields, keeping that in mind, look at the bigger picture...
Yields vs the SPX longer term, no more higher highs back in January, just a lot worse since-
What happened CNBC? Where's the great rotation out of bonds?
FX/Currencies
My formerly favorite currency as a leading indicator, the $AUD almost led the market lower today, longer term is where the big problem is...
FXA/$AUD-look at how it leads down vs the SPX!
The Euro was my favorite currency to confirm the SPX, it tried to help early today, but it too seemed to almost lead the market lower although we know there were much bigger reasons.
Longer term Euro vs SPX
I showed you the divergences in the Yen suggesting a strong rounding base, here it is vs the SPX, they tend to move opposite each other, but
again the more immediate story is...
The $USD; the market ignored it for a while, today seems to be (funny as it's the day after I said it can't afford to ignore the $USD much longer) the first time that the correlation hold, take a look,
nearly mirror opposite as it should be-now keep in mind the major $USD base that just broke out.
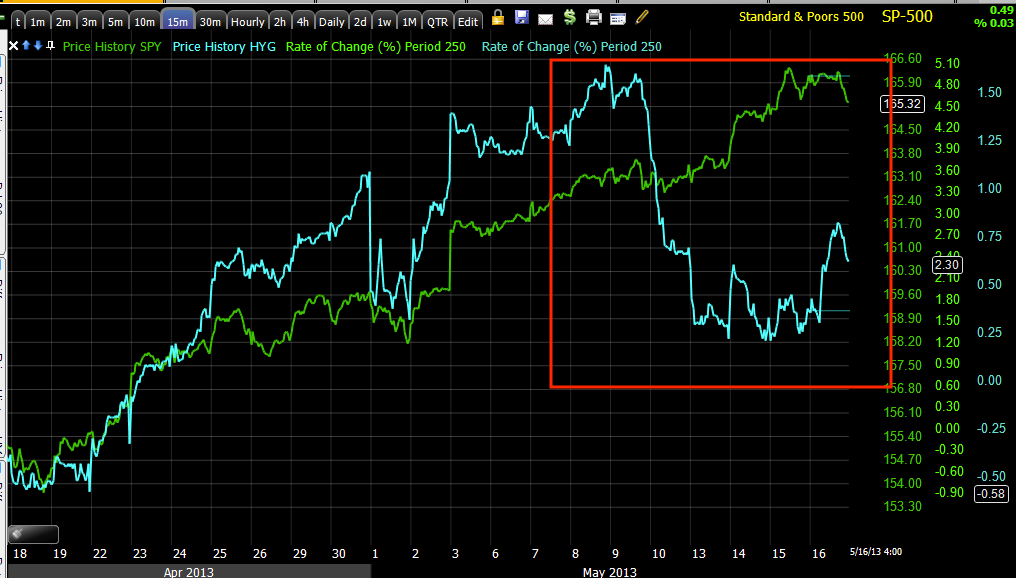
HYG (High Yield Credit-the institutional risk asset of choice) dislocated horribly from the SPX...
However as I suspected as I said last night, "HYG still has some short term gas in the tank for an upside move", this was one of the SPY arb. assets used to manipulate the market intraday, but even the near vertical run in HY credit couldn't get the job done, the breakout failed!
The positive divergence in HYG on this 5 min 3C chart is why I said HYG has more gas in the tank, but now this divergence is falling apart, but what happened intraday, did HYG get sold aggressively like earlier in the week as it lifted the SPX?
You don't get much more distribution than that, 3C went to a new lower low, no confirmation, not even strong distribution, incredibly strong distribution of HYG as suspected early this week before HYG even made its first move up.
Junk Credit (also High Yield Risk Asset) is dislocated from the SPX, remember the saying, "
Credit leads, stocks follow".
The VXX (VIX Futures) dipped a little at 11:30 as the SPY Arbitrage was used to try to help the market, but look what happened... VXX saw accumulation and then lifted off that accumulation as traders reached for protection rather than risk (rather than buying the SPX attempted breakout).
VXX 30 min long term shows what the trend has been, traders have been aggressively positioning for a big move up in the VIX and buying protection-why buy protection rather than short? Think of long only mutual funds.
XLK/Tech Sector today saw distribution in to a price move that appears to be a head fake move, the closing candle was a bearish
Shooting Star.
This is why I liked TECS (3x leveraged short Tech) today, the risk is low with the dip, the positive divergence shows the dip was accumulated, I want to be on the same boat as smart money and for a trend, I'd rather use a leveraged ETF than options.
Remember I told you Financials were under distribution-I like long FAZ, Here's more proof.
And more...
Tomorrow is the traditional op-ex pin, usually flat most of the day until late afternoon after most options have been closed, then we see a move. Tomorrow's price action will be key to seeing how deep this change of character (which leads to changes in trend) goes.
Tomorrow is light on US data, we do have a F_E_D speaker, Kocherlakota @ 1:45 p.m.
Right now in futures, the $USD is running, both the $AUD and Euro are retreating, the Yen is choppy and flat, that's to be expected in a rounding base. However the EUR/USD does look like it will try to make some upside, I can't say the same for the EUR/JPY carry or the other carry trade, AUD/JPY. I'd figure most carry positions are shut down by now any way.
Both 10 and 30 year treasuries appear to me as if they will pull back tomorrow, that is to be expected as few gaps are left open thanks to HFTs.
ES looks to be in line, NQ looks like it will see some overnight upside and TF looks to be under distribution- go figure! Actually it does make sense as the Hedge factory is fractured, the herd scattered so that would be possible as different players make moves in the light overnight volume of futures.
Breadth Indicators are on the decline again, massively dislocated since Feb. Also something to keep an eye on, the Black Swan Index, SKEW. It's not very high yet, but I have a good eye for rate of change in the SKEW and it's moving up quickly, closing at 121, the danger zone is $135, but any fast climb is troublesome, this is the CBOE indicator that tries to predict the probability of an improbable event, specifically a black swan market crash.
Until tomorrow...