Friday, December 20, 2013

VIX

The market is NEVER going to make it easy for you to make money, never and when it does, beware.

The point is, it's kind of like Vegas in reverse, you are the house not the gambler. The house always wins because they know what the probabilities are, they are going to have a lot of bad days, a lot of people win, but they know at the end they'll come out on top, they aren't going to close their doors because people hit the jackpot on the $20 one arm bandit 4 days in a row.

My point being, the only thing that can allow you to "sit" is knowing you have some edge, some greater probability on your side. I've met more traders than most, either from my free website, this one, from teaching Technical Analysis for nearly 4 years and a lot of other different places and I know for a fact that most traders are constantly chasing price, price leads them around by the nose and they say, "Price is king" or "Price pays", it does, but when you have such a narrow view of what "pays" is, you don't really understand how right you are and never will because in the long run, you won't be right.

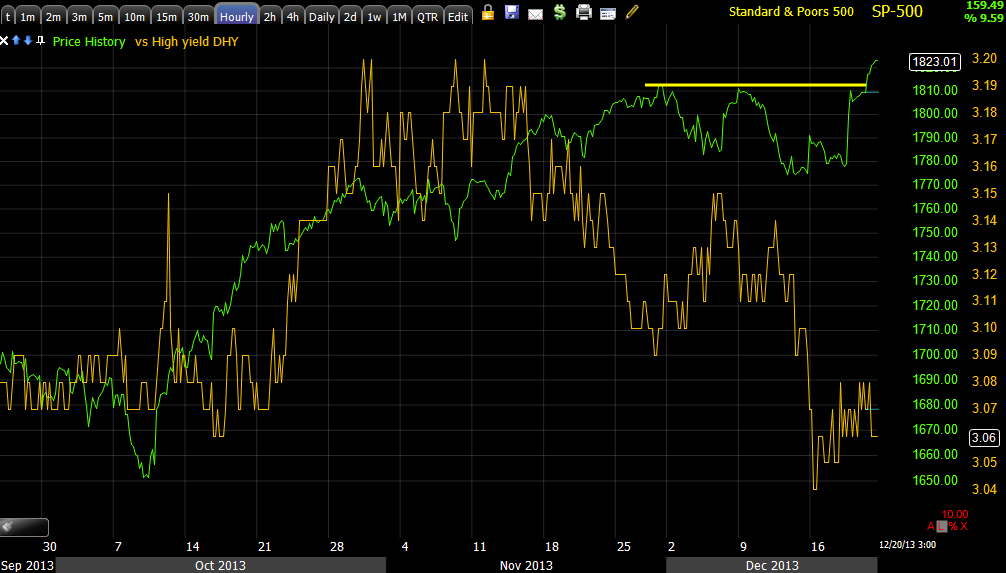
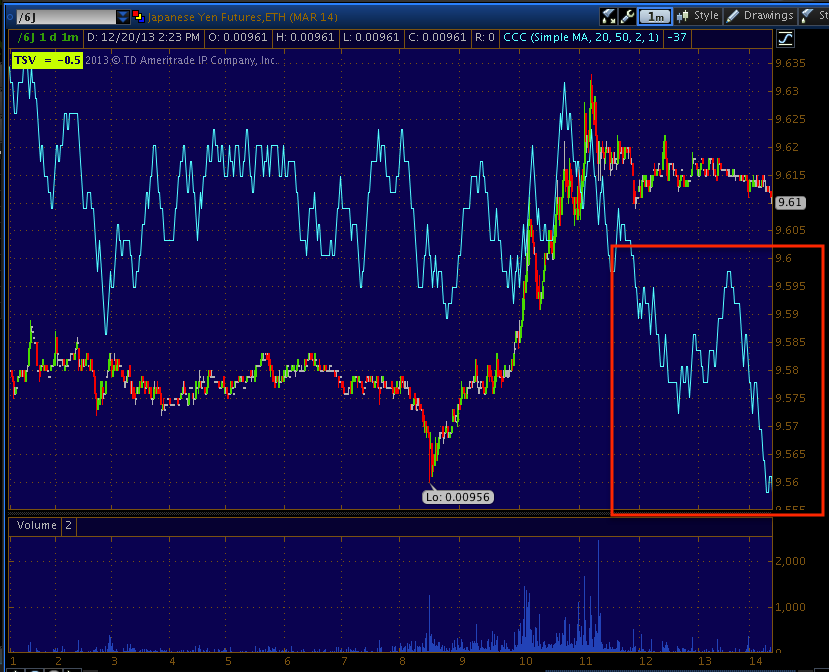
They do the same thing with trading systems, they bounce from one to another and if it's not working, they move to another or a new book comes out with a dozen cherry picked examples and they chase that, but they are always chasing, they rarely have the probabilities on their side because they don't have a true edge and most don't understand how the market works, for instance, why the Yen rallying is a bad news for the market right now.

If you don't know what your edge is, you don't have one.

I'm specifically talking about the VIX right now and I don't care if the VIX is down on Monday (although I doubt it), I care where the VIX is going. The Bollinger Band Squeeze in the VIX from mid-November gave us a very high probability clue as to where the VIX was going. The fact that the VIX wouldn't fall when the market rallied was another clue.

We just entered VXX calls about 2 hours ago right? I know our MCP calls are up over 20% right now as they rallied while the market sold-off in to the close.
 That's VXX in to the close, that's a really nice move, but think about the reason for that move.

This VIX 15 min futures has been accumulating since it was knocked down on the F_E_D / F_O_M_C knee-jerk move which I'm pretty darn well convinced was a knee-jerk with Quad Witching adding to the scenario. When you have accumulation like that, you know there's a probability, but when you know about the BB Squeeze in Spot VIX, that's an even higher probability, this is just confirmation.


The 4 hour (which I've never seen before) leading positive in VIX Futures really is the highest probability. So did we buy VXX on Wednesday afternoon or yesterday? No, we waited for the signals, we waited for the market behavior we have come to expect and we got in at just about the bottom.

Like I said at the top, the market will NEVER make it easy. I'd bet you 95% of traders who look at the 1929 crash through it's bottom would think that they'd have ridden that entire move short, but I'd be willing to be 95% of them would have been stopped out in the first two months when the first counter trend rally lifted the Dow nearly 50%, if they knew the probabilities, they could do as Jesse says and "Sit tight" without daily gyrations sending them in to emotional decisions, that's the nature of the beast.

You have to find objective (so you can trust them) probabilities and not be afraid to work them (like buying VXX at recent lows today).

I'll follow up later with whatever I find interesting, but we are really only 2 hours outside of the Quad Witching so there's not that much data, but you saw how fast 3C and then price fell apart.

Every one have a great weekend.

Look at VXX / UVXY

Can't wait to see the 2 hour gain on those VXX calls

AMZN Charts

It's amazing how fast this market is moving, I keep saying it, but the more I see, the more I'm convinced there was absolutely a leak of the December Taper. After the initial knee-jerk reaction I always want to let the dust clear and see what's what before moving, but with this Quad Witching, it seems like that's all they were waiting for and since there has been strong distribution signals in the second half of the afternoon as suspected.

These are AMZN charts, you know what they are.
 2 min intraday

5 min monster move

The 15 min has been in place

As has the 4 hour and

The daily, we just needed the short timeframes and a reasonable area, $400 was perfect

Opening AMZN Feb. $405 Puts

Nice area, nice action.

I'd consider this as a core short or add to area as well.

Still Waiting on PCLN

The target to open/add to PCLN short has been >$1200, with the range nearby this level has been standing out for well over a week, I haven't wanted to touch it with that level so obvious.

Today's tight range has seen some distribution, but I just can't imagine PCLN will see serious downside before that $1200+ area is hit, it's too juicy a target, there are too many reasons to hit it.

PATIENCE

Charts

Dow is looking interesting short as well. I like the IWM, the thing that's missing for me is the reversal process. This is ES, I've been waiting since we took profits on our longs on Wednesday after the F_O_M_C and just waiting for some signals to make some moves (being patient), today I have quite a few, I like to have at least a 5 min negative in Index futures, but the size and speed of a QQQ divergence pushed me over the line with the SQQQ long.

 Intraday SPX E-minis have seen almost pure distribution once they got to where they needed to be, before that 3C was inline as the SPX pushed to where it needed to be, after, well you see the distribution.

It's so strong it pushed right through to the 5 min chart which is my minimum.

 ES 5 min

QQQ is kid of similar, intraday distribution, but it's that 5 min signal I'm looking for to know the big boys are here.

Then almost out of the blue, the QQQ 5 min leading to a new negative low for the chart.

Trade Ideas: SQQQ Long

I'm adding a full size SQQQ long (3x short NDX) to the trading portfolio, that's about as many positions as I'm comfortable with, actually maybe even too many, but I really like this one.

I'll have some charts out in a minute.

Trade Ideas: SPXU long

Opening a half size SPXU (3x short SPX) long, if there's a better price Monday, I'd add the other half in the trading portfolio.

I'm considering filling out the FAZ 1/2 position in the trading portfolio, it's somewhat close in correlation to the SPZ with about 22% financials in the SPX, the only thing I'm waiting on in FAZ is for it to move a little more sideways and create a slightly rounder bottom than what's there now.


Went with VXX Jan $43 Calls

Trade Ideas: VXX / UVXY Long

I'm  going to open the UVXY long back up in the trading (equities only) portfolio and open a Feb Call position in VXX in the options tracking port. I'm not sure about the exact strike, but in the money calls.

Market Update & Leading Indicators

I have to get this out quick, I think you'll know what most of it is.
 Most importantly, SPY intraday and a little chimney.

 QQQ intraday.

And they did all of this with ZERO Arbitrage and ZERO Carry support, you'll see when you see HYG Credit and the Yen today, that tells you there was some brute force and it must have really been worth it, I imagine so with all 4 option types expiring, actually 5 if you want to count weeklies which cause pins on their own.

The VIX (spot) BB Squeeze now has a reasonable reversal process, it can move north from here with that process in place.

This is HYG Credit intraday! You'd think I inverted its price, CREDIT WANTS NOTHING TO DO WITH THIS QUAD EXPIRATION RUN, this is also why there's no SPY Arbitrage available to help.

This is credit (HYG) through the 5 week range, notice anything as the range progresses?

 I said way back then that the May 22nd Key 1-day reversal was a big deal, it will be studied in the history of this market as a key area where something changed. I think smart money was told about the taper because it was just after in June when we got the taper reaction with the 100 bp move in the 10-year yield.

Credit NEVER recovered, never went risk on with stocks and credit markets are a whole lot smarter than stock markets.

The area of most trouble I have been pointing out for a month or so was off the initial highs of the Oct 9 cycle, the run above those highs has been really ugly in all indicators, way off the charts from anything I've seen.

This High Yield Credit today, the risk on asset is not willing to take any risk with stocks, in fact the opposite,

Look at HY Credit during the range, similar to HYG, what does that tell you. The more I see, the more I think the big boys were alerted that December was D-Day.

Again HY credit around that May 22 Key Reversal day.

This is why the market is getting XERO carry support, as I published last night, the Yen positive divegrence  has kept the carry trades in the garage.

Look at the 15 min, this is what I published last night. For there to be a divergence this big and fat in the Yen, there was major buying or closing the carry trade, ironic the BAC comes out this morning and says they just closed the USD/JPY carry? That has to end with repurchasing or purchasing rather, the Yen, exactly what we see in the divergence above.

This also tells you a lot about the market if the leverage of carry is being shut down.

Sentiment from pro traders the last 2-days, they aren't willing to take the risk either.

This indicator has been leading, calling tops and bottoms and what is it doing now?

Take a longer look...

Sentiment...Uh-Oh...

Our other version, Recall the Oct 9 cycle and what I have called the worst looking area, the move above the cycle highs.

This is yields reversion to the mean, yields are no longer exerting any magnetic pull for the SPX.

QQQ / SQQQ Update

Just as I was capturing and notating the charts for this update, what I'm looking for may be starting to happen.
As I've shown numerous times, 3C signals on REGULAR hour charts (not futures unless they're 5 min or longer) tend to pick up right where they closed the next trading day whether it's the next day or over the weekend.

Also as we talk about every Friday, most option contracts are wrapped up by 2 p.m., this means price doesn't have to stay pinned at the optimal "Max Pain" level and it's free to do what it wants after 2-2:30 p.m. on Friday, however it's not price that I'm concerned with the last 2 hours, it's the 3C signals, those are what are most likely to pick up where they left off at today's close.

So I'm looking at a long SQQQ position for the trading portfolio (3x short QQQ), but as you'll see, I'm looking for 1 thing to happen and just as I started writing this, it looked like it might be starting, we'll see.


 The Q's have broken the closing high, they are just above the intraday high at $86.53, the volume is pretty poor, you should see the TICK, it's even worse. If I had the time I'd pull up my NDX breadth indicators, but I don't have time with everything else I'm watching.

Intraday this is the QQQ, what does that look like to you? A TEXTBOOK reversal PROCESS, as I'm adamant about, reversals are a process, not an event except in a parabolic move, but they still have some process to them and the process is almost always proportionate to the preceding move, this is beautiful, but what do I look for?

An Igloo shape with a Chimney on the right", the chimney is the last minute head fake move that is typically seen right before e reversal (that is proportionate too, a head fake on a 5 min chart reverses faster than one on a daily chart).

3C looks great here, the chimney and a continuing divegrence would give me a high probability, low cost, low risk entry in SQQQ.

This is SQQQ, note the same reversal process, although this is the inverse with 3x leverage, so the chimney would be a low just below the intraday low, the 2-4 p.m. timeframe is the perfect time to do that as there's no more need for a pin.

 There's migration in the divergence too, whether looking at the Q's, the 2 or 3 x leveraged ETFs , bull or bear.

And the minimum timeframe I look for to open a position, the 5 min which I consider to be the first that shows true institutional intraday action, so this leading negative is beautiful, the price pattern thus far is beautiful. I just need to set some alerts.

There are several other assets that look just like this.

For those looking at PCLN, remember >$1200 is the area, but there's a really flat range, I'm guessing that's its pin for op-ex max pain, keep an eye on that one too.

Trade Idea: QQQ Feb (22nd) $87 Puts

I'll be opening a full options position in Feb (monthly) $87 Puts right now.

Market Update

Again, it seems the market couldnn't be much more predictable, take the IWM, the asset with the most work to do, the Q's with the second most...

The gains for today, DIA +.33%, and it easily hit the range and crushed it.

QQQ which had the second most work to do, up +.79% and just broke the range

SPY which doesn't have much work to do at all, up only +.0.20%

The IWM with the nMOST work to do, the one asset most traders would have thought, "This isn't breaking the range", up +1.47%!!!

Either that's MAJOR market dispersion from +.20 to +1.47 or if you simply look at the charts, it's Quad Witching options expiration, what do you think? It's pretty easy to see from price alone.

Look at the IWM since crossing the range closing highs.
 IWM crosses the "CLOSING" range highs on very little volume considering the move, watch what happens to 3C that was "Rising in agony"...

We start to go negative, mission accomplished, it just needs to be held there until those contracts cry uncle and close out . Typically most traders watch the closing high, not the intraday high.

IWM 2 min was rising in agony, now the negative divegrence is migrating, it has a sharp leading negative AT THE EXACT SPOT WHERE IT CROSSES THE MAX-PAIN THRESHOLD!

YOU DON'T EVEN NEED 3C FOR THIS, YOU KUST NEED TO KNOW IT'S QUADRUPLE WITCHING (QUAD OPTIONS EXPIRATION)

Chart examples

If you need to, go back to the last post and look at the range for DIA and where price is right now and the range for the IWM and where price is right now and what I said about the DIA not needing to struggle and looking the worst on 3C and IWM looking the best, also the VXX action and HYG.

Again, the concept of 4-5 trading weeks of range and probabilities from a technical trader's view, "The trend is your friend", what is the trend over 5 trading weeks?

Thus, what trend are you going to play and where do you think max pain is on the last and largest Options expiration with Quadruple Witching today?

 As mentioned, VXX / UVXY were accumulated right on the open, but as they neared break-even, note the small negative divegrence on a 1 oin chart, yet it stays bid because the correlation isn't falling.

 2 min VXX, also accumulated on the open- THIS IS WHERE I SHOULD HAVE ADDED THE SECOND HALF OF THE POSITION, BUT I DON'T LIKE A.M. TRADE AND I WANT TO SEE WHAT THE MARKET LOOKS LIKE AFTER A.M. TRADE HAS PASSED.

However as far as large accumulation, this 15 min chart of UVXY is right at that level in which I'd consider it to be screaming, the kind of chart I DON'T ignore. Even with the distribution to steer VXX intraday, we've added more to the divergence today.

HYG on the other hand is seeing distribution.

2 min HYG so there's migration of the intraday divergence.

 As for High Yield Credit that has no Arbitrage correlation (red) vs the SPY (green)...
 It's dropping today, but this is nothing compared to what it has done while we've been in the range.

 This 60 min chart shows you what HY Credit has done while in the range, what do you make of Smart money's take on the market here?

"Credit leads, equities follow".

As I said earlier, my market update notes were clear, DIA 3C underlying trade looks the worst, IWM looks the best, that has to do with where each is relative to their range, the DIA has already kicked those contracts in to the "Expired worthless" bin, the IWM would have the largest payoff so I think they'll work hard to force IWM options to expire worthless.

DIA 1 min above, compare to IWM 1 min below, and I'm not saying IWM is strong in any way other than them working it today...

IWM 1 min

DIA 2 min

IWM 1 min, you can see 3C is rising in agony.

DIA 5 min, why not distribute/sell/sell short up here, mission accomplished for option expiration, but as far as the IWM's 5 min...

Again, rising, but in agony, there was a clear 3C down trend and they are pushing it with all they have today within reason to cause retail options to expire worthless and the ones they wrote to come in at a handsome profit.

For this reason, I expect the last hour of today to likely be very busy with positioning new positions.