Wednesday, December 21, 2011

The market picture as of 10:45 pm

 Here's ES, it was negatively divergent all day, in the evening session we have a new low on 3C -leading negative divergence.

Once again the Eur/USD has formed another bear pennant, look for an upside breakout / head fake and a likely test of $1.30. I doubt $1.30 will hold and one $1.30 breaks for real, there will be a lot of selling in the Euro, which will drag equities lower due to the legacy arbitrage correlation between the dollar (and Euro) and equities. Thus far the market is playing out with the bounce and the selling of the Euro on that bounce just as expected last week BEFORE the bounce even began!

Could dumb money be the new smart money?

Today the ICI released it's weekly mutual fund flow report. First lets understand that mutual funds are the home of dumb money, IRA's 401k's and just exposure to the market. Hedge Funds are where supposed smart money lives because they are accredited investors. Mutual funds have now seen 33 consecutive weeks of 34 of mutual fund outflows, meaning dumb money has finally realized that when the market goes down, nearly all long only (98% of Mutual funds) will lose money. This makes a cumulative total of $133 billion pulled this year after last week's 4 billion outflow. Dumb money seems to see where the market is headed and by their actions have created a self-fulfilling spiral of selling as hedge funds MUST sell portfolio holdings to meet the redemptions, so as the redemptions continue, so does the selling in the market, leaving the market at lofty valuations with very little or at least a lot less actual cash in the market to support these valuations.

It's no secret that hedge and mutual funds have badly underperformed this year, thus the high rate of redemptions as well as the trickery in the market, no one feels safe after MF Global's charade.

Just chalk this up to another negative for the market. The mutual fund money didn't flow out of the market during an epic crash, so it's not likely coming back and as for hedge funds, many of which counted sovereign wealth funds and foreign banks as their clientele is unlikely to see money return either as banks and sovereigns try to recapitalize. In other words, this isn't bullish sidelined cash waiting to jump back in the market, but cash that is gone most likely forever or at least for the foreseeable future.

RIMM Has an Unexplainably Good Day

You might attribute the weakness in the Q's today (-1.41%) to ORCL's disaster last night (-11.66%), XLK (technology sector) was down 1.53%. RIMM's sub-industry group (Diversified Communication Services) was up 2.48%, however there's only 36 components in the sub-industry group and of those 36 component stocks, only 8 closed up more the 1%, RIMM closing up the most at 10.06% (second place was PGI-a small cap that closed up 3.28%). The point being, RIMM was responsible for the gains in the sub-industry group, not the other way around, which also means there's no point in even looking at the Industry group or the market.

An explanation is necessary here; the most gravitational pull on any stock most any day of the year will be the market, the gains may be more or less then the market, but when the market is up, a majority of stocks are up. The second strongest force is the Industry group and then the sub-industry group, it's rotation of industry groups that determine which stocks outperform the market on an up day or which underperform on a down day.

The point being, none of the above pulled RIMM up today, it was RIMM itself.

So was it a dead cat bounce? NO, if RIMM was heading higher on a dead cat bounce it would have happened yesterday with market strength.

So what was it? Yahoo is running an article that AMZN, MSFT and NOK all considered buying out RIMM earlier in the year and that was what caused RIMM to move up today along with capitulation and short covering, but why would the shorts cover today rather then yesterday when the market was strong and they had a real reason to be afraid? And why was RIMM up last night in AH-AH short covering? I doubt it.
Can anyone truly say that this looks like short covering? Short covering looks like a steady diagonal line up with very few pullbacks and any pullbacks are extremely shallow, it looks nothing like this.

The one mystery in RIMM that is yet to be explained in found on 1 chart
A strong 15 min positive leading divergence.

Look at today's volume...

I don't know what is behind RIMM's strength today, I can tell you that the 3C chart above is the reason and only reason I've kept the RIMM long position open. I would usually think, dead cat bounce, but yesterday was the time for that, the volume is not right for that and the 15 min chart remains unexplained. I wouldn't be surprised if we are surprised by some unexpected news.

ES suggests a head fake as well

This is part and parcel of the manipulation of technical analysis, a breakout from resistance, the shorts cover, the longs enter and then the whole thing falls apart, this is why you have to watch for obvious patterns and obvious support / resistance levels, they are run so often that it is pretty predictable. In any case, here's what ES looks like...
 ES has been in a negative divergence all day...

Here's the recent breakout of intraday resistance, ES is going negative right after the b/o and volume picked up on the downside....

I'm sure we'll see some more flopping around the level, but again, it looks a lot like yesterday, pop the market and sell in to strength, clean up those hedge fund portfolios and raise cash for the tidal wave of redemptions coming at the end of the qrt.

JEF short trade follow up

Yesterday JEF went parabolic on earnings, which are a joke in financials as they sell liabilities or transfer them and raise liquidity right before earnings (the new window dressing) and then just add them right back after earnings. In any case, I mentioned a trade fading the move up in JEF, it was at a 7% or so profit since yesterday at $13.50 today and I would consider placing a trailing stop on the trade and letting it run a bit more.
 Here was the earnings based run up yesterday, which prompted the short trade idea (for a short term trade).

Here's the 5 min 3C on JEF which went negative yesterday and remains so today. Maybe I would consider taking profits or partial in case it tries to fill that gap, then put the trade back on, it depends on your risk tolerance.

Market Update

 SPY vs Euro (red) well even without Euro support and on no news the SPY has managed to take out that intraday resistance, which I would watch very carefully for a reversal (head fake). USO isn't moving much because the dollar is still holding as the Euro has weakened in the afternoon. This looks like a manipulative push to try to get some momentum trades chasing a intraday breakout, likely it will be sold like everything else has been since yesterday.


 I figured I'd take a look at transports and they have a nice parabolic move (those usually don't end well) and in to a negative divergence as well. This is a lot like yesterday at the end of the day.

 The Q's saw a positive divergence as they were down a lot very early so there's not much of a surprise there, I would watch the tech trades you may be interested in, AAPL for instance.

 XLF is doing the same thing it did yesterday which I warned about, the parabolic move off a mid day positive divergence, but it's already in a strong relative negative divergence, so as I said, it looks like Wall Street is selling this pop as well which is what I'd expect on any strength right up to the 27th.

XLK is pretty much in line with the NASDAQ positive divergence.

The Euro continues to offer no support, there's no news that I'm aware of so we pretty much know what this is, it didn't end well when the ran it yesterday, at least not for the QQQ.

Market Update

Earlier I suspected we'd get an intraday bounce, we have... it may be about to run out of steam.

 The SPY on this intraday chart has hit resistance several times, normally that wouldn't deter me from saying, watch out for a head fake above resistance, which could still happen, but....

 The Euro in red compared to the SPY in green is starting to fall apart.

And we have some initial signs on the 1 min 3C chart of the SPY that are looking a little bearish.

I'm going to check credit.

RIMM Update

I'm not sure what is going on with RIMM, but I'm still holding March Calls in the Options Model Portfolio and I'll show you why.

After we nailed the BBY earnings in a pre-release earnings call
BBY all in the white box, now down 18.5%

because of a negative divergence that suggested an earnings leak was out on the street...
Note the very small accumulation period, just enough to get BBY moving higher and then the flat trade with a 3 negative divergence that just got worse... This was the reason the BBY earnings short call was posted, I was asked to look at RIMM before earnings...

 Last night I mentioned RIMM was up in AH nearly 10% and said lets see what it doe during regular hours, and still up nearly 10%. I entered a long RIMM trade on the earnings call and RIMM beat, but guided lower, seemingly starting to take a play out of AAPL's book as AAPL always guides low and beats.

This was the chart that had me bullish on RIMM
A leading 15 min positive divergence... I assumed it was earnings related, apparently not, but that doesn't mean something else is not in the works.


 Here's short term accumulation in RIMM yesterday in a flat trading range which is typical of accumulation areas and today, RIMM is up and has confirmation.

 More impressively though is the 15 min chart since the RIMM earnings. The white arrow is RIMM as shown above right up to earnings and since RIMM dropped, the chart has moved even higher in a leading positive divergence, the only reason I held, I figured, ok, lets see what's going on here.

We had a great summer in RIMM, we had about 3-4 calls on RIMM and a theory of what it would do over several months, it did everything we expected. The downtrend since the summer has been in confirmation on the 60 min chart, but now we have our first positive divergence on this chart.

I'm not sure what is going on in RIMM, but it appears that the price weakness has been aggressively accumulated. So I'll stick with the trade unless something changes dramatically. As you know, 3C can show us the underlying smart money trade, but we don't know why until it's too late. In my eyes, something bullish is happening in the underlying trade. Interestingly RIMM didn't pop with the market yesterday, but it's up today on accumulation from yesterday, which means RIMM is doing its own thing instead of floating with the market as most stocks do. What is up to, IDK, but I'm going to stick around a bit longer.

All I want for Christmas is a Bloomberg Terminal

I take back everything good I've said about Briefing.com. They use to have all the inside information before it made its rounds, but since I've renewed my subscription, they are seriously falling behind. So, I need to start saving up for a Bloomberg terminal as these head lines are making the rounds everywhere EXEPT Breifing.com!

From Bloomberg (Terminal):


  • EFSF LENDING CAPACITY MAY DROP TO EU293 BLN, CULLINAN SAYS
  • EURO RESCUE FUND'S CAPACITY MAY FALL BY A THIRD, CULLINAN SAYS
  • EURO RESCUE FUND MAY SHRINK ON FRANCE DOWNGRADE, CULLINAN SAYS
  • S&P SOVEREIGN RATINGS DIRECTOR CULLINAN COMMENTS IN E-MAIL
The highlights in Red are the important part, being this email is from the S&P rating's agency and more specifically the director of Sovereign Ratings.

AH.... maybe Cullinan might be more careful about what is contained in emails because on the face, this looks like an S&P cut of France is a done deal.

USO Update

 USO hasn't been able to add anything to the earlier spike even though the Euro has been cooperative.


 Both the 2 and 5 min are negative here, I personally am taking a shot at a short term trade here on the short side, I already have long term short positions I am holding.

AAPL, I hope you were paying attention

In AAPL's update yesterday I said AAPL was close and I would consider a phased in Entry. However more importantly, this:

"On a daily chart, this is what the head fake would look like, a move above local resistance on a head fake and a failure, this is without a doubt the best set up for shorting/adding to AAPL."


And that is EXACTLY what happened in AAPL today.


 This is the local resistance and the head fake move and failure that was the best set up for an entry/add to, as a matter of fact, this is yesterday's chart that the above caption was under (below).

The head fake would be a move above local resistance at the green arrow and then back under at the red arrow, that's what happened today. Although AAPL is still only .59% down, it is still in a decent area for a short although I would prefer some intraday strength to short in to. Remember, AAPL was and is a candidate for a phased in entry as mentioned yesterday, figure out your risk management/position size using a stop level above the recent highs, then figure how many shares your risk management will allow at that size, maybe enter 1/3 now, 1/3 on any price strength and the final 1/3 on a confirmed break in the market, XLK and AAPL. For smaller accounts, the transaction costs may be prohibitive, but this s the same way Wall Street enters trades, but that is because of the size of the trades they are putting on. This is not dollar cost averaging, which is in response to a failed position, this is phasing in on a trade when you plan the entry BEFORE you ever enter, there's a big difference.


 The 2 min 3C chart is weak today, you can see distribution right at this a.m.'s head fake move at the yellow arrow.

 The 5 min hart is showing more distribution now then it was last week when I started an AAPL position in the model portfolio on a head fake break out of a triangle (at the green arrow). We have been expecting a bounce in AAPL since last week so I like the idea of adding and may very well add to that position if time allows.

The AAPL daily chart is ugly as well, clear distribution in the top formation and a current leading negative divergence.

Q's

Remember yesterday I showed two charts, one of XLF and one of XLK and XLK was looking a lot worse, I said, "I'd be using today to look for tech shorts".

Then last night ORCL missed and the Q's were trading down in AH.

Now look at the Q's.

On the daily chart, the QQQ kiss the triangle top goodbye. Today they make a 2.43% move down.


 Here's the intraday chart, nasty looking thus far.

 Here's the distribution in 3C late yesterday near the top and currently in line on the downside move.

 The hourly QQQ chart has been very weak and this is another one of the reasons I've held all the shorts in the model portfolio.  There was the October positive divergence starting the rally, but distribution in to the top and remember, a top is a process, not an event. The recent bounce hasn't moved the 60 min chart at all, it remained leading negative throughout, another reason I felt okay adding shorts to the model portfolio in to the bounce.

 Here's the weakness on a 2 min chart I mentioned in XLK (Technology) yesterday.

The 5 min chart showed the start of accumulation at the start of the bounce, but as expected, distribution set in fast.

We may see an intraday bounce, I''d consider taking advantage of it if it comes.

AMZN Trade Idea Follow Up

AMZN was a short trade idea that recently broke a major top, we almost always see a bounce and shakeout after a major break like that and we were looking to add or initiate short in AMZN on any strength. Yesterday AMZN severely underperformed. If you didn't get in, I wouldn't be too worried, there's a chance for an intraday bounce and beyond that, there's a lot of downside.

 Here''s AMZN's top, the recent dip below the neck line support and a small bounce from there where AMZN could be shorted for a better entry. Today AMZN is down -3.38%, but this is just getting started. The pattern implied target for AMZN is around $100, of course that will take some time and often these downside targets are overshot.

 Here's the bounce off the break of support, note AMZN performed horribly yesterday. Right now it is at the neck line support so an intraday bounce from here wouldn't be surprising and I would consider using any price strength to initiate or add to the short there.

 Look at the negative divergence yesterday on the market's end of day parabolic spike, I warned these usually don't end well. Right now 3C is confirming the downtrend intraday.

 The 2 min chart also suggests an intraday bounce is possible here, although AMZN is very weak and a break through support on volume would be another trigger to consider entering a short position.

 The 5 min chart has shown distribution throughout the entire bounce and is leading negative, so this gives me some security in shorting AMZN on any price strength as the 5 min chart looks bad.

 However the really bad looking hart is the daily, which clearly showed us distribution in to the top and is now n a very nasty leading negative divergence.

Since the recent October top, the Trend Channel on a daily chart has held the entire downtrend including the recent counter trend bounce. The current stop is at the $190 area on a close.

Credit/Risk Indications

For newer members we watch the credit markets which are much bigger then the equity markets and tend to lead equities, where credit goes, equities tend to follow. We also watch other risk assets as a risk on rally in equities should have broad support from the credit markets and risk assets like commodities, when there is a dislocation (for instance the S&P rallies, but credit and risk assets don't participate, we have a good idea that the rally will fail and that is a dislocation, often a good area to short in to strength or buy in to weakness as it works both ways).

 Here are commodities vs the S&P-500 this morning (the comparison symbol S&P-500 will always be green on these charts). Commodities were in line with the market until the 10:30 EIA report when Crude spiked, there is a slightly bullish intraday dislocation as commodities are showing better relative performance, this may signal a bounce, but the moves in crude/USO will have a lot of influence on this chart.

 For a longer term perspective (dates are at the bottom of the chart) you can see 1 bearish dislocation to the left in the red box as commodities, a risk asset, didn't follow the S&P-500 higher, shortly after that the S&P corrected to the downside. In the most recent bounce commodities have severely underperformed leaving a severe dislocation. Part of the reason for commodity weakness (which we speculated about well over a month ago and before confirmation) is weakness in China, a few weeks later we got confirmation in both China's services and manufacturing PMI, both which came in below 50 which signals contraction, thus commodity weakness and our affinity for several commodity oriented shorts including VALE. The S&P should revert to the mean and move lower as you can see, it usually does on these dislocations.

 This is commodities vs the Euro in green, note that they were tracking well as they should until the 10:30 inventories report.

 This is High Yield Credit vs the S&P and yesterday we noted a sell-off in High Yield which was a hint that the LTRO may not go so well today, thus far today, HYC is pretty much in line.

 Here you can see a little longer perspective in which the S&P bounces, but High Yield Credit is selling off, this is bearish for the market.

 Rates are a bit higher in the early going, again suggesting a possible intraday bounce.

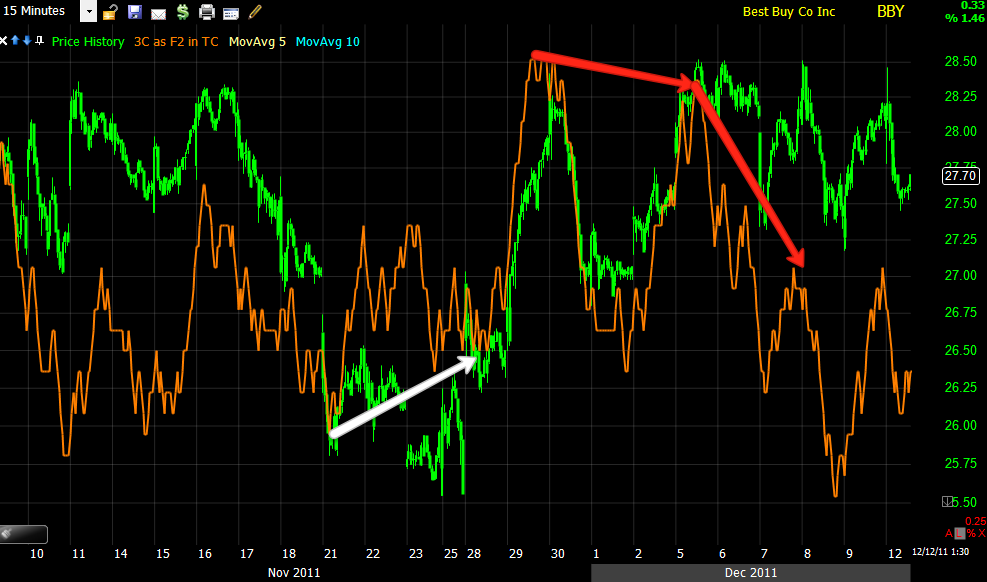
 Longer term equities/stocks are attracted to rates like a magnet, you can see in the white box that rates were bullish while the S&P was still tracking lower, this was a hint that a rally was coming, then the first dislocation in red sent the S&P down in a sharp move, currently there is another dislocation.

 The market this a.m. is tracking the Euro pretty well, there's a pretty strong correlation between the two.

 Over the last day and a half, the Euro has underperformed the S&P.

 However longer term there is a severe bearish dislocation between the Euro and the S&P. Each EUR/USD has a rough correlation of 2 Dow-30 points, so there's quite a bit of potential downside here.

 High Yield Corporate is in line with the S&P this morning.

 This is financial Industry momentum vs the S&P, over the last few days you can see at the white arrows where momentum in financials picked up and preceded a move higher in the S&P. Also at the red arrow you can see financial momentum started failing and preceded a move lower in the S&P. Right now there's a slightly positive bias.

Longer term financial momentum was in line with the S&P at the start of the October rally, near the top, there was a bearish dislocation and shortly after a sharp move down in the S&P, right now Financials are still dislocated and underperforming the S&P.