Tuesday, December 31, 2013

Oops Was that a late day smack down?

NYSE TICK -1000

Last Market Update of the Year

And why not end it with the same garbage they've been pulling all year, except in this case, on this kind of volume, this is REALLY pathetic, no wonder VIX futures are being accumulated so heavily.

So the last update I said "I think I thought I saw and End of Day ramp coming..."

That was based on the VXX intraday action which now looks like this.
intraday negative at the afternoon session

However, they got fancy  or desperate and threw HYG in there too.
 HYG recent positive

Which creates an arbitrage for about the only traders still operating, non-carbon based...
Allowing the SPY to do this, even though it's leading negative in to the afternoon.

I'm seeing TICK pick up a bit, but it has been super thin as you'd expect.

Index futures broadly have all deteriorated whether that be 1 min or 5 min charts today. Speaking of which, I see ES just made the afternoon ramp high.

Sentiment is BROADLY down. VXX is easily outperforming the SPX correlation and High Yield Credit, well it could care less what the market does this afternoon, it's not going along for the ride. In fact, the last several days it's been headed in the opposite direction and that's just several days, larger scale it is very dislocated from the SPX.

Guess what, none of the carry pairs are moving the market either, not the EUR/JPY, USD/JPY or AUD/JPY.


In fact everything you need to know about the late afternoon ramp can be found on these two charts.
 1 min manipulation

5 min accumulation.

Even Spot VIX looks to close green, all I can say is FARCE and Happy New Year!

I'll likely have something on internals before Thursday's open, although it likely won't be worth much.

Market Update

It's hard to tell if there's some tax selling here or what with volume so low. I feel the FAZ/SPXU longs today were timed pretty well, but intraday VXX I see a few things that makes me think they'll try to ramp the close or at least try to protect it from a red close.

A lot of charts are now looking really bad, especially in Industry groups such as Tech and Financials so I'm glad to see that.

However there is a clear intraday 1 min negative in VXX and VIX futures, this hasn't changed the 5 min which are stronger than when I posted them early, a nice clean leading positive divergence in VIX futures so the last hour of the year looks like if they get anything positive, it's just by gaming the system, but there's definitive demand for protection in to the new year, perhaps they fear for when volume picks back up and managers can unwind window dressing?

XLF Charts

There was some strange activity in VIX futures, as I showed earlier, the 5 min VIX futures BEVER went negative so I think yesterday/today was a pin, but suddenly today it's as if a large order moved right through several levels of the ask stack which is not surprising because despite the pinning of price, accumulation has still been evident.

Why buy VIX futures to protect gains with less than 2 hours left to the 2013 trading year?

In any case, there's more than just that, but I just didn't see reason to wait any longer on filling out FAZ (3x short Financials) as it was a 1/2 size position which was purposefully phased in to so the second half could be added if we got better prices which I suspected because of the shape of price and the lack of a "Chimney".

Take a look at the charts here though in XLF, it's one of those times that it's not a chart or a few charts that I just can't ignore, it's a cluster.

 Intraday 1min

2 min

10 min

15 min

30 min

How can I ignore that?

MCP follow Up / P/L

Here's the P/L for the closed out portion of MCP, with that base breakout it's very hard to close the entire position so you (I) make compromises.


At a fill of $5.55 the gain came out to just above +17.10% and 2200 of the 4200 were closed out.

There are several short term charts similar to this 3 min, not a big deal as far as the trend is concerned.

Trade Management : MCP

I LOVE, love, love, love MCP long, but I think there's a decent probability of a gap fill so I'm cutting MCP back to a half size trading position from a full size.

For Core MCP longs (trend trades), I'd leave it alone, I think it will be fine and there's no reason to try to cut too much around the bone, but for a trading portfolio, I'd rather protect some gains, still have some exposure and have a chance to add shares back at a lower cost basis.

DGAZ Update

It feels like we just talked about DGAZ/UNG, oh, of course, we did yesterday.

In yesterday's post I shoed a significant long term or large negative divegrence in Nat Gas futures so the pullback in UNG is likely to be more than our average pullback and DGAZ is up between 10.50 and 11% today.

I think there will probably be some chop still in the area before a real clean break, but whether there is or not, it doesn't change my plans for DGAZ (long) one bit. I won't close DGAZ until I see UNG is putting together a base and accumulation and it is really just starting a mini stage 4 so it's no where near that eventuality yet.

Lets take a look because I know a lot of you have stuck in there with DGAZ, take a look at the Nat Gas charts posted yesterday linked above and these below from today, I think you'll feel pretty good about having held tight to DGAZ.

 DGAZ's volume doesn't stand out, but it's the things that others don't notice that give you the greatest edge, true volume is not 4x average for the last 10-days, but it is increasing on the up days, that's all we need and the reversal process can be seen clearly.


This is sloppy inverse H&S mentioned yesterday, I think there may be some backing and filling of some of the holes, but it doesn't change management of the position at all for me, the long DGAZ stays open.

Here DGAZ is in line/confirmation on the move up today.

To give you an idea of the expected UNG pullback, this is a 60 min chart, be sure to see the Natural Gas futures I posted yesterday, it should be a strong pullback and DGAZ should do very well.

The 30 min chart, note both were in line and then went negative

The X-Over system applied to UNG, the first pullback is to the 10-day, second is usually to the 22 day, but in this case I think we move closer to the breakout area.

I drew a squiggle that represents (yellow) the probable filling of some holes, but ultimately if you place the candlesticks I drew under price just under today's, this is the general trend I'd expect and likely wouldn't close DGAZ until we wee momentum fade, the reversal process start and accumulation confirm it and I think it will be around the red trendline, maybe even a head fake below it.

Good luck!

Trade Ideas: SPXU & FAZ

I'm going to fill out both the SPXU and FAZ trading positions which are both long and both at half size, they will be brought up to full size. VIX futures are getting very interesting.

All Index Futures Are Leading Negative

Intraday charts of course, but a big change from just ES, now TF and NQ have joined.

I'll wrap up the AAPL long, not because I feel a strong urge because of AAPL alone, but it was never intended to be more than a very short duration hedge, which it has served as.

Gold Update

 few of you have written about the move in GLD this morning, so far from what I see, my impression is something pushed gold up in an unnatural way, perhaps a short squeeze, but it doesn't look or feel natural and I don't have very strong intraday signals. In fact I think it's more likely GLD comes down a bit intraday. I do think the $114.50-$117.50 area is an important basing area, it doesn't need to be much bigger, but that is my initial feel and I think gold will likely take off to the upside just about the same time the market turns to the downside.

Flight to safety trade? Who knows, but GLD's (red) inverse performance vs the SPX/SPY is quite clear, so it was one of the assets I talked about Sunday night in that it is another Bellwether for the market.

AAPL trade management

Here are the charts for AAPL, there's deterioration setting in, it's a tough call here because I feel it's a bit early, so I'll be keeping a close eye on it as it is a market Bellwether.

 AAPL intraday, I would have NEVER gone long AAPL if it looked like this yesterday so staying long becomes a question.

At the next timeframe AAPL is nearly in line which is a loss of momentum, at 3 min it still has some positives so I'd like to see a more mature signal, still price is bending, I'm going to try to be patient as to keep an effective hedge in place.

This is the 5 min Trend Channel, it's tight, but if you are trying to keep as much as possible , this is decent.


I feel more comfortable with a wider 10 min at $559.50, this allows some room for consolidation.

Market Update

So this is what was expected Sunday on a more condensed timeframe (Monday), I still have the same expectations, just a wider timeframe, I'll probably be able to give you an idea once I see a some more signals, movement is important because it tells us so much about the health of a move or where a set up can be found.

Luckily the AAPL hedge opened yesterday )up +1.16% today) with the MCP gain of 4.09% today has been more than enough to hedge the trading shorts and has pushed the trading portfolio up to a +20% gain for December and this is without the current positions even having moved yet, I just needed to hedge them for a day or so. I'm looking at a possible AAPL Trend Channel stop of $560.30, it depends more on 3C, but the initial momentum is starting to roll over while I don't want to jump the gun on an asset that is so important to the NDX, I also don't want to lose the hedge value.

This apparently seems to be a "Hold the year's gains" move as many a hedge fund manager's job depends on it as they are already coming in on average at 6% on the year, well below the SPX and they are charging 2 and 20 at minimum for such dismal performance.

The charts... First it seemed obvious via the VIX pin yesterday and the attempt to awaken HYG that there was going to be some SPY Arbitrage, which is not showing up on the model, but with TLT and VXX both down and HYG up, it's the perfect arbitrage so whether the model sees it or not, the algos will read it.

 ES intraday as you can see doesn't look so good, TF and NQ look better, but this is definitely worth keeping an eye on especially if SPY starts to deteriorate as badly. Volume looks dismal.

 While the averages are still holding enough of yesterday's divergence that I'm not ready to place or fill out the SPXU and FAZ positions, I do see some signs as I was hoping to see Sunday night in to some movement like this IWM chart (intraday) going from yesterday's divergence to a small negative, it has to start somewhere.

The QQQ shows the same positive yesterday and some weakness forming in intraday charts as well.

The divergence from yesterday is much more clear now in the SPY, but was obvious yesterday if you know what to look for, this 2 min chart has moved to an inline status with the gap up.

The 1 min is where the first divergences will start and there's some evidence on the SPY of that happening.

VXX as shown yesterday being pinned, the red trendline is yesterday's close.

VIX futures however on a 5 min chart have really no damage at all, I suspect they are still bid for protection and at this point it can't be for year end protection.

And HYG as mentioned yesterday on a 1 min chart did move higher but this is a weak divergence.


The plan is still the same, gather information on the movement, look for the weakness and an area to pounce.

Good Morning

There are quite a few things going on this morning including the market moving up overnight, I don't think the "reason" or mechanism is important, we saw it yesterday, predicted it Sunday night,  hence the AAPL long hedge for the trading portfolio. I don't find this very interesting, I find it "as expected", but don't forget the second half of Sunday night's expectations, using the movement to gather information (what was originally the first half of the day) and then acting on it (likely short entries / add-tos) the second half of the day, only the timeframe was stretched from the first half of the day to the first day.

Today is the last trading day of the year so there are a dozen different reasons for this move or it may be as simple as market jiggles, for instance as I have posted before, even in a full-blown bear market, there are just about as many up days as down days, the down days just tend to be much larger or at least one of three will be much larger. This is why we look at historical markets. put ourselves in the emotional moment and get to understand what is normal and what is not, I call it "Anchoring expectations".

Now, on to some of the interesting stuff. The Egyptian government outlawed and branded the democratically elected former ruling party, the Muslim Brotherhood and branded them a terrorist organization. You may recall our analysis as the Arab Spring moved from Tunisia to Egypt and Mubarak was disposed of. Way back then it was pointed out how the protestors of Mubarak had no fear of the Egyptian military in and around the square, they more greeted them as protectors and liberators and ultimately just who was it that removed Mubarak from power? The Egyptian military.

All the way back then as we covered the Arab Spring as it related to the markets, especially energy as the Suez Canal is one of the most important choke holds in the world for the free flow of oil.

Our analysis and what later turned out to be historical fact was that the Arab Spring which saw Hamas moving in to Egypt via the Sinai Peninsula to organize the Muslim Brotherhood so they could step up as a political force once Mubarak was removed was likely going to bear fruit, but not long lasting by any means.

You may recall that I had said, "It won't be the people who remove Hosni Mubarak, it will be the military", in fact the Arab Spring was perfect cover for the military who already had made plans to dispose of Mubarak. Do you remember why? It is the very political power structure of Egypt ever since Nasser, the same political power structure that put Mubarak in to power that he dared to cross. The real and only political power in Egypt (and Egyptians got a taste of this only after Mubarak was removed) is the Egyptian Military. It is the military who decides who is placed in to power and every leader since Nasser has been put in to power by the military and has come from within the military's own ranks. Mubarak for his part served in the Egyptian Air Force and was a prominent leader as Chief Air Marshal. 

While I'm not going to get in to the assassination of Anwar Sadat which is widely believed to be organized by an offshoot of the Muslim Brotherhood, the one fact that we do know for sure was he was assassinated at a military parade by four military officers; I do think it's important to note that Sadat was initially seen as a figure head puppet very close to Nasser, Sadat surprised many and we know his end and who stood to inherit the Presidency, Mubarak.

Perhaps Mubarak forgot who really controls power in Egypt after one ot its longest serving presidents of nearly 30 years as he snubbed the military and groomed his own son Gamal to slide in to the presidency. I think there's little doubt the Arab Spring was perfect cover for the Egyptian Military to remove Mubarak for this very reason.

After his removal, the Egyptian military broke promises regarding democratic elections as I expected and they were eventually forced to maintain the facade which opened the door to the Muslim Brotherhood's Morsi. At the time I had said, I didn't know how, but Morsi wouldn't be around long, the Military controls Egypt.

So it should be no surprise that the Military Council that now governs Egypt has moved in to squash the Muslim Brotherhood's fairly long history and political ambitions as this was released by Reuters:

Egypt Declares Muslim Brotherhood a Terrorist Group

I think this is interesting as it comes right about the time we have called for a rise in oil after a fairly long base has been put in place.

Here's an excerpt:


“The Egyptian government intensified its crackdown on the Muslim Brotherhood on Wednesday, formally listing the group as a terrorist organization after accusing it of carrying out a suicide bomb attack on a police station that killed 16 people. The move marked a major escalation in the army-backed government's campaign to suppress the Islamist movement that propelled Mohamed Mursi to the presidency 18 months ago but has been driven underground since the army toppled him in July. It gives the authorities the power to charge any member of the Brotherhood with belonging to a terrorist group, as well as anyone who finances the group or promotes it "verbally, or in writing".

"This is a turning point in the confrontation. This is an important tool for the government to close any door in the face of the Brotherhood's return to political life," said Khalil al-Anani, a Washington-based expert on the movement. The Brotherhood condemned the attack on Tuesday in the Nile Delta city of Mansoura, north of Cairo. Earlier on Wednesday, a Sinai-based militant group, Ansar Bayt al-Maqdis, had claimed responsibility for the attack that wounded some 140 people.

In Washington, the State Department also condemned the attack but urged Egypt to have an "inclusive political process." "We condemn in the strongest terms the horrific, terrorist bombing yesterday. There can be no place for such violence. The Egyptian people deserve peace and calm," State Department spokeswoman Jen Psaki said but added: "We also note that the Muslim Brotherhood in Egypt condemned the bombing shortly after it occurred yesterday. We are concerned about the current atmosphere and its potential effects on a democratic transition in Egypt," she added.

The Brotherhood, which estimates its membership at up to a million people, was Egypt's best organized political force until this summer's crackdown. A political and social movement founded in 1928, it won five elections after the downfall of President Hosni Mubarak in 2011.

"The government decision aims to liquidate its political opponents," Mohamed Touson, a member of the Brotherhood's Freedom and Justice Party, told Al-Ahram online, a state-run news portal. Since Mursi's overthrow, the state has killed hundreds of his supporters in the streets and arrested thousands more. Mursi and other top Brotherhood leaders were last week charged with terrorism and plotting with foreign militants against Egypt. They could face the death penalty. A court ruling has also formally outlawed the group.”

The key take-aways are: Who delcared the Muslim Brotherhood a terrorist organization which was the Military care-taker government. What the penalties are which are a minimum 5 years in prison (which in Egypt may as well be a death sentence) and for the group's leaders, an actual death sentence and this includes anyone who supports the Brotherhood, even in writing. It's clear the Egyptian government is once again suppressing political rivals, dealing with the long term thorn in their political side, the Muslim Brotherhood and doing so based on an attack that Ansar Bayt al-Maqdis claimed responsibility for and the Muslim Brotherhood condemned, even though the group is thought to have loose ties to the MB.

I'd be keeping an eye on activities around the Suez over the next several months and of course oil prices.

USO which is tied to WTI crude (and not as acutely sensitive to the situation) has gapped down this morning in what has turned out to be a nearly month long consolidation.

Light Sweet Crude looks like it has more to pullback, although some of the faster 3C timeframes are going positive pretty quickly.

Today USO has shown a strong 5 min positive divergence in to the gap down, I'm keeping a close eye on it as I'd like to have a position there, if some other timeframes join the 5 min in the intensity of the divergence I'd look at opening a position there as USO has done a lot of basing work.

USO 5 min with near perfect confirmation except at the gap down, a very strong leading positive divegrence, I have to wonder if this is a shakeout. If the possibility of an escalation in Egypt were possible (after all there are about a million MB supporters in the country and clear ties to Hamas), I'd sure like to knock oil down and pick it up on the cheap.

One of the issues I thought we really ought to be paying attention to is the ongoing liquidity crunch in China. As noted Wednesday seasonally liquidity needs among banks rise to meet legal requirements at year end, but the liquidity crunch is already greater than any historical seasonal jump.

As you may recall, the PBoC conducts liquidity injecting Reverse Repos regularly scheduled for Tuesday and Thursday, there's been a lot of volatility in the interbank and money markets recently as you know we have been following. Today the Central Bank (PBoC) DID NOT conduct a reverse repo and the 7-day repo rate that banks use jumped 157 basis points to 6.5% almost instantly (it was less than 5% yesterday). It's quite clear that China's liquidity crunch is more than seasonal and this is important because it's this same locking up of interbank liquidity that made the 2008 Lehman era much worse as banks refused to lend to each other on an overnight basis as no one knew at the time which counter-party had what exposure to subprime. Although this is a different situation, the effect is the same, if the liquidity and credit markets freeze or lock up in China as they did in the US circa 2008, look out as the world's marginal driver of economic growth may be facing much bigger problems than lower than expected yearly growth.

FXP/FXI are two assets to keep an eye on. I'd like to see FXP fall a bit more and as long as we can identify accumulation in the ETF, I think it may make for a decent longer term long play on the Chinese liquidity situation.

There are a few other items I'd like to cover such as Consumer Confidence, Chicago PMI and Case-Shiller, but I think now that a.m. trade is burning off and some interesting signals are developing, it's time to take a closer look at the market and assets we have in place and those we may wish to add to.

A Market Update will be out shortly.


Monday, December 30, 2013

Daily Wrap

Today was an odd-ball day, but much of what we were looking for last night, did happen.

SPX futures saw the narrowest trading range for the day in 6 and a half years, the range was 5 points high to low and 1 point open to close during regular hours. As expected, volume was super thin.

Also as expected, Treasuries did rally, 10 and 30 year, but I can't get a good feel on whether there's a trend there or not, it seems a bit noisy.


Gold pulled back to fill the gap from 12/26 and then some, volume was higher, but there was no bullish reversal candle, just a narrow daily range. I think it's too soon to consider Gold a buy, which means perhaps tomorrow we see accumulation and a reversal candle, but that's a best guess.

I showed several times how there was an effort to Pin short term VIX futures, but I also showed that there was accumulation in VIX futures, this led to an attempt that may have slowed VIX futures, but traders were obviously seeking protection and the hammer support candle from last Thursday at the bottom of the Bollinger Bands of spot VIX, HELD and acted as they should which puts the VIX BB squeeze back in play, remember the market moves opposite the VIX for the most part.

VIX's reversal Hammer held and protection was bid despite an effort right in to the close to slow or pin VIX futures.

Based on some other things seen today and VXX, my best guess is that we get a bounce attempt tomorrow, this is essentially the exact same thing I was looking for last night, except the schedule has been stretched so rather than have a bounce the first half of today and a probable short opportunity the second half, it looks to be the same idea, just stretched over what may be 1 day (completed tomorrow) or two days (completed Thursday).

As expected, most carry pairs today continue to lose their correlation to ES.

Leading Indicators show sentiment indicators turned south, VXX was outperforming the SPX correlation handily, Yields are starting (thanks to T buying today as expected last night) to diverge negatively and they lead the market quite well.

High Yield Credit which has no arbitrage correlation to the market also sold off today as it's definitely institutional risk off in larger markets.

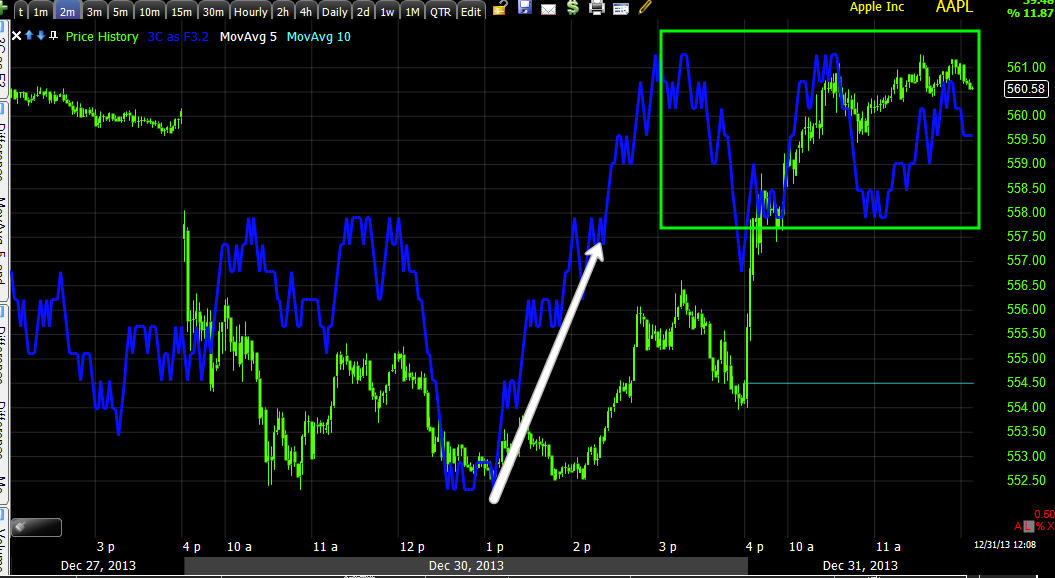
All in all, I can't say that I'd change my views of what I expected in last night's post except the time horizon. I added AAPL as a long hedge for a short duration move to the upside, but did so with a very nervous hand, this was the best looking asset I could find and it wasn't great looking by a long shot, in fact AAPL will likely bounce right in to a short sale opening.

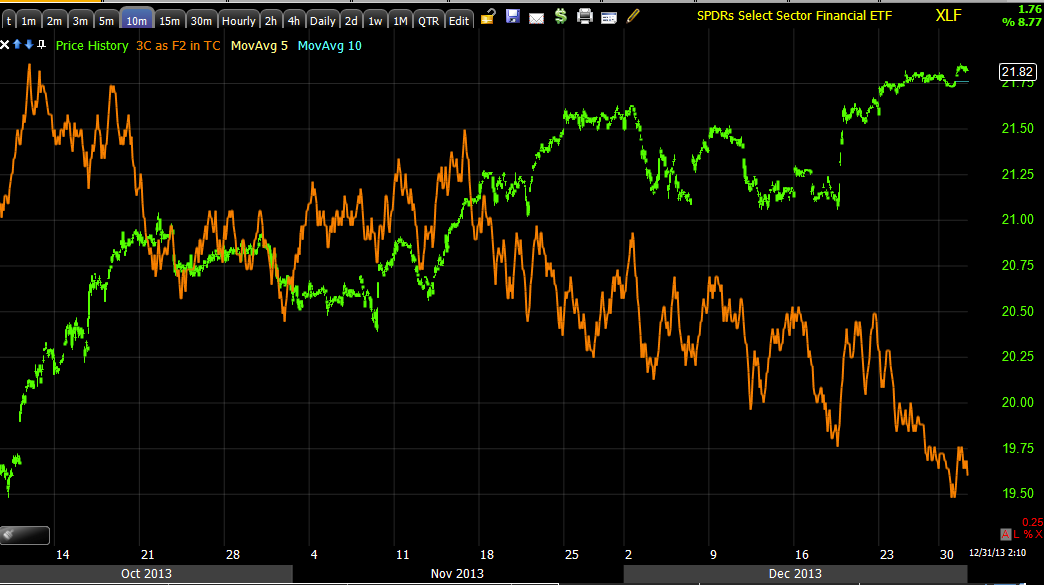
The major averages were able to hold on to the intraday positive divergences, however as posted earlier today, all of them are intraday positives within larger leading negative, I showed one intraday of XLF and then showed it in the trend and you could barely make out the intraday positive as the leading negative trend was so much bigger. Usually when I see these, they are bounces on a short term (I'd call it intraday, give or take) and then they resume the leading negative distribution and price follows the stronger negative divegrence, again, this could be and most probably is to finish the year strong as many funds are counting on it.

With such low volume though, I was truly surprised that the market couldn't put together a strong move or even an end of day ramp, the IWM actually fell near the close, but again managed to hand on to the intraday positive.

As was obvious, I had a lot of difficulty finding anything to use as a shirt term hedge for the short positions already in place and they look infinitely better than any positives, like night and day.

Leading Indicators are also in line or moving in the anticipated direction, Breadth indicators didn't have much to say and I imagine that's because there was so little movement today (as mentioned ES saw the narrowest daily range in 6.5 years), sometimes that's because of accumulation or distribution, but record setting with such poor divergences, it seems to be something else and not anything bullish.

Probably one of the clearest signals of major underlying action (and we are rarely out this far as futures move around a lot and don't migrate the same way equities do), is the 60 min ES chart (or others).

There's a large overal relative negative divergence from left to right, then there's a 60 min negative in to the pop on the F_O_M_C and right after Quad Witching, there's a leading negative move, also well below where it should be on a relative basis even without the leading negative move. Very recent 3C action has been pretty fierce, moving a lot in a single day on a very long term timeframe.

Just like the old days before I used 3C (except now I use 3C to get the same information), I use to run through a number of charts and I'd have a feel for whether there were more bullish or bearish set ups and that was always a good barometer of the market. Well the same thing was VERY evident today in my struggle to find one decent hedge and even with that one (AAPL), I was quite unsure of it and have a number of price alerts set.

There's no Dominant P/V relationship across the averages and if there was, I'm not sure I'd trust it with this holiday volume.

So that will do it for now, I'd like to have seen more data today, but the best I saw was what I expected to see, an attempt at some accumulation on mostly an intraday and short term basis, within much larger leading negative trends.

If anything interesting pops up in futures overnight, I'll let you know. Thus far the only thing of real interest is how dull such a low volume environment has actually been, quite the opposite of what we normally would expect.


UNG / DGAZ Trade Update

I've been asked about this a couple of times so I thought I'd show the charts, I still like DGAZ for a pullback in UNG. On the pullback in UNG I want to confirm accumulation and when it looks to be done, close the DGAZ long (3x short Nat Gas) and re-open the UNG long which is a long term primary trend trade that hasn't even broken out of its base yet.

 The top pattern in UNG for its reversal is a little more complex than a "U" shape, it's like a small mini H&S and as such, the short term charts will go positive and negative to form it, but whenever you have a situation in which things are confusing short term, move to longer term charts, take the short term moves that don't mean anything (unless you are using them as tactical entries/exits) and look for the underlying trend.

I have done that here with DGAZ, Natural Gas Futures and UNG, you'll see some trends emerge and different information on each, but confirmation as well.
 DGAZ (3x short nat gas) has a nice, clear 15 min leading positive, it also shows what looks like an inverse H&S reversal/bottom, I could have used longer charts here to show the higher probabilities, but I didn't want to make this look like a long term trend that was somewhere far off in the distance before it materializes.

I used /NG Natural Gas Futures to show the longer term trend and how strong this divegrence is, this is a 4 hour leading negative which means UNG should see a significant pullback and DGAZ a significant rally/bounce.

The 30 min chart of UNG has been spot on with divergences from negative to positive to in line and back to negative with what also looks like a H&S pattern, except a top which is good, you can see the negative divegrence although I didn't draw it in.

So I think DGAZ long is fine, I'd consider adding if possible at the right time. Also I don't see this as connected to the overall market's trend at all, this looks to be doing its own thing.

Long term, UNG long is the trade, likely a primary trend that lasts years, but we're not quite there, this looks like a good chance to make money on the pullback and the pullback gives us a chance to enter UNG at a better price, less risk and hopefully right as it starts a new leg higher.

Long v. Short

Here's the AAPL (Trading ) long hedge I was considering.

 AAPL 2 min intraday positive, not very big at all.

 AAPL 5 min positive, pretty decent signal, but on this low volume there's only so much you can accumulate in 2-days which isn't much.

Now take the exact same 5 min chart above and put it in perspective, this is why it's a little scary to be long AAPL or much of anything, you need to be absolutely on the ball.

 Again a 15 min chart shows there has been accumulation and a bit of it relative to the volume available today, yet the same problem exists, "How much gas can you put in the tank with only a day or a day and a half?" and how far can that carry you.

Then...
 Put the chart in perspective. The highest probability trade here is waiting for AAPL to bounce and shorting in to that bounce.

SPXU, 3x short SPX-500
 Unlike the intraday positives that are a day or maybe 2 long, SPXU (a short ETF) has a huge trend leading positive, this isn't a day or so, there's lots of gas in the tank and if it dips, they'll add more as I  will.

I'd take this 5 min SPXU leading positive over AAPL's 15 min leading positive every time, it has size to it, it has strength, it has a process that is mature.

Look at the 10 min, it's not just the most recent "U" bottom, this is part of a larger base going back in to November.

FAZ 3x short Financials
 This 10 min leading positive looks beautiful, the divergence matches the reversal process, both are mature, both are the size you'd expect.

FAS 3x long Financials on the same 10 min chart...
 On the other side of the coin, its inverse, FAS, on the same timeframe is nearly the mirror opposite.

FAZ 60 min (3x short Financials) with the probabilities/ big picture, I don't even need to write on this, it's clear as daylight.

The size of the divegrence is unusual as most have been, this tells me this isn't a correction or a dip and all of the other data from leading indicators to breadth, market structure, mass psychology, margin debt, F_E_D policy, etc. all are in agreement.

Usually we'd see a huge move off a divergence a third of the size of this, but it's only once every 4 -6 years that we get a change in the primary trend and that's when we run at extremes,this however has to be the most extreme market I've seen from all of my time studying past bull and bear markets and I understand why when you understand how this market got here, it's a house of cards built on the shifting tidal sands of the beach.

FAS 2x long Financials
Like you'd expect, the inverse ETF has the inverse signal, this is one of many ways we look for confirmation, but there it is.

Or we can just look at the underlying Financial Sector, the whole story is there.
 XLF Daily. I drew in the distribution areas with red boxes and I made them approximately the size of the distribution, hopefully uoi'll understand what this all means, that this is not a corrective downside move, don't forget to look at the 3C money flow at the left in 2010 and compare to the current even as price is significantly higher.

XLF 4 hour chart


 XLF 30 min chart, this has been negative all year, usually these would have produced a move the first month, but as we have seen with some of the top Private Equity and Hedge Funds, they have said, "We have been selling EVERYTHING not nailed down for the last 18 months".

They wouldn't lie about that because it's so easy to fact check via their SEC filings, especially a trend that size, that long, this explains not only the long and extreme 3C signals, but also the indisputable falling breadth from 2013 at its height at the start of the year to its lows presently, those stocks don't fall below those moving averages if they are being bought.

 XLF 15 min with more detail, but the same conclusion.

 XLF 10 min

XLF 5 min

Here's an intraday positive divegrence in financials on a 1 min chart, but...

Put that same chart in perspective and tell me, can you even see today's positive divegrence to the far right?

I didn't cherry pick any of these, I leaned toward the assets I want to add to or am involved in, but it's the same everywhere, that's why I had such a difficult time finding a hedge and I'd much prefer having a 3x leveraged one, but the industry groups and averages that have the leveraged ETFS available looked worse than AAPL.