Thursday, June 20, 2013

Update

I'm not going to put out the daily wrap just yet because it's way too early to have any insight in to futures.

What we do know is that the market was a bloodbath worldwide, China has major liquidity problems that are hitting their banking sector hard, Japan has been in trouble for a long time, but things were only made worse by Kuroda and Abe's QE-Godzilla they released on the world, but most of all China. Europe of course followed suit, and the US today was another ugly day, but still well within the F_O_M_C Knee-Jerk response, if you've been here 6 months you know how often and how large the font and how bold it is, any time there's a F_E_D related event, but especially F_O_M_C events, they are notorious for knee-jerk reactions in which the initial move is wrong and followed by a storng reversal.

When QE3 was unleashed on Sept. 13 2012, the market rallied the 13th hard and half of the 14th, then it drifted lower for about 6 weeks, before completing about an 8% downdraft in to the November 16th lows. The reason I mention this is because the market first rallied hard as QE3 was announced, but we had negative signals and a lot of members were nervous about "Fighting the F_E_D", I was even nervous, I said, "I feel like just closing every short and going all long today", but that's not what the signals told us and for the next 2 months or so, the market was never higher than the highs of the second day after the F_O_M_C policy meeting/announcement, so the knee-jerk move was there, we followed the signals and were right not to go long and that was about 2 months, but a day and a half of Knee-Jerk effect.

Add about 6x the volatility now and things are a lot more extreme than any time since before March 2009. This is just how it has always been with the F_O_M_C, I'd guess about 90% of the time that knee-jerk reaction pops up and that's why I warn about it so consistently.

In any case, Asia and Europe aren't going to lead the US unless they have another QE-Zilla, the US leads those markets more often than not and at a day and a half of knee-jerk, it's not at all unusual, it's just very volatile, but that sword cuts both ways.

Other than individual charts, averages, futures, etc, credit to me was very interesting, it didn't have a good day at all, but almost all of that damage was on the open, the rest of the day it acted well (relative performance) and credit is finicky, it's the first to spook and especially the illiquid types of High Yield like DHY.

For now I'll show you a few charts, then later I'll look at the futures. I also want to remind you that one of the bigger events this week that few will notice, seems to be the 180 degree reversal of the currency correlation from USD/JPY to what appears to be either the legacy arbitrage $USD correlation or perhaps the same with a little emphasis on the JPY, but a complete u-turn there.

I keep thinking in my head, like a song that you can't get out of your head, Warrren Buffet's advice, "Buy when there's blood in the streets". I don't agree with that, I think you buy when you have a clear edge, not just when the market is down, but that being said, one of the hardest things to do is to buy when there's blood in the streets, even when you do have an edge, but it also tends to have less risk and higher probabilities of gains. 

We get paid to take risks, not silly ones or arbitrary, but to make the difficult calls when everything in your mind is saying "NO!!!", but the message of the market (not the mass message, your edge) is telling you, "You have an edge here, take it because it won't last long". That's hard, but that's trading; our emotions are most often some of the best reverse indicators and this is why I satay on top of retail sentiment thanks to several members.

One of the most shocking charts today is the CONTEXT ES model, we've all seen this chart right on with a 40 point differential and then ES reversing to nearly the 40 point indication exactly. Well I have never seen the ES model this far north of ES, neither have you.
We are now at a 70+ point positive differential, meaning the risk assets that Wall Street trades are indicating ES has about 71 points of upside before it even reaches fair value vs. other forms of risk assets, not compared to over bought or oversold, other risk assets that smart money trades that they've already bid up.

Here's a brief description of what CONTEXT for ES (SPX futures) is from their site...

"asset-classes tend to behave in highly correlated ways most of the time. The CONTEXT framework attempts to distill the world’s ‘risk’ asset-classes (interest-rates and curves, credit risk, FX carry, commodities, and precious metals) into a single-measure that can be judged against the US equity market in order to comprehend potential mis-pricings (or technical flows and liquidity impacts). Institutional and algorithmic clients tend to use CONTEXT as a confirmation tool for positioning against (or with) a trend. "

For now, the other charts I found interesting, beyond many I posted earlier because the process of accumulation or distribution is indeed a process, smart money doesn't chase the market, they lead it, much in the same way a reversal is a process and not an event.

 This is kind of a micro/macro look at how Credit leads the market, this is High Yield credit today vs the SPX, the type of credit smart money uses to express a long/risk on position. The fact that it found support almost off the open and held it all day says a lot for credit, especially this one in particular because it's so thin, they usually stampede in this asset first and well before the market follows, again because of the low volume.

The close may not look like much, but it seems they were keeping HY credit right at a constant accumulation zone and that last minute buying driving it higher, looks to be real demand. This might not happen in an HYG because liquidity is 100's of times better.


Here's a macro view, you can see HY Credit called every top or bottom by moving up or down before the market.

As for the 3C charts...
 5 min leading positive in a tight range which is normally institutional activity...

And a huge 15 min leading positive divergence that is showing a large head fake move as 3C made new leading highs on the move today, again the market is fractal, what you see on 15 min charts you'll see on 1 min or 1 day charts.

The more liquid, HY credit, HYG...
You may recall 3 weeks ago I had an idea of what I thought the market would be doing, if HYG is correct, that entire thesis will be correct.

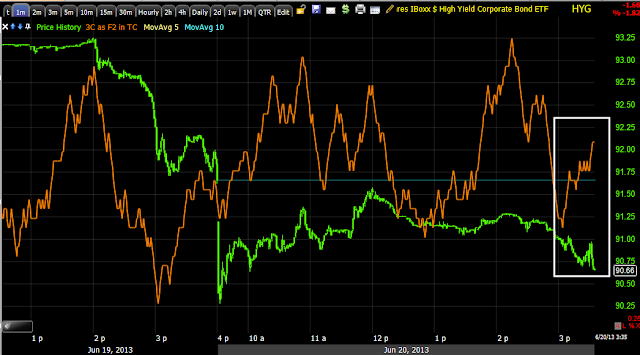
 First of all, intraday HYG held up even better, it never made a lower low from the a.m. low, when it pulled back under intraday support, it went leading positive, that was my signal to take that position.

However this 60 min chart would be the real show stopper as this is almost exclusively an institutional asset, it was negative at the top, in line on the way down and now on multiple longer timeframes it is leading positive with the short end meeting the longer charts.

I want to show you one other chart, I will show more later, but many you saw so some will be updates, but this is the NYSE TICK chart which I said earlier to watch and compare to the market, if it is moving differently from the market it's giving you a message and I also said it needs to break +1000 for that message to be valid.

The NYSE TICK data is green (1 min) and the SPX is purple, note the first down channel with the SPX, then note the SPX pushing lower while the TICK makes a NEW trend moving higher and above +1000!

This is the number of all advancing NYSE stocks minus decliners so when you have the SPX moving down and a positive trend in the TICK with a +1000 reading, that means there are net 1000 more stocks ticking up than down and this is the kind of hint I was trying to describe earlier, except this is one of the strongest examples of it I have seen.

So these are all tools for your kit, but give them time, let them show you they work and you can decide if they are right for you.

The more you see, the better. It's often said, to make money you have to see what the crowd missed and often it's mundane, fleeting glimpses.

I'll be back in a bit with more. Right now the Index futures are leading positive, the largest one being the NASDAQ 100 futures.

NQ NASDAQ futures
 The intraday 1 min is not saying this is a failed signal, it is saying...

This entire area is or was under accumulation. One of the interesting things about 3C that few people realize is wherever the divergence first started, lets say around the 2910 level, no matter how much further it carries on, the reversal that comes from the positive divergence in this case, almost always FAR exceeds where the first sign of accumulation was so not only retracing this afternoon, but far above that.

The 5 min chart is leading positive.

More in a bit


It's Always Darkest Before The Dawn... Here We Go.

That's a perfect analogy to this kind of market, a knee-jerk move and a head fake move.

Take a look at the Index Futures which are moving faster to the upside (3C) than I can capture and upload them, then there's the largest dislocation in CONTEXT/ES ever seen by my eyes...
 ES

NQ

TF
And a positive 68 point positive differential in the ES model vs ES, risk assets are moving higher, stocks are playing a little game of possum. I know it's a hard market to look at like this, but this tells me pretty much what I need to know to feel secure in the decisions made yesterday and today.

Quick Market Update

This won't be a comprehensive update with this little time, but so far the underlying trade is holding up, the TICK is making a transition, it has some more to go, but at least it has improved and Credit is the real standout as it is holding up well - Credit would normally be way in front of the market on a sell-off.

SPY holding up in to the afternoon move.

 The NYSE TICK actually reversing the move, it needs to get in to the +1000 area, but just breaking with the trend is a good indication.

HYG credit which I wanted to add to the call position earlier, but it was just too far away from where I would have considered an entry, it came down a bit and now it's going positive or re-establishing the positive trend since that move down which allowed me an entry.

Most of all, the VERY THIN High Yield Credit, and Credit Leads Equities, is holding up perfectly all day, not only holding support, but diverging positively.

Credit, especially non-liquid types like DHY above, would be the most skittish and leading a downside charge if there weren't something going on.

Filling out the HYG July $92 Calls

We finally got a bit of a dip making the risk/reward proposition more attractive in HYG.

This is High Yield Corp. Credit.  I'm not aware of any specific leveraged ETF, at least not with this kind of liquidity.

While it can be played long as an equity position, I think the beta is a bit low on the risk/reward side so I prefer options.


Adding New XLK July $30 Calls Position

If you want an equity position of course there's XLK long at 1x leverage or TECL long at 2x leverage.

Assets

I think at this point the only position I may personally add to is HYG July $92 calls and that's more about position size/risk management.

Some other positions I like after just having gone through the entire watchlist:

IWM (calls ) or long, UWM is 2x leveraged long and URTY is 3x leveraged long.

DIA (calls) of UDOW long which is 3x leveraged long ETF.

XLK looks interesting (I may look at a position here), July calls or the 3x leveraged long ETF for Tech is TECL.

XLF/ financials (calls) or FAS long 3x leveraged long

AAPL is looking better as the day progresses as an add to or new initial position, whether equity or options, I think both work.

UNG as posted I believe yesterday, looks to be in the pullback expected, this is more of a long term position, but I'd watch the $20 area as it may be a decent long after that pullback is complete.

VXX I still like, I think there's enough beta to short VXX or for 2x leverage use UVXY or for the inverse of VXX, long XIV

GLD calls or perhaps a 2x leveraged ETF (the 3x leverage look too thin)

URRE looks close to being a long, this may be more of a longer term position, not dependent on the market, I'd watch it close, but give it a bit more time.

TQQQ is a way to play the Q's long with equity at 3x leverage, in case I didn't mention them, UPRO is long 3x leverage for the SPY, the IWM is above as is the Dow.

These are the assets on the watchlist that look decent here now.

I may add to HYG and start XLK.

Using the TICK For Timing

I mentioned this earlier, here's an example for you.

First as mentioned several times today and very often as a general market concept, the head fake move (in this case a stop run) is very often the last thing seen before a reversal after a base has formed.

So we have both the base of about the right size, the positive divergences, and now the head fake/ stop run.

The NYSE intraday TICK can be invaluable in spotting nearly the exact moment of an actual price reversal.
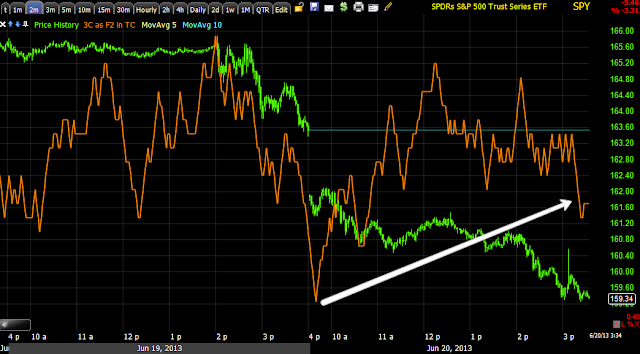
 SPY positive divergence during the stop run, stops are hit as volume pops up on stop orders placed on the books, these are easy, cheap shares that pros know are there for the taking before any reversal gets under way.

Using the 1 min intraday NYSE TICK chart, I draw a channel around the TICK data and when the channel is broken, you have a pretty good idea that a price reversal is on its way.

Filling Out VXX July Put and Also Shorting UVXY

The VXX Put position will be brought to its full size for an options position and I'll add about a half full size equity short with UVXY for the Equity tracking portfolio.

XIV long is another way to play this move without leverage, remember volatility can move a lot.

I think we just got the shakeout move

I've mentioned several times today a shakeout move/stop run being an excellent timing tool, I think we just got it.

3C is positive (SPY 2 min) and volume ticked up as the intraday lows were broken.

A move back up above support that was just broken would usually be the start of the reversal move

Market & Leading Indicators Update (Abbreviated Update)

Everything looks to be on track after the entire week being very opaque until yesterday post F_O_M_C when signals started coming in. I'm sure the F_O_M_C nervousness before the statement played a role, but the most crucial change this week is the USD/JPY which has been almost the only risk leader (market leader) to an total 180 degree flip to the more historically relevant $USD/SPX (market) inverse correlation.

It seems it may be that the JPY at present, might be even more important than the $USD, in any case as far as longer term market views or primary trend views go, this was the last "Carry Trade" standing after EUR/JPY and AUD/JPY were taken out. Now USD/JPY is out of the picture, this means that the mechanism of "Carry" that allows hedge funds and others to leverage their AUM through these trades, have unwound their leverage and thus their positions (long) in the market and they are ready for a primary trend market collapse. That doesn't mean we won't get noise and bounces, shakeouts, etc in between.

As far as I can tell, we are still on track from out analysis of almost 3 weeks ago which has been spot on up until this point, I expect it continues , meaning we'd have 1 more powerful/convincing upside move-the reversal of the F_E_D knee jerk effect.

Lets look art a few charts, you need to understand what's going on and see it to have any confidence, then at some point I'll try to deal with Treasuries separately which are also greatly impacted by F_E_D policy.

 First, the SPY Arbitrage is at +1.33 differential in the model, this is a pretty big and bullish model differential.

 The positive ES CONTEXT model differential is now an astounding  62+ points, this is a move I don't want to miss considering the positive divergences are there.

 This is the 1 min $USD, it seems to suggest intraday upside, that could create the market shakeout, but as mentioned already, I think the Yen might actually be more of a driving force.

This is the $USD 5 min, negative and ready to move down, with the legacy arbitrage back in style, that means the market moves opposite the $USD.

 This is a 5 min chart of Yields, I always describe these as an "Equity Magnet", as stock prices are pulled toward yields when there's a dislocation like this, making yields a leading indicator.

 Longer term you can see the reversion between Yields and the SPX (green) at the white boxes. Just like CONTEXT suggests, Yields suggest a pretty strong upside move, which has been our expectation after the bear trap was sprung.

 Even uncorrelated sentiment looks good as the second bottom of an apparent "W" base forms.

 This is the relationship between the Yen and SPX recently, again I suspect this is the leader right now with the USD looking similar.

The Yen 1 min positive

Yen 5 min positive.


As for sector rotation, the Flight to Safety sectors are rotating out, the "Risk on" sectors are rotating in, Financials being a big one.

 ES

NQ

TF

I'll be looking at last minute positions.

This is looking like the bottom

I have a market and leading indicators update, but I may need to put that off.
The bottom line of both is that the market strengthening is confirmed.

I do have a question as to whether this flip in FX correlation is more $USD or JPY relevant, I think we will have a decisive answer before the close, I actually think it is a bit more Yen oriented than the $USD although they move so close to opposite it's hard to tell, but I have different divergences and if the market lifts soon, it will suggest the Yen is the important currency just as I thought it would be back in April when I wrote the two linked articles (top left of the member's site), "Currency Crisis".

If I have time to get the market/LI update out soon, I will.

Otherwise, the IWM looks really good here, the Q's would not be my first choice, not over the IWM. AAPL I haven't mentioned today thus far because it hasn't been negative, just not very positive, that is starting to change right now so I'd consider AAPL a long here too as it is now improving.

Let me see how close we are, how much time I have for analysis and how much time I have for positions which are most important and which positions are still in a good looking place.


Quick Market Update

I thought I'd just get this out before I switch templates and check leading indicators. This is really what I was hoping to see, this gives us a little more of the reversal "process" rather than an event, the difference is just the difference between a bottom reversal area being "U" shaped or "V" shaped.

The market (and I mean smart money) don't have 100 lot positions like most of us do to some degree or another, this means for them to do what I've been doing this afternoon (adding to positions), they need more time, if they floated a 20k share order in a stock that trades 200k average a day, that would send the predatory HFTs and everyone else front running that order (that's hyperbole, most positions they enter are not going to be such thin volume, but the point is the same) so they need to break it up in to more manageable pieces that won't send price against them (like a bad fill for you or I) and they are typically trying to fill near VWAP so the bottom line is reversals that have some support are going to be more of a process, reversals that are much less common and "V" shaped are usually parabolic, impressive at first and then fall like a rock or just flame out.

So now we have more or an intraday "V" or by the time it's done, it should have a larger "U" shape.

This would also be the place to look for a head fake move below intraday support, with 3C leading positive like this it's almost certain any stop run would be accumulated and a good entry that is a good price and lower risk as well as higher probabilities.

So keep an eye on assets you are interested in, if there's a stop run you want to see some volume just below support showing they were hit and likely accumulated and then you have a nice entry area.

You can also watch the intraday NYSE TICK chart (1 min) and compare the trend (with trendlines drawn showing the channel) to the SPX, if TICK looks shallower, more positive than the SPX at a head fake move, you also have a good idea that it's a run on stops and probably a very good entry.

After I check Leading indicators and make one quick market sweep again, I'll try to get to some emails and by then we should be ready to look at any remaining assets that may be decent trades as I'll go through the entire watchlist.

Market Update

I'm trying to move a bit fast because the market is developing pretty fast. First I wanted to see if it was stable, it was, then if it was accumulating , it was, this all pretty much confirmed the F_O_M_C knee jerk reaction, I think as I said last night, the market will like that Bernie gave them a date, something objective rather than the previous yard stick which was an economic ruler which is very subjective.

The market likes certainty.

To give you some idea of the market and why I'm moving a little fast...

SPY 3 min, when zoomed to intraday it's nearly at a new leading positive high for the entire chart and very quickly, but since even this 3 min timeframe didn't confirm price on the downside today, there was already strength built up in the SPY.

This is what an intraday 1 min chart looks like so the progression of the divergence is picking up and getting stronger, faster.

ES confirms easily, this is a new leading positive.

I think we can still see some moves to the lower end of today's range and a head fake/stop run would be the best entry, but I don't have time for that and it doesn't matter much to me. When I see charts like these, I don't ignore them

Adding to GLD July $132 Calls, I also like GLD long itself or 2x leveraged

 GLD 1 min

3 min

longer term 5 min.

There are a lot of leveraged Gold ETFs, just be careful with their liquidity/volume.

Adding to MCP

I'll be adding to the July $5 Calls, but I think MCP has legs of its own as well even without the market and today looks like a perfect head fake move.

MCP 10 min

I'd take this as a long equity position without leverage as well.

Quick Market Update

I'll just show ES, but a lot of assets, especially the ones I rattled off two posts ago, are showing leading positives picking up VERY fast.

ES 1 min leading positive. I'm thinking there may be 1 more pullback in the range and this divergence gets bigger.

I like it right where it is though, it tends to confirm the knee-jerk F_O_M_C response that is always expected.

Adding to IWM July $98 Calls

 IWM 2 min chart, there are other timeframes positive and there's solid migration from 1-5 min through all timeframes.

"If" I had the time, I'd probably wait and see if I could enter on a break of intraday support, especially if volume spiked up intraday showing stops were hit, other than that, I think for my purposes this is close enough, just that would be a more ideal entry price and timing signal.

IWM 5 min never confirmed the downside move which it could have done easily by now, so there's strength in the IWM beyond what has developed today.

Assets on the Trade List for Me

I can't add to a lot of these just because of risk management rules about position sizes, but the ones I've looked at so far and I think are really close to being long or call positions include:

QQQ, IWM, SPY - these in my view need a little more time, probably not a lot. The 3x long ETFs for these are TQQQ, URTY and UPRO respectively.

I like XLF pretty much where it's at. FAS would be the 3x long leveraged for Financials

I will hold HYG, I like it , I think it moves higher, but it's just not at the lower risk area I'd prefer to add to or enter a new position, I think leverage is needed with this one.

MCP Calls are ones I will add to, I'll just add to the July $5, I'll let you know, but it will be soon. I'll probably add to the July IWM calls, I'm not sure if I'll add to the existing $98 or change that, probably the $98's

FSLR I like a lot, it has broken under a VERY clear range and stayed positive so I think there's a very high probability that this is the head fake move, I think FSLR has legs of its own outside of what the market does.

AAPL is coming together quickly on the charts, both FSLR and AAPL will be hold positions because of my current size, but I'd add to or start new positions here no problem if I could.

That's it for now, ES is seeing a very strong positive divergence moving so I'll be making some moves quickly.

Closing SCO long Equity position, may look at USO

I think as a long, USO is almost there, for an equity position it's probably close enough, I'd always prefer to see that classic head fake/stop run as a great timing signal as this happens most of the time right before a reversal.

The SCO is a 2x short crude and I don't see much more upside in it

VXX Put / UVXY & XIV Long

Depending on how much leverage you are comfortable with, you could go with VXX puts or if you just want to play a less leveraged equity long position, then XIV would be the asset.

I will enter July VXX $22 puts on sale this morning.

The charts.
 VXX 1 min which looks worse since the last capture. I think it could make another intraday high, but as far as momentum goes for a put, I don't see much reason in waiting any longer.

VXX 2 min

VXX 3 min

UVXY is the same as VXX, just 2x leveraged - the 1 min

The 2 min negative

I didn't want to draw on this so you could see how negative the 3 min is and

the same goes for the 5 min which should have been able to confirm the move up by now if it had anything behind it.

I'll be entering the VXX put now.