Monday, October 15, 2012

Another Beautiful Close in AAPL

I'm not talking about the las hour in which AAPL broke out of a symmetrical triangle that was there the entire day, I'm not talking about strength in to the close, I'm not even talking about the daily "Hammer" bullish reversal candlestick AAPL put in, I'm talking about the confirmation of Friday's already powerful bullish reversal.

 Last Tuesday we put in a hammer on huge volume and since then, that support has held. If you got lost in the lines of intraday trade you might feel like AAPL was more bearish that it really was, the bottom line is for just having broken a H&S top's neckline, the follow through on the downside was not there, it couldn't add anything to the lows from Tuesday last week, so 1 day of follow through of 6?

Today's close is not only a bullish reversal hammer candlestick, but also what would be considered confirmation of Thursday/Friday's Harami Star reversal candlestick as today we not only tested some lows and saw them rejected, but closed higher-confirmation of the Harami.


 AAPL since that first bearish descending triangle that was, according to Technical Analysis, supposed to start the next leg lower in AAPL, turned out to be a head fake and one that saw a positive divergence as that is one of the reasons for them, then a second head fake that was to hit orders and stops as it was just below the lows of the first yellow box lows. All the while, the leading positive divergence kept building.

 This isn't a perfect rounding bottom, but it clearly illustrates (or at least within the next day or so I believe it will demonstrate) the concept of, "Reversals aren't an event, they are a process" and there's a lot of gamesmanship, false moves, head fakes, etc during that process.

 Today's 2 min chart is beautiful as AAPL trades laterally in a triangle and 3C keeps moving higher in leading positive position until the 3 pm pop which is nothing compared to what AAPL should do when it crosses the H&S neckline.

Al in all, a good day for AAPL when you look at all of the information that is available beyond price and volume.

FB Charts

As many of you know, last time when no one would touch FB and even I didn't like the stock, we had a bunch of solid positive divergences and many of us either made good money or with options made a killing on that move. If you wait until you understand why and don't take a solid signal, you miss the move.

FB, as we have known has been putting together a base 10x larger than the last one, probably even bigger which should support a very strong move, with today's excellent looking charts, I can't see not having FB, but I'm already set.

Here are the charts, sort of a similar theme to many market averages and stocks today, short term intraday charts to peg price in place in a consolidation and longer term charts going nuts with positive divergences.

 FB's Daily base area.

 Recently, other than filling the gap, FB has been in a tight range or what might be considered a boring market, this however, is when we see the strongest institutional underlying trade, when people least expect it and prices are kept very stable for a fill that the institution requires. This is why I always say, "Boring markets are dangerous markets" because they are up to something and if you are lulled in to complacency, you not only get caught off guard, you miss your chance to figure out what is going on and where to position yourself.


 The FB 5 min chart is beautiful since the pullback, especially in the flat range.

 The intraday 1 min chart doesn't have anything exciting, it just has 2 negative divergences to keep FB from moving up, keep FB in the range where it can be accumulated at a lower price with less risk.

 The 15 min also is leading positive in the range, but added a bit today, just short of a new leading positive high.

 The 30 min chart is now leading positive

And today the 60 min chart bumped in to a leading positive position where it has elsewhere been perfectly in line.

FAS Charts

Maybe you liked FAS from Friday or earlier today in which case you got a better entry, but for just putting that out, I opened FAS just minutes before it started to run in to the triangle.

 Here's the triangle that is all part of the head fake move, this will eventually end up being a Crazy Ivan double head fake move.

 The post at 3:41 was several minutes before the move started here.

 The 2 min intraday chart went just negative enough to consolidate FAS where I think like the rest of the market, short sales were accumulated by smart money.

 The 5 min chart added to the leading positive position

 As did the 10 min

And even the 30 min.

Wow, that I can't ignore.

FB also in a place to start or add long

Looks great, charts coming

Adding FAS

This is not my favorite as I mentioned because it really didn't get beaten up as bad as some others like the leveraged market ETFs, but I see some more strength that started late last week, building in today so I'm going to open about 50% of a regular position size or a speculative position (which is appropriate being it's 3x leveraged).

Charts to follow.


Market Update

All I can say is I believe shorts that don't have the same tools we have salivated over this

 Another, "Short the rip" above the 5 min 50 bar, gave smart money some ammo today.

I know ROC is no longer fashionable, but a simple ROC on price in almost any timeframe would tell you, "Something is changing" and changes in character precede changes in trend.

SPY 15min ROC.

As for the charts, like I said, no damage, in fact we've even hit a new milestone today.

 SPY 2 min intraday negative divergence did both things I mentioned, consolidated and pulled the SPY back a little, not as much as a normal pullback would, but we still have some time, however I'd be using any price weakness to add to my long positions for at least a swing long similar to the downtrend from the 5th of Oct.

 The SPY 5 min chart has NO DMAGE at all and has hit new local leading positive highs.

 10 min chart added all of what is in the box today alone and at a new leading positive high since the move down started.


 The 15 min charts have been blowing me away today, all this added today, again more than even before the move down stated, this looks to be a powerful shakeout, but when aren't they, that it what they are there for.

Here's the new milestone, a 30 min chart
All of what is in the box was added today alone on a 30 min chart! That could normally take 2-4 days.

Risk Asset Update

This is a nearly perfect Risk Asset Update in many ways when you look at the 15 min charts today and how much they have gained so fast.

The StockTwits crowd (I have this from numerous sources) are retail traders, they are viewing today's price strength as a chance to short and the only way I can see those 15 min charts flying positive like they are is if there's enough supply for smart money to accumulate, when you sell short, you are selling shares in the market, that is supply, that is what smart money needs to accumulate and probably answers the question of why and how are 15 min charts hitting new highs so quickly in an environment that is neither down or flat?

The Risk Assets are leading indicators and they support the bullish stance of the charts from late last week, through last week as it was building and especially the crazy move today.

The charts....
 My favorite currency as far as leading indicators go is the Australian dollar as it shows what hedge funds are doing, whether they are moving in to or out of the carry trade, here $AUD vs the SPX (green), just like last night when the $AUD led the Euro and ES after they fell hard after the open, is leading again.

 The Euro recently is even at a positive arbitrage correlation for market upside.

 Here's the biggie, High Yield Corp. Credit, not only because this is VERY liquid and a first choice for large traders to express a bullish view quickly, but because Credit markets are smarter than Equity market, "Credit leads, stocks follow". That's a huge positive divergence in credit vs the SPX.

 Even intraday as the SPX pulls back as expected, Credit is not, it's holding its ground.

 Even High Yielding Junk Credit is leading the SPX!

Intraday also.

$AUD gave us a peak last night and the market responded, it's now giving us a much bigger signal that fits with the 15 min charts, the Euro isn't holding anything back and HY Credit is leading strongly for this move.


Market Update

Since the first intraday negative divergence after the market made a run, it has held the market in a consolidation zone, now we are seeing a little more on the negative intraday side, but not enough to do any real damage, so as I suspected earlier, a pullback, but we seem to be very much at the turning point and twitter seems to confirm it as everyone is going bearish/short here.

An example with the SPY...
 SPY 2 min  is a bit more negative intraday after good confirmation, but...

 The 5 min chart is seeing virtually no damage, even the 3 min chart is seeing no significant damage at all.

While the 15 min chart builds to new leading positive highs as retail shorts create the supply institutional money needs to put together a strong/larger position, I suspect that's why we are seeing these 15 min charts move so much today and so strongly.

I'm going to check leading indicators.


Holding ERX (Energy Bull 3x)

This position has been in place and it's moving toward working well for me. As you know last week I closed the UCO (USO leveraged long) and I'm glad I did, I expected a pullback, even though I think it does have more upside. I'll cover oil in a different post, but Energy is similar to oil, except oil seemed to be rotating a bit harder than energy short term (week) which shouldn't be too surprising as they are different, Energy includes a lot of different components including services whereas oil is 1 thing, oil.

I think ERX is in a position here in which it is still a viable position, any pullback would make it more attractive and I may even add a bit to the position if given the right opportunity which of course I will post here first.

So lets take a look at Energy via XLE and then ERY and ERX.

XLE-Energy
 The 15 min chart is positive for Energy so that should be at least a decent swing long.

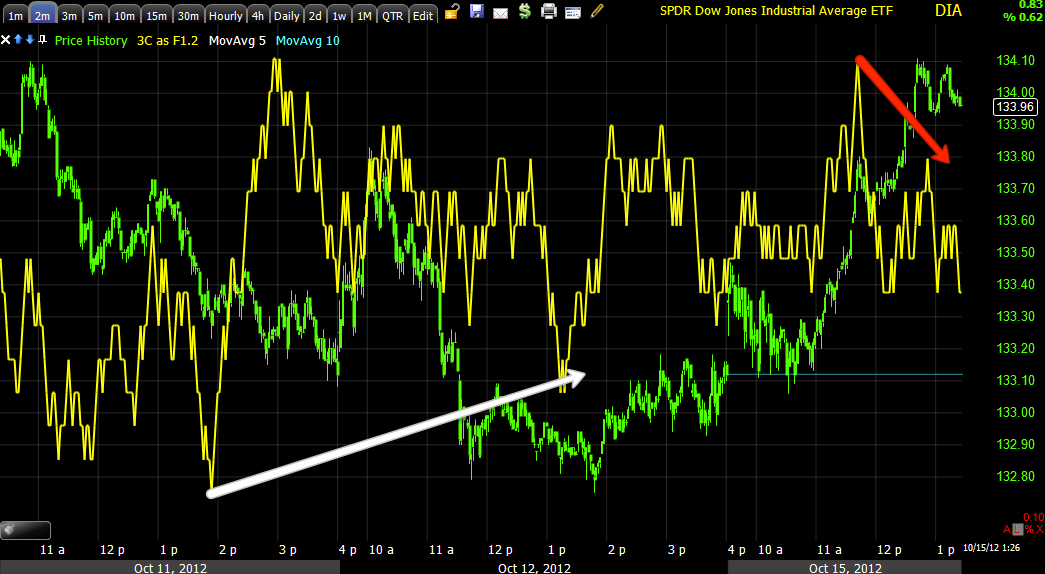
 The 10 min chart has pulled together well.

 The 5 min chart is showing some closer tactical signals with a leading positive on this morning's dip.

 The even faster 3 min chart also leading positive on the dip of the last 2 days, it looks like each dip is seeing short term accumulation.

 And finally the fastest 1 min chart also leading positive, with the 15 min in place already positive, this looks like Energy is ready to go and make a leg higher.

 Longer term, Just as Energy went negative (we played the core shorts with some energy stocks) in early 2012 or toward the end of Q1 2012, it also saw the same positive divergence the rest of the market did in late May/early June. Since, the divergence has grown to the strongest on the chart, leading negative as it looks like the June accumulated shares were sold in to strength and then some, longer term I'd expect we see a move much more significant than the Q1 2012 to June lows.

ERY, Energy Bear 3x
 Very short term intraday, the 3 min isn't looking good on any attempts at strength, they looks to be under distribution.

 The 5 min is more important and it shows the situation deteriorating at 3 areas of similar price with the last moving the highest, but 3C showing the worst reading there.

 This now has the 10-15 min charts both above and below in leading negative position, which confirms the strength on the XLE 15 min chart as ERY is the opposite of XLE.

 ERY 15 min leading negative

 However longer term on the 4 hour, ERY agrees with XLE as it is leading positive where XLE (the opposite) is leading negative. So I'd expect the same as we expect for the general market, near term strength in Energy and that setting up longer term weakness.

ERX Energy Bull 3X- This should give the opposite signals of ERY and the same signals as XLE for confirmation.
 Long term, a leading negative divergence so it confirms both XLE and ERY.

 Shorter term the 15 min (a swing timeframe at least) is leading positive so I'll hold ERX long for this move higher.

Near term it is positive as well. Every chart in 3 different ETFs that are seeing different volume and trading action are all saying the same thing on every timeframe, near term strength in Energy, but bigger picture is setting up for weakness and that's why I want ERX long right now until we are in an area that I feel I should close the position at a profit and look to short Energy.


Market Update-Big Improvements

Although we should be consolidating/pulling back for a while this afternoon (we still may close strong), the underlying trade is just blowing away my expectations with improvements that are huge considering the chart length and how long the market has been open today, I do think that gap fill this morning was a lot more than just that, in other words I think institutional money was very busy on that gap fill .

SPY 15 min
 The SPY is coming up to first resistance, it's a break through second resistance at the white arrow /upper trendline that will get shorts nervous being that's where the SPY failed from. There is some chance we get some symmetry similar to the AAPL H&S which wasn't perfect, but this does look a bit like an inverse H&S bottom with a left shoulder, hear and the upswing of the right shoulder which would still need a pullback and another swing up through upper resistance to complete, that's just a possibility, not a probability, but we need to consider all situations as we can make plans and no what we want to do if X, Y or Z happens.

We could also have...
 A large head fake descending triangle, this tells technical traders to expect more downside and they would have actually already shorted the price pattern on the break below support last week.

Volume isn't perfect, but a wedge of this size is entirely possible without having the drawbacks of acting like a wedge, in other words, it would be organic rather than engineered.

DIA
DIA intraday looks ready for a pullback/consolidation, but in context, it's really a minor signal.

Most of the new highs in the 15 min leading positive divergence were added TODAY ALONE!!! Everything in the box was today alone and the DIA had been the ugliest of all the averages.

QQQ
QQQ 1 min negative divergence/ intraday pullback, but....

Again, the 30 min in this case saw a lot of upside in the leading positive added today alone.

SPY
SPY 2 min intraday looks ready for a pullback after good confirmation today.

However once again, the 15 min chart which is a serious timeframe is seeing a new leading positive high above the highs of more than a week ago and all of that in the right, white box was added today alone. We don't often se such large 3C moves on such long timeframes in so little time/space, this typically means institutional activity has picked up big time.