Tuesday, February 11, 2014

Daily Wrap

First thanks for the comments on the last few posts, I'm glad you enjoyed them. Second, I'm going to try to make this as brief, but useful as possible, honestly, I'm burnout today, it was a tough day and if there's one lesson to walk away from over the past week or two considering we just had a 4-day move that was the most powerful in 2 years, that is THE HEAD FAKE MOVES ARE REAL, THEY AREN'T AN ACCIDENT OR COINCIDENCE, THEY ARE PLANNED AS YOU SAW EARLIER, WE HAD CALLED IT OUT A WEEK AHEAD OF TIME AND HAD THE TRADING PORTFOLIO POSITIONED LONG FOR IT.

The second thing to keep in mind is the SPX-200day moving average, for Wall St. this is the ultimate area to stage a head fake move and while I don't know what it might look like, I'd say there's a very high probability we will see one when we reach the area and it should be pretty intense.

It seems the gold/SPX correlation that was so easy to trade with options for short up and down moves, for now, has morphed and until I understand what it's doing, I've stayed away from positions there.

There is no Dominant Price/Volume Relationship tonight which is a bit surprising, there are a few co-dominants, but that's not where the indicator is effective.

I'm going to throw some charts out, hopefully in some semblance of order.

First, last week we were pretty clearly negative to 5 min charts, that caused me to take 1 bearish position, but it wasn't enough for me to close the trading long positions that I started closing more yesterday as the negative divergences started getting worse which made me take them more seriously and as of tonight, the trading portfolio (which I never intended to move) is now leaning strongly short (keep in mind this is for near term trades, not longer term).

As for the P/L for closed positions...


TNA= -3.7% 
I just rather take a small loss here than what I think would be a bigger loss in a few days.


URTY= -5.5%
The same goes for this and all longs closed today.


MCP February $5 Calls= +6.6% 


MCP March $5 calls= +30%
While I love MCP long and hold the equity longs still, I didn't see a high probability of significant gains worth taking the risk here, I like to get in and out of options as they are rigged for the House to Win the longer you stay. Trying to turn this in to a triple digit gain would have been about ego, not what has worked for me consistently with options.


BIDU Feb. $155 Calls= +1.8%
Again this wasn't about trying to keep gains as much as avoiding losses and that afternoon pop looked like the perfect place to unload BIDU.

As for the averages and the reason the trading portfolio went from long to short over 2 days when I had no intention of changing anything, the divergences just got worse. As of Friday we were dealing mostly with 5 min negatives which I could have sat through with long positions, but as they started hitting 10 and 15 min charts, things got more serious and it would not have made sense to sit through the drawdown those charts are implying in a trading portfolio.


Index futures were negative to 5 min charts which is good enough for me, but now 15 min in ES

15 min in NASDAQ 100 futures.

15 min negative in Russell 2000 futures.

  I didn't expect on Friday that we'd be looking at a 10 min leading negative divegrence in the SPY.

 Much less it migrating (gaining strength) to a 15 min chart which is very close to the 30 min positives that I'm now thinking may be a part of a 200-day moving average scheme.

QQQ 5 min isn't even so much about the timeframe as it is the depth of the leading negative and where it is, the short squeeze area and take a look at the price action, that diagonal line with almost no pullbacks (usually on lighter volume) is a hallmark of a short squeeze.

 Again, I didn't expect that 15 min QQQ charts were going to be on their back. The only concern I have for the very immediate future as in probably the first half of tomorrow (best guess) is a bit of a reversal process, I don't think it needs to be big since the distribution occurred on the entire way up and because it's parabolic and these tend to end badly in a sharp reversal with a move to the downside just as strong or stronger.

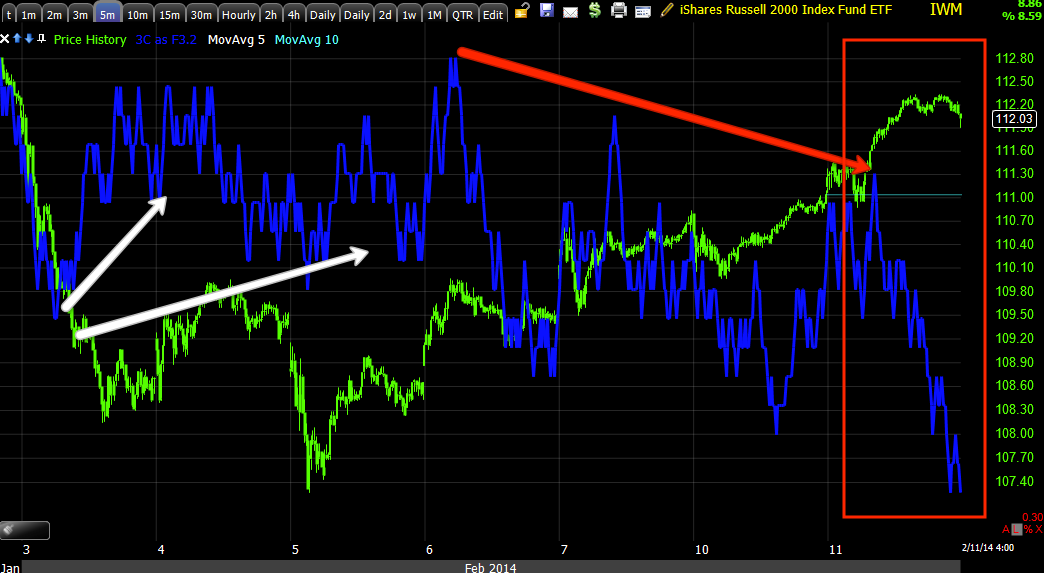
IWM 5 min saw a lot of intensity today.

The 10 min chart is falling off now, it's obviously not on the same level as QQQ and SPY and that's probably why I didn't chose it as a short trading position.

Closer to home...
 QQQ 1 min today

QQQ 3 min

IWM 2 min

IWM 3 min, there's that intensity I was talking about today especially.

As for some other important indications, I love the way VXX/UVXY have held their ground when they should be much lower.
 VXX / UVXY held well (relative performance) and popped in to the close, as I said, I would have picked up either one today on the signals they were giving.

VXX 2 min intraday, this is the kind of leading I like to see in VXX's short term charts.

UVXY 5 min with several relative divergences, as it develops they should get stronger and in the area I showed you today that looks like a clean Igloo/Chimney (fractal)  we get a very strong leading positive at those lows just below support.

UVXY 10 min leading fits with the averages and Index futures getting worse.

This is HYG / High Yield Corp. Credit which has been used to ramp the market so often, it with VXX and TLT form the SPY arbitrage model. This is yesterday's attempt to break SPX $1800 which fell 6 cents short.

The same asset today looks like it lost its legs. We've seen this several times before a move, they'll use HYG, but when things get close, they don't stick around long.

HYG's intraday leading negative

 And the overall 5 min negative which is why I suspected it was very thin support to ramp the market only, the Arb model doesn't depend on the breadth/strength of the move, just prices. Still even with HYG's move, neither today nor yesterday were they able to activate the SPY arbitrage to support the market because VXX and TLT holding up better than their correlations suggested they should which in VXX's case has been a sign of true market demand which you don't see often anymore in price alone.

 TLT (20+ year Treasuries or the flight to safety trade) holding up better than it should vs the SPX with its price inverted so you can see the correlation which is usually almost exact.

TLT's 15 min chart with a leading positive as well as a mature reversal process in place.

I have been looking for a TLT long term long entry, I don't think we are there yet.

One of the reasons (besides the obvious technical predictability of the 200-day ma) I have thought there would be a strong head fake move there is because although I think TLT pops, I don't think it's done with its pullback.
This 60 min TLT chart is the kind of evidence I'm talking about. When this goes positive I think we'll be in a good area to look at TLT as a long term trending play, I may use TBT short to get 2x leverage on TLT.


FX-Yen
 This is the Yen 5 min, it's looking like its ready to make a move higher which would likely send the USD/JPY yo a new low for the year. This would also pressure the market lower, I have suspected that by the time that finishes the FX pair will be near $100 where the BOJ has to probably step up and defend it, the SPX would likely be near its 200-day and the defense of the Yen, (even though the half life has not been good) would be a contributing factor to a stronger market head fake move based on the 200-day moving average.

I just can't imagine Wall St. letting such an obvious Technical Icon go unchallenged without some sort of games.

Yen 15 min leading positive, note it's positive at the same time last week we first noticed the market showing negatives.

 The same is true of the Yen 30 min chart, yet this is a stronger divegrence in a very compact area.

This is the Yen (FXY) vs the SPX with the SPX inverted as the two move opposite each other, you can see the correlation has been near flawless until the last few days, the Yen is stronger which makes for a weaker market.

 The USD via UUP is positive as it should have been at last week's "W" bottom, but since then, not a good showing, thus the 35 or so point difference between ES and the USD/JPY.

 This is the flat range in USD/JPY today since noon time I mentioned, it has lost ground since the close as of this chart, it's bouncing around a bit right now. What happens hear will be very interesting as last night it floated the market higher, but lost a good portion of that in pre-market.

I have been expecting downside in the Nikkei 225 (these are the futures), the 5 min chart is looking like it's nearly ready

And there a sharp negative drop off in 3C on a 15 min chart, that's some pretty intense underlying action to make it dive like that.

This is NQ 1 min as of my last capture about an hour ago, it looks about the same now.

TF 1 min, also similar right now.

And ES which is also similar.

Breadth indicators don't reveal anything we didn't already know, mostly big picture except maybe that there was more of a move in momentum stocks the last two days as well as the most shorted which makes sense.

My DeMArk inspired custom buy/sell indicator on 60 min setting is giving sell signals on the SPX QQQ and DIA as well as buy on VXX.

There was a noticeable difference in the market as the pros have been trading the last 30 minutes, today it broke the short squeeze trend line.

I'm going to check futures again in a couple of hours, I'm looking for NKD weakness, Yen strength, USD/JPY weakness. VIX futures only trade during market hours (pre as well) so we won't see anything there. Treasuries may give some hint.


1929 Analog Insanity

I had to address this because I've been sent the chart several times today, from what I hear it's all over Twitter and Facebook, it can be found here at MarketWatch.

Apparently this chart was first identified by Tom DeMark ad then McClellan picked up on it and now it's everywhere. 

I'd much prefer to have seen DeMark or McClellan apply their indicators to do a comparative analysis between 1929 and today.

First, before I post the chart, MAKE NO MISTAKE, SINCE 2007 I HAVE MAINTAINED THAT I THINK WE WILL SEE THE UNITED STATES FIRST SECULAR BEAR MARKET IN EQUITIES. In 2007 I did a 5-part video, now 2 of the 5 parts are lost, the other three are on YouTube, but I compared bubbles since the first I'm aware of, the Netherlands'  Tulip Craze from 1636 to 1637; The 1720 South Seas Company that bankrupted Sir Isaac Newton; the 1929 Stock Market Crash, the Dot.com bubble and we were just getting in to the Real Estate/Credit bubble.

I'm about as bearish as they come as far as the market moving forward not just because of what we see now, but what we can't anticipate like the effects of globalism, the SEC's  incompetence, the rise of HFT and the demise of true buyers/sellers of last resort (market makers and specialists) as well as an over-zealous F_E_D and a world wide economic disaster in effect or looming, then the additional oddities that no one sees coming just as Janet Yellen didn't see the 2007 Credit bubble coming.

IT HAS BEEN MY OPINION THAT FOR THOSE WHO FIGURE OUT HOW TO NAVIGATE THIS NEW MARKET FIRST, THERE'S AN OPPORTUNITY OF A LIFETIME, PERHAPS MUCH LARGER. So I'm not poo-pooing the bearish sentiment this chart reflects.
The issue I have here is the fact that over the past 2 years I've probably seen over a hundred versions of this chart in one form or another, it's almost like staring at clouds .

We are basically looking at a time period about this big...
To present, about 19 months. Again, if I hadn't seen nearly 100 of these already it might be more interesting.

However, I think it's gaining traction because of the fear of the unknown and this looks like a road map to relieve some of that fear, but in that it can be dangerous, not that I don't expect a horrible decline, in fact I think the top is likely in, but it's what comes next and to assume one has anything to do with the other in my view stretches the bounds of reason.

What I do find more convincing is how the F_E_D stepped in during an economic recession in the early 1920's with Quantitative Easing and creating a recovery that blossomed in to the "Roaring 20's", a time of opulence and excess. It also is important to me that some of the largest bubbles we have had including the 1997 Asian Financial Crisis, the 1999-2000 Dot.com bubble and the 2007 Credit/Housing bubble all had the same hallmark, the F_E_D kept policy rates below the nominal growth rate of the economy for far too long.

We all know about the historic record highs in investor margin, you may not have known , but a new thing in the 1920's was margin allowing investors to put down 10-20% and borrow the rest from brokers. When we entered the Great Recession banks only had about $.10 on the dollar to cover investor deposits, much like our "Fractional Reserve banking" today. And perhaps most alarmingly was the F_E_D's Benjamin Strong who was actively engaged in QE during the late 1920's despite the fact the market and the economy had already recovered. Strong died in 1928 so he didn't see the monster he created, but famously bragged in 1927 that his QE which was the purchase of treasury bonds like now with the intent of driving down interest rates and expanding the money supply (like now) would give, "A little coup de Whiskey to the stock market".

Some of the effects of the 1929 crash which initially lasted 4-days with a loss of -25% and stretched from September 1929 to July8, 1932 included an unemployment rate of 25%, wages fell by -42%, economic growth fell by -50%.

Ultimately it took 25 years for the market to recover the September 1929 highs which included World War II.

In any case, I take this very seriously, but for me right now rather than overlay price patterns that can't compensate for all of the differences between now and then, I take the only objective data I have which is a comparison between 1929 and now on a daily 3C chart and what I see worries me for those who are not a part of the market that can learn to benefit from what's ahead.

 This is the 3C daily chart of the Dow 1929, there were a number of events that spooked the market long before the actual crash.

Looking at the same daily 3C chart of the Dow now, I can only imagine how much worse this time will be, but in that is immense opportunity.
Dow presently.

Quick USD/JPY Update

The carry pair has been flat or in a consolidation triangle since noon, that and HYG's performance, no SPY Arbitrage today, the fact that Cross Asset Correlation was DEAD today as well as the diagonal trendline with no significant pullbacks tells us today was a short squeeze, there's a lot of momentum (if you read the articles on Head Fake moves on the members' site) that comes from a failed move, but these moves that appear by price alone to be failed moves are anything but, these are planned out long in advance.

One of the earliest (not the earliest) of a head fake move was in this post, "Come Monday"  from Friday, January 31st.

This was late day Friday post for what to expect Monday which said...

"In the end I had to go with what I know to be the highest probability concepts and those were all confirming. There were a lot of minor elements (which may be major elements by now or by the time futures close) such as the way High Yield Credit was acting or Treasury Yields, Gold's signals were a big one, the outperformance in VIX short term futures, the 5 min charts of the Index futures (usually these are very clear with a move about to take place-they were lagging more toward a downside move, but not very strongly which would indicate a head fake move as it's not real distribution), the hum-drum sentiment indications, the currency futures were not making a lot of sense, but those were 1 min charts and they rarely will make it through a weekend, but the longer 5 min charts which will last through a weekend, did make sense."


On Monday, Feb 3rd we got the start of that move...
"F" is for that Friday from above, "M" is the head fake move expected Monday which was only a head fake move because there was a defined range of support from the previous week. "S" is where technical traders will place their "Buy to cover" stops as they believe resistance will hold. Technical traders will short a break of that support, that brought in a lot of shorts.

Ultimately though we need to differentiate between a real break down and a head fake move, I already suspected a head fake move because of the way the market uses Technical Analysis against traders and the fact we already had accumulation in the range. As I said in Friday's post from Jan 31st above, "it's not real distribution". 

We were able to identify accumulation pretty quickly telling us it was a head fake move and not a real break down that would lead to significant new lows, instead it was a bear trap, thus the reason the trading portfolio was leaning all long until this week.

This is a 15 min. chart of the SPY backed up to the Monday break and the proceeding evidence of a head fake move as you don't see accumulation in to a real downside break.

There are a lot of reasons to run a head fake move in EVERY TIME-FRAME, but this is one of the easiest ...Doing some VERY ROUGH, back of the napkin calculations based on where we know accumulation was taking place...
If you average the range and the head fake together you get an average price of about $176 very conservatively, probably closer to $175. Just as important for a Wall St. firm, you have a position in size, the head fake move allowed them to accumulate at lower prices as short selling creates a lot of supply easily accumulated and at much cheaper prices and allowed them the supply they need to put together a position this size without alerting anyone, it's classic head fake.

That means once you break above the lower red trendline (resistance that traders expect to hold and thus place their stops just above) anything above $175-$176 is pure profit and with a short squeeze there's plenty of demand to sell your accumulated position in to at higher prices. I'd say a good 50% of the market is HFT that make their living scalping a few cents here and there thousands of times a day, so a $5 or $6 gain is big business, but this is just part of the reasons these head fakes are used.

We've seen the distribution pick up significantly recently, last Thursday as the market broke above the red trendline, 3C action was dead, it makes sense because they wouldn't have been accumulating anything, that was already done and they wouldn't have been distributing anything as the move was just moving in to profit. Thursday/Friday was a different situation entirely and distribution picked up heavily and even worse this week, that's not only selling the longs they accumulated, but going short in to higher prices because in to a short squeeze the one thing they  (institutional money) need to sell short in to (it's the same as the head fake move, just in reverse) is higher prices so their size doesn't drive prices down against their position and demand which is easy to get in a short squeeze.

I suspect there are some mass psychology issues at play here too. Retail has spent the last several years with the motto, "Buy the Dip", that was convenient for banks like Goldman Sachs who were putting nearly risk free QE profits in the market every other day and as such, had numerous quarters without a single trading day loss, however times are changing as are their needs. I suspect there will be a couple different phases, at least until the carry trade is completely unwound and it seems like it's moving more in that direction. Make no mistake though, the market is a zero sum game, they aren't your friends.


As for the USD right now, it's looking precarious, it had to be held up as much as possible today as to not ruin a squeeze, but it doesn't look like it wants to be there.

After the Yellen volatility at 8:30 a.m. we have a small positive divegrence in the USD/JPY which supports the market, actually the market typically follows it as it is the carry trade and where the greatest losses can be felt at 100:1 leverage. However, since noon time the pair stayed in a triangle and didn't make higher highs with the market, thus the feel that it doesn't want to be there, meaning those who still have carry trades open want to buy the Yen back and close the trade, but that would drive the pair lower and pressure the market lower.

We can see a clear negative divegrence in to the afternoon and as of THIS moment, it looks to be losing ground now that regular hours are closed.

Here's a look at what a head fake move (which created a short squeeze as it was a large bear trap) is capable of and about just how far out of whack ES is with it's natural correlation.
The USD/JPY is the green/red candlesticks and ES (SPX futures) is the purple line. As has been the case for a long time, ES is in line with the carry cross through the range "R", the head fake move "HF", the "W" base and then we get the short squeeze as stops are hit on a break above resistance of the range.

Again, this is some quick calculations, but I have ES overvalued by nearly 40 points just going by the normal correlation and I know that the market is not "truly" turning bullish.

As for HYG, it has been used recently although HY and IG credit has been running the other direction (down) to prop up the market as it is been used so often over the last year, that looks to be coming to an end. 

Probably the most amazing thing most people wouldn't notice is how well VXX and UVXY held up today. ES's next significant support zone below is $1812.25 (apparently our question from yesterday is answered as to whether they were shooting for SPX $1800 as I suspected from HYG's use at the close or whether they were trying to make it look like resistance, it's a whole/centennial number which means it's a psychological trap where a lot of orders would be congregated.


In any case, I have updated and am going to look around and see what else out there might be interesting. As I said last night, I don't think Wall St. is going to let the 200-day moving average (SPX) just break and let the market fall lower, this is a major Technical tool and a very predictable one, it's really their chance to set up the greatest head fake of the year, likely of this entire cycle, but I think we are going to need to see what 3C does as we approach or move under it to determine what the plan is.