Thursday, July 24, 2014

GLD, SLV and GDX Likely to bounce

This shouldn't be news considering the earlier post showing exactly the set up for a DUST long which needs GDX to bounce. Taking a quick look at them before the close, I'd say the PM's will bounce with the miners, if not tomorrow (op-ex pin), then I'd suspect by Monday.

I don't see the high probability trade in a bounce, but as posted earlier, the DUST/GDX short, perhaps GLD/SLV as well.

Keep in mind the Billion dollar Gold futures dumps out in the wide open, someone wants those seen and is gunning for lower prices in the PMs, this very well could be to accumulate them at lower prices which is what I suspect longer term for miners.

Market Update

The movement in IWM is what I'm most interested in, this is NOT a slam dunk chart, but it is the start of a more serious move which is the first time it has been seen this week. Considering how fragile everything has been with all of the majors in the red right now when they were no where near an overbought status, I want to start wrapping up positions that have downside risk, for instance the IWM hedge calls.

The other averages and some interesting charts...
 QQQ intraday 1 min

 QQQ 3 min trend, this is the 3C trend I expected when we called both bounces the last two previous Friday's in the "week Ahead" posts, SPY and QQQ first and last week IWM.


 QQQ with an interesting intraday move on a 5 min chart.

QQQ 10 min from the bounce area positive divegrence.

 Like the IWM, there's a lot of difference between 10 and 15 min charts such as this 15 min QQQ. If a divegrence or underlying action is not strong enough or heavy enough such as the 10 min positive divergence above on the QQQ chart, it will not show up here, however the 15 min negative divegrence seems to be plenty strong to show up.

 SPY 1 min since last Friday's bounce call... mainly for the IWM, but with the reality of "A Rising tide lifts all boats".

SPY 1 min intraday is also interesting.

SPY 2 min trend showing some of the damage from the previous week.

And the 15 min chart which is pretty clear on what is already a clearer trend on the longer timeframes, in line with the trends from shorter timeframes.

The SPY daily over the same 3-day period.

 IWM intraday 1 min is not a smoking gun, but it is in line.

 This is the chart that matters to me the most right now, the IWM 10 min which has been behind the call for a market bounce, led by the IWM as  all risk on rallies/bounces "should" be. There's not only a relative negative divegrence just showing up, but it is starting to lead. These small changes are important because they are changes in character that few notice, just as we saw the change in character of SKEW days before it jumped to the red flag zone.

 The 15 min IWM had already been weak and not showing any positive divegrence, I mentioned this yesterday in pointing out the large difference between what would otherwise seem like fairly similar timeframes. This 15 min chart has added to its leading negative position, otherwise it has never moved out of line with the decline in the IWM from July 1.


I also found the MSI intraday interesting as it is typically used to goose the market higher via short squeezes which it has done on the open for 4 consecutive days, but like yesterday it is falling apart in to the afternoon, except much worse than yesterday.

Leading indicators are still not showing anything that I'd call significant other than what has been pointed out in VXX and bonds.

Spot VIX is VERY close to a Rising 3 Methods upside resolution.
The last 5 days have stayed inside the real body of 7/17's candle, yesterday's Doji-Star is a loss of downside momentum and today's candle, while small, is engulfing yesterday's body. This is very close to a candlestick reversal for the VIX and the continuation of the 7/17 candle.


Semi Conductors Look to Bounce

This is an excellent example of a reversal process that is proportional to the preceding trend.

This isn't a trade I'm interested in, but a call position on an expiration not too far out, may be worthwhile,  I'd definitely consider it speculative.
SMH negative divegrence sending it lower and a positive divegrence on the 3 min above and 5 min charts. should bounce back to the top of the recent range.

Closing IWM Hedge Calls

I'll take about a -20% loss, but was ready to take 100% , these were entered last week as a hedge for the SRTY, SQQQ and FAZ position, SRTY/SQQQ are up today, FAZ is not far behind.

There are a few things I see on that 10 min IWM chart I have been focussed on in addition to the Index futures deteriorating rapidly.


Z Charts

The 1 minute is already in a leading negative divegrence, it hasn't moved to the 3 min chart yet, but there's no confirmation on the 5 min which is the first timeframe or earliest in which intraday institutional activity can be observed. In other words, however Z settles, this looks like a parabolic knee jerk reaction and both are very unstable events.
 Intraday the 1 min is leading negative, this just started several minutes ago.

The 5 min chart "could" have confirmed with a 3C higher high with price, it hasn't.

Trade Idea (Speculative Options) Z

The intraday 3C is falling fast for Z, I'm going to enter a speculative (funny money) Z August $158 Put here, half size.

charts coming

Z Update

Yesterday when I posted Z Trade Set-up (swing+) looking for Z to bounce to the trendline or around the area where it was broken as we had both 3C positive divergences and a reversal process in place, I didn't expect it to happen in 30 minutes, but that's fundamental news and discounting...

 60 min Z chart at the target trendline...

And the intraday move over 30 minutes on news  that Zillow is looking to buy Trulia as soon as next week

This is one of those knee-jerk reactions that I am interested in, as in maybe a put, maybe a short, maybe a reassessment, but in either case it's going to take a little time for the knee-jerk to die down and smart money to decide how they feel about it because it's very likely that the positive divergences in yesterday's update were smart money clued in on the potential deal and the move today they are likely collecting on as smart money doesn't chase a stock 20% higher, they are usually in long before the move starts which is likely what we saw yesterday, Z Trade Set-up (swing+)


UNG / UGAZ / DGAZ Update

For a long time UNG has been a long term favorite for a primary uptrend as it has been building a massive base, look at the multi-day charts to see obvious changes in character.

 UNG daily with a large accumulation area in late 2013 , however a clean breakout to stage 2 was never achieved and a lateral trading range deteriorated making me think UNG was going to come down, in fact we had a trade set-up, I first expected a small bounce, that never came, but the larger trade was a UNG short which has been on track, this was from


The weekly chart shows the long term base and a clearer picture of what has been going on there. There have been since regulations passed through Congress which limit any new power plants to Nuclear or Gas, excluding coal as being too dirty. However what the real reason is is still a mystery. I recall homebuilders being accumulated for a year and a half about the time the tech bubble popped, who would have thought housing would lead the next bull market after the tech revolution? Someone knew and knew years in advance.

As for our purposes, we are looking a bit closer to home. The UNG downtrend of July looks as if it's going to put in a bounce at least along the lines of a swing trade, but I don't think the reversal process area is complete so it may even be larger than that. The assets I would consider would include UNG or UGAZ (leveraged long).
 This is the 60 min chart's negative divergence at the end of the range just before UNG started trending down, thus the trade of highest probabilities even though after the initial break of support, a bounce looked to form, but this was on shorter term charts and for whatever reason being a lower probability trade, was run over. I've hear speculation that this is part of try to pressure Russia as they are a Natural Gas giant, but I really have no clue.

 UNG's 15 min chart has been showing signs of a positive divegrence forming and other charts are much more clear.

Like the 10 min chart. In the process of migration of a divergence, the 10 min chart (although not as strong as a 15 minute chart as far as the size of accumulation) will have a stronger looking divergence than the 15 minute until the divegrence is strong enough and the stronger divergence develops on the 15 minute chart and perhaps 30-60 minute charts.

In any case, there's a good start to what looks like a reversal process, I do not think this process is complete and if you are interested in a long UGAZ/UNG trade, I'd set price alerts for today's gap, maybe to the $20.75-$20.50 level.

Typically these reversal process' are larger and proportional to the preceding trend, we'll look more at that, but this gives us an opportunity to get in to UNG at a lower price with less risk.

 As should be the case, the 5 min divergence looks stronger than the 10 min as the migration process is still the same as described above. There looks to have been a quick shakeout below support before today's gap up, I'd be looking for a position somewhere in the area of recent lows/gap or maybe even a little below recent lows. Again, if the trade does not come to you on your terms, there's no reason you have to take it, there's a bus every 30 minutes.

 From the intraday perspective, we can see the timing indication of a positive divegrence below intraday support near the close as is often the case as middle men stock up for a move which , typically, they filled and have knowledge of, a sort of  front-running in the grey area of law.

 The daily chart shows today with a longer upper wick, intraday highs rejected, volume is also rising. I'd like to see larger volume in general at this reversal process as we have already started to see.

 If today's move continues, we'd have a sharp "V" reversal, these are more of a reversal event that are rare and usually on some fundamental event the market is discounting.

This looks like a more reasonable reversal process given the downtrend. It takes big money more time to get positions together, they can't just put them together in a single trade like we can without being burnt by predatory HFT's or collapsing the bid/ask stack.


If you look at past reversals in UNG you'll usually notice bottom reversals are more narrow than top reversals. At #1 we have a wider reversal process, at #2 a very sharp "V" reversal process, but consider the parabolic drop/preceding trend. At 3, 4 and 5 there are also sharp "V" reversals, but all have parabolic moves preceding the reversal. At 6 the reversal process is in line with the preceding trend, the same with 7 , 8 and 9 so I'd expect a little wider lateral reversal process to take place before UNG moves higher, this may also add to the size of the positive divergence as well as our upside expectations.


Quick Market Update

Action today is reminiscent of an op-ex pin with the TICK in a range at the extremes of +/- 750 and even more narrow right now.

I'm using the Index futures as a quick update as they reflect the charts of the averages.

 ES 1 min , you can see the negative divegrence intraday to the right.

 TF with the week's highs sold after the open, a small intraday positive that was also distributed in to

And NQ with a similar pattern, weekly highs sold before the open, distribution on the open and currently.

As mentioned, the TICK (all advancing NYSE issues minus all declining NYSE issues) is nearly flat stuck between -/+ 750 which is odd considering the next chart.

For the 4th day in a row our Most Shorted Index (MSI) was squeezed on the open which produced a reading over 1250 on yesterday's open, but faded quickly as no short squeezes are sticking, we even see the MSI falling off faster than the SPX intraday much like yesterday.

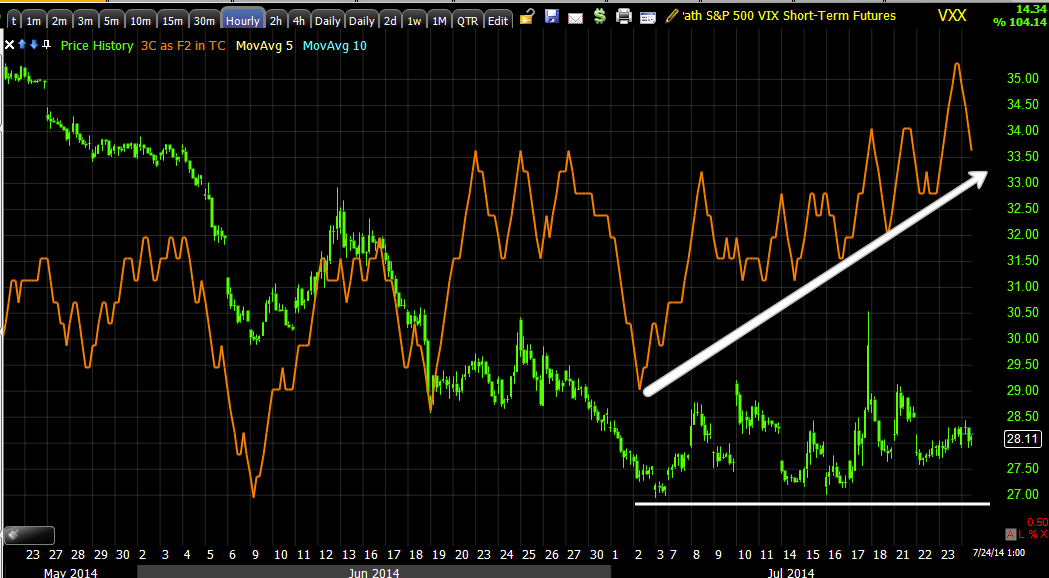
VIX Futures on the other hand, which were out performers yesterday as shown intraday and in the Daily Wrap last night look to be under significant accumulation which is not really surprising given the internals, the breadth of this week on what should be a strong bounce and the spot VIX itself as well as the elevated SKEW.

 VXX 60 min chart, it's not just the leading positive divegrence, but the flat range which is where we most often see distribution or accumulation events. Remember, this is VIX Short Term Futures, a rolling 2-month (this and the forward month) ETF.

As far as the IWM calls I opened as a hedge last week and was willing to take a loss on if need be (if that were to happen, the issues being hedged would be at significant gains offsetting the hedge), I may look at closing these soon and take a minor loss. The market certainly isn't performing in such manner that these look like they'll be very effective.

IWM Hedge/Calls


NFLX Trade Set-up

NFLX has been a longer term short trend trade that I have been a huge fan of for some time, I think it is going to work very well.

I'm already at a full position size in NFLX for the trading portfolio and the position is doing just fine as far as I'm concerned. I can't add anymore unless an options trade sets up, I might consider that, but if you find you like the idea or have a partial position you might want to add to, this is what I'd look for and I'll give you a brief overview of the bigger picture here.

 This is the current position in the trading tracking portfolio, it's down 1.26% which is more than reasonable in a very volatile top pattern.

 I prefer to look at the big picture first, often you can tell exactly where you are in the cycle of a stock. From left to right we have a capitulation event at "C" from the preceding downtrend, the volume and gap down make it easy to identify. As I've noted in the past, the end of a stage 4 decline and capitulation event doesn't mean that a new stage 1 base will automatically form, typically there's some wondering and a move to lower prices despite the selling event/capitulation.

At #1 we have a stage 1 base, it is easy to identify by the rounding bottom and is about a year in length, this is where accumulation takes place for the next stage which is the breakout or Stage "2" Mark-up, this is where a good portion of the easy money is made, also stage 4 as they are both trending stages.

At #3 you can see a clear change in character of price action and the clean uptrend is now a large , lateral choppy range or top, this is a distribution phase as well. What comes next in our cycle (which works on any timeframe by the way including the bounce we are in  now, it has a stage 1, stage 2 and looks to be moving to stage 3 so this concept is fractal and can be used on any timeframe you are trading, you just have to identify the stages so you know where you are on the map to know where you are going next)  is stage 4, decline or a bear market.

 This is a daily chart and the apparent top pattern looks to be a Broadening top, note that ALL H&S tops first start as Broadening tops, one way to determine whether a H&S is likely is by volume confirmation,  a Broadening top has erratic volume and no pattern to speak of whereas a H&S top has a very specific set of rules as far as volume confirmation. As noted earlier, the 2010 H&S price pattern fooled a lot of traders because with all of their new indicators they have forgotten one of the most important tools you have, Volume Analysis.

NFLX's volume is very similar to a H&S top, the price pattern looks more like a 90 degree Broadening top.


This is a quick custom cumulative volume indicator I threw together to help identify the trend in volume vs. price. Like a H&S top, volume picks up on the declines and falls on the advances, whatever the price pattern, this is bearish behavior.


US Manufacturing Biggest Miss Ever, 1 Bn in Gold Futures Dumped, Index Futures Looking Worse, VIX Better

There are a rush of events since the open, New Home Sales saw a -20% miss, the lowest print since this time 2013. US Manufacturing data did not continue the overnight Markit trend as US PMI (Manufacturing) saw its biggest miss EVER! Among components tumbling were Employment which is at 10-month lows while Input Costs soared, the Stagflation meme back in full force despite this morning's initial claims data.

And once again, someone dumped $1 bn in gold futures shortly after the open (which is becoming almost a daily occurrence)...

 Just after the open someone dumped $1 bn in gold futures, Wall St. is quiet about what they do, if this is seen it is meant to be seen.

As far as the PM's and Miners pullback, my first instinct as it has been is that a pullback is necessary for GDX to breakout of its large stage 1 base...
GDX daily chart with an Inverse H&S bottom, volume confirmation is even more important in a H&S bottom than a top, in 2010 a lot of traders were burnt shorting a H&S price pattern that had no volume confirmation.

At A we have the head of the pattern, at B a head fake move which is where we went long NUGT for our +40/+50% trade before exiting expecting a pullback. "C" is where the breakout occurred, but it was suspect from the start with distribution and the most important area of volume confirmation was not there. My assumption has been it was a shakeout as GDX was just starting to attract retail longs , most of whom entered on the breakout which has now failed. I still suspect a pullback to gain a head of steam before GDX can breakout to stage 2 mark-up. Also since QE has been phased out, the market is going back to the old pattern of miners leading gold, unlike during QE where they lagged horribly.

With inflation still a hot item, I still believe the highest probability is a pullback, gather shares/accumulate at lower prices and make a strong breakout, but the length of time this pullback has taken has forced me to consider whether the market has reconsidered the Gold/Miners run as the F_E_D will likely act and act quickly to stem inflation once they stop pretending its noise. The only way we'll know for sure is whether there's accumulation on a pullback so that is the larger trade, although if we can find an entry in DUST, I wouldn't mind a swing position there.

 This is the Russell 2000 Index Futures, now leading negative out to a 15 min chart, note distribution at each of the highs successively stronger. You can also see the final accumulation phase from last Friday, which we saw and posted...Market Update / NEXT WEEK,

"As I have thought all week, I think the IWM has to bounce before anything else on the downside happens. The IWM is down -6.28% for the month and almost a straight line decline, a bounce here would not be anything out of the norm."

 The NASDQ futures are not looking great either, yesterday seems to have been a significant distribution event in the move.

And NQ 15 min probably needs no commentary.

This is the IWM trend since calling for a bounce Friday with the last bit of short term accumulation, the distribution trend in to the bounce is pretty clear.

 As far as opening indications, nothing too strong, the IWM looks rather dull here, but not any strong signals on the open, the other averages are similar.

There has to be higher prices to sell in to...

 This 10 min chart is still the main focus, but as we can see by the 15 min chart which shows the larger underlying trend, distribution has been the theme.

 We are also getting that "normal" bounce" look that is present in a downtrend of lower highs/lower lows.

The highs on the chart are the top of the right shoulder.

And the daily VIX's bullish Rising 3 Methods has held, this capture is a bit old now since the poist takes a bit to put together, but the way it looks here, it looks like it is almost ready to blast higher.

I'm going to spend more time today going through watchlists as I have said since posting some of the stocks we are looking to short in to, "We need a bounce in them and when the IWM starts to fail, that's when we want to enter".

With the look of Index futures and VIX, I think it's time to get a temperature on the trend among watchlist stocks, they'll usually give a pretty clear indication if you go through enough of them as to where we are in this process. The daily updates may be a bit quieter today as I go through several hundred stocks on the watchlists, but if I see anything that is worth noting, I'll have it out to you ASAP.