Thursday, March 20, 2014

Daily Wrap

It's a little tough in certain areas to look at the predictive assets such as FX futures when the algos were shut down yesterday, just look at USD/JPY vs ES yesterday after 2 p.m., have you ever seen them go in totally different directions to that extent over the last 2-3 years? I doubt it, as soon as that uncertainty hit the market, they shut down the algos, it seems that even the VIX/Market algo was shut down, although we could just be seeing a solid bid (real supply demand dynamics) in the asset which is a move to buy protection or a flight to safety.

At least one correlation algo has been restarted, AUD/JPY, note they don't want to get near the $USD right now as it popped which is the same reaction it would have had a year ago if disappointing QE news came out, T's fell and gold fell, all the same reaction the market would have to say the initial announcement of the QE taper or a possible rate hike.

I gathered most of these charts around 3 p.m. but I don't think there will be too much difference, I'll try to recheck them in case there's anything substantially different, but I doubt it would be anything that would change anything presented below.

As for the carry trades (JPY based... and watchout this weekend for potential trading desk failures out of China as they were ultra leveraged the CNY thinking it was going up forever, it got hit -.5% overnight on another default today of a steel mill so some of those trading desks just lost their jobs and accounts)

 USD/JPY in red/green and ES (SPX futures) in purple, note there's no correlation, if there was they'd have to run the SPX up and they don't apparently want the risk of doing that so they've stayed away from the mainstay Carry trade.

The EUR/JPY got smashed as well because of $USDX strength against anything it's paired with, that means the EUR/USD got slammed, thus the Euro doesn't look so hot against the Yen and this pair is obviously weak.

Remember earlier today I made a half-serious joke about the HFT arbitrage/correlation firms working all night...

"Overnight all correlation algos were turned off as the $USD trounced every pair, the USD/JPY should have sent the market flying higher, but the big algo firms shut them down and are probably re-callibrating them or spent all night doing so as all correlations are dead."

Well guess what, I wasn't that far off, what pair did they chose? AUD/JPY...

 By the 9:30 open it seems they had the correlations reprogrammed in AUD/JPY as it's nearly tick for tick after the US open.

These firms make big money, they spend big money to get microseconds faster than competition, being down overnight or through a trading day is a major loss.

As far as the AUD/JPY pair and 3C, I was seeing a bit of a negative divegrence in the pair and it has continued lower on that divegrence since this capture, now trading  from 92.68 to 92.57 which is just around the 10:30 a.m. reaction high.

If this pair continues lower it should take Index futures/the market lower as it is the only correlated carry trade with ES right now, they can't touch $USD because of the gains it put in on bad F_E_D news (at least that's what the dollar has done the last 5 years when the market is disappointed with F_O_M_C policy).

Now that we have a pair, we can try to predict where it's going using the single currency futures such as $AUD and JPY.
 This was what $AUD 1 min intraday looked like (that's about 11 p.m. last night to the far left to give you some idea of scale, you should be able to click on the chart to enlarge it).

 As far as the 5 min chart (and I don't trust 1 min charts to hold up overnight, a 5 min is more anchored and can hold overnight)  it "looks" like the $AUD is under a little accumulation, it "looks" like a small reversal process in place (U-shaped with a small head fake move). If this is the case, then the PCLN signals from earlier today would make sense, since they were so short in duration I decided if I play them I'd need leverage to make the risk worthwhile. 

Much in the same way, if the $AUD was going to lead the Index futures higher, it can only go so far on a gallon of gas, that's about how large the duration of this reversal process would be and they are almost always proportionate. A positive divegrence this size in $AUD would fit just about right with the duration of a PCLN long, very short term, but perhaps long enough for Window Dressing considering the t+3 settlement date would be Wednesday for quarter's end.

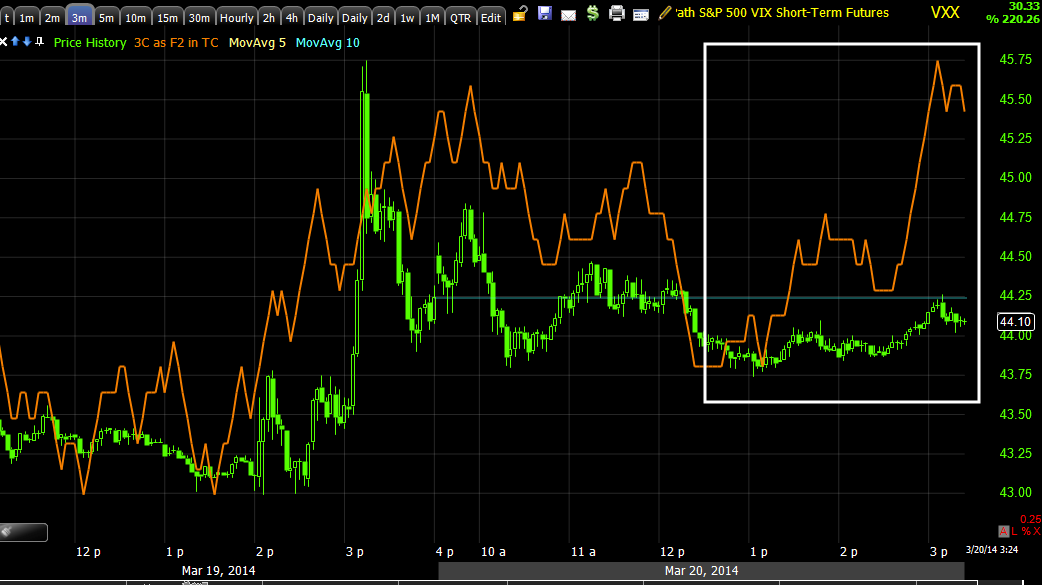
Is this a big deal "if" it holds, no not at all, it's a chance to make a little extra scratch and a chance for VXX to put in the flying (stronger than leading, and only seen in VIX assets) divergences that are such fantastic timing markers, whether going long VXX / UVXY or shorting the market and that has been the focus of this entire week.

In my view, any cycle that we have seen this week which we have been looking for, but VERY specifically prepared for last Friday by closing all puts (most) and opening a couple of long call hedging positions which was perfect timing, was not like past market cycles that were meant to move sentiment and emotion like the February rally, in this case I feel very strongly that the long term positive in the VIX futures is close to breaking out and when we have a long term divegrence like you'll see, we always return to the short term charts as a timing indication which again, IS WHAT THIS WEEK HAS BEEN ABOUT, it's just the market and VIX trade mirror opposite (usually-today not so).

Leading Indicators... *Leading Indicators are compared to the SPY/SPX in green unless otherwise noted
Here we have what we knew a week and a half ago was going to be the manipulation lever to move the market, HYG, because of the POSITIVE divergence in HYG, I expected this week's move up since Monday to have occurred last week, that wasn't the case, but eventually HYG did manage to pull the market north and as I stated, it's my view and was my view before the move even started that this move in the market to the upside wasn't meant to do anything other than push VIX futures to the downside where they could be accumulated on the cheap and thus far they have been.

Since last Friday to today the SPY has moved +1.68%, this is what we were looking for, but not for any market average head fake move, for VXX accumulation which is done on a decline which has been -7.24% on the week since Friday's close.

Today HYG is CLEARLY underperforming the SPX which is a show of weakness in the market lever to lift the markets, remember we first saw distribution in HYG Tuesday, Wednesday it was huge comparatively and now we are seeing it in price.

HYG is fantastic for fooling the algos in to thinking that institutional money is taking a risk on stance and it's a lot cheaper to move one asset (HYG) that is correlated via algos, thus letting the algos do all the work of moving the market than to accumulate enough of each of the major averages and their most weighted stocks to move them. There's another advantage as well, if you are trying to sell of short the averages in to higher prices or demand, you need to invest so much in the cycle, that means you need to first sell all of those accumulated shares that were bought just to make the market move before you can ever get to net selling or short selling.


 Here we have High Yield Credit vs the SPY/SPX.

The reason we use HY Credit as a leading indicator is because it is used as a "Risk On" asset by institutional money, but almost exclusively by institutional money. How many of you have traded credit? Furthermore the credit markets are much better informed than the equities market, thus the Wall Street maxim, "Credit leads, stocks follow".

Unlike High Yield Corporate Credit which is very liquid, High Yield Credit above has NO correlation to market manipulation, thus it is a good proxy for HY credit in general as HYG does have a correlation asa market lever on its own and with VXX and TLT as part of the SPY Arbitrage.

The point in this chart is that we went from in line vs the SPX last week to the SPX's pop this week and credit didn't bite, it sold off  at the red arrows rather than follow another risk on asset, equities, that's why we use it as a leading indicator.

 This is a more specific look at HY Credit today vs the SPY, it's selling off as the SPY bounces on what I expected yesterday to be a dead cat kind of oversold bounce. Why would credit go risk on if this is just an oversold bounce?

Pro Sentiment Indications...
Today we saw early selling in sentiment and again later larger selling, pros are not following along in a happy song.

Our second sentiment indication we use shows the same except more acute, they didn't buy in to the oversold bounce at all.


As far as VXX or Short term VIX futures, we normally would have expected some downside with the SPX up a bit, at first I suspected that the correlation algos for VIX/SPX were also shut down, but looking more closely as the day went on, it looks like one of the rare instances in which actual demand pushes prices above where they should be according to the correlation model and that's what we saw today in VXX, there was demand for protection.

*I inverted SPX prices (green) to show what the usual correlation would have been since the VIX and SPX usually trade mirror opposite, if the correlation were exact, these two lines would move exactly together, but they don't VIX futures are bid enough that demand is pushing price above the algo controlled correlation.


 Yesterday Treasuries got hammered which sent yields up given us an unreliable leading signal there, this is how treasuries have reacted over the last 5 years when disappointed with F_E_D policy or concerned, $USD up, Gold and TReasuries down, when they like F_E_D policy it's $USD down, gold and Treasuries up.

Today however we did see a flight to safety in treasuries as they outperformed the correlation vs the SPX which is also created by inverting the SPX's price.

 As I just mentioned, because Treasuries got slammed on the policy announcement yesterday , one of my favorite leading indicators, Yields moved up making it look like it was supportive of further risk on moves in the SPX, but this was a natural reaction as yields move opposite Treasuries and the fact T's were slammed sent Yields higher, t was not a leading signal, just an anomaly because of the F_O_M_c.

However today as there was a flight to safety bid in Treasuries, we saw Yields remain as flat as can be even though the SPX gained ground, thus we have a slight negative dislocation there, not so obvious, but if you look at the trajectory of both today you can see the non confirmation in Yields.

 This is a closer look at them intraday, you can see they are actually selling off as more protection is bid in the flight to safety trade in to treasuries.

 I found this chart of commodities vs the SPX very interesting, I don't think this had too much to do with the F_E_D even though precious metals were down, but there were down yesterday as well, just a bit more today.

What I think we are seeing here is a reaction to the overnight default by HighSee Group  Steel on  CNY3 billion of debt. This is the second or third default, China via banks and local governments have always come to the rescue of companies ensuring no defaults, Chaori was the first, thus investors who thought they had a risk free lunch ticket quickly found out that they are in big trouble.

Furthermore, the shadow banking system in China has been one of these companies pledging commodities (like steel, iron ore, copper which has been ruthlessly hammered) in return for capital, now the banks that are flush with capital as evidenced by the low shibor rate are not lending, they are not doing new deals as dozens have been cancelled since Chaori and  THEY ARE PUTTING IN CASH CALLS ON THE LOANS, THE COMAPNIES HAVE NO ALTERNATIVE BUT TO RAISE THE CASH BY SELLING THE PHYSICAL COMMODITY, just look at copper recently. In any case, since we didn't have that big of a move in Gold today vs yesterday it seems clear to me that the default of another company has caused wider cash calls and more commodity selling to raise the cash the banks are demanding.

This is why I talked about Aluminum as a possible way to play Chinese weakness without chasing copper , AA, ACH, etc. as those are commods that haven't been hit yet, but this wave of defaults is just getting started and it should push global commodity prices lower.

In any case the point here is the problems in China are far beyond most people's understanding, they are literally having a Bear Stearns 2008 moment and we'd be wise to get in front of this where we can.


 HYG as mentioned yesterday saw increased negative leading divergences, that continued today so I think we are getting close or are at the end of the market manipulation lever's support of the market.

 The 5 min chart is what I wanted to see go negative, it sure did fast yesterday and added to that today.

 Ultimately the HYG divergence that we saw before hand and knew this was going to be used to move the market (thus all the repositioning last Friday) only reached a 10 min chart, once the divergence there is destroyed, the market has no more support and as of now, HYG was leading 2 days ago, it's now any longer.

VXX saw accumulation today even though it didn't move down, that sounds like fear and real supply and demand which is rare to see, but fear is the strongest emotion.

 3 min VXX today

And the increasingly leading positive 5 min VXX

This is the long term VXX accumulation that was heading higher when it should have been moving lower during the Feb. rally, the large position is in place, this is why we have returned to short term charts this week looking for the timing, because a large position has already been accumulated and was done so during the February rally which should tell you something.

As for the ramp in Financials today, the F_E_D's bank stress test results came out and 29 of 30 passed, so I wonder why Financials would rally +1.63% in front of a wild card unknown? Usually they'd be flat or selling of in anticipation of the release, unless...

Hey, stranger things have happened.  There was some intraday distribution in the sector especially in to the 2 p.m. hour, I imagine this will present a trading opportunity just because of where the larger trend is and the probabilities, but I don't think we are there quite yet.

 The larger trend /probabilities on the 4 hour chart, but also on numerous other timeframes.

XLF/Financials intraday...

What adds credibility to the trend above and the probability financials set up a nice short based on probabilities is the fact that financial Credit was not buying the move that equities were today.
There's a notable divergence between stocks and credit, which one do I trust? I think you know.

Finally as far as futures go as of now, which of course is very early...

 ES intraday 1 min tonight thus far with a negative, this usually won't hold overnight, but the 5 min is much better in that regard.

The 5 min is showing distribution on every attempt to move higher.

I'll check futures again later tonight and see if anything is moving or new correlations back on line, don't forget volatility tomorrow as we have Quadruple Witching options expiration and we also have window dressing in to the end of the first quarter.


3C Charts Update

I wanted to get this out earlier , we've seen the negative divegrence forming all day, but as it got worse I hoped to get this out, I was just in the middle of collecting Leading Indicators.

Whatever the outcome of window dressing and I imagine that's a tough call for any manager with everything else geo-politically as well as the new F_E_D dynamic, this is what we are looking at in 3C, I wanted to show you that trend expectations have not changed, not for the very short term (VIX accumulation as a timing signal for a market downside pivot) or the larger picture of the February short squeeze being used to sell in to or short in to by smart money.

I think a lot of correlations will change and this is why I've said for some time now, "Whoever figures out the new dynamics first, wins", but you need an edge, you can't follow moving averages and hope to beat institutional money and I think we have that edge.


 SPY 1 min intraday just seeing more and more distribution and it looks like it's taking hold so the oversold bounce from yesterday's lows when I closed the IWM puts looks to have been just that, Pros were buying blood in the streets and selling in to a bounce, they didn't change their mind and go bullish on the market, certainly not after yesterday's events.

 The migration of the divergence off the bounce or oversold bounce on SPY 2 min which was not there earlier today as it was in line you may recall.

The 3 min was negative, it just got worse, so there wasn't enough accumulation of the capitulation lows yesterday to reach a 3 min chart, that told us it was a small position relatively speaking and that's the reason I'd protect put profits, but not take the risk of being long, just not worth it.

The additional leading negative today just shows there's more selling since this never went positive yesterday so today's selling was added to what was there yesterday.

As far as our very early Feb. prediction or expectation that the very strong rally up would be used to sell/short in to for the next trend (down) which would have more volatility as the past 2 have shown, is confirmed above on a 60 min SPY chart for the Feb rally/short squeeze. Stage 1 was the head fake/base , stage 2 is mark-up, stage 3 is distribution/top and stage 4 is decline, that's what this week has largely been about, tracking the specific turning point via VIX futures as well as some other things like HYG, etc.

So you can see the major damage on the chart is still there, nothing has shifted overnight that would cause me to lose a wink of sleep, in fact I'm trying to get as much funding as I can set up in my account to take advantage of the next trend as fear moves a lot faster and further than greed.

Markets fall harder than they rise and faster.

 QQQ intraday 1 min getting worse, remember I wanted to see PCLN fall below a trendline lower, well this is what needs to happen for that to happen, but we'll have to look at the charts again and see if PCLN is still a potential trade, but remember it was being considered using options which means, SHORT TERM.

 QQQ2 min intraday seeing migration of the divergence, the bloody lows bought by pros are distributed today very clearly.

 The 5 min shows a lot, but you can just look to the far right and see the leading negative increased today out on a 5 min chart.

 And of course our big picture in the Q's, leading negative distribution as was expected on the Feb rally , which we not only called while everyone else was bearish and thinking SPX 200-day was going to be broken next, but we also called that it would be a rally that is distributed , it is a specific cycle set up for a specific function, a means, not an end.

IWM intraday has been horrible leading negative and it's reflected in price, that's why I keep picking on it and that grew worse today.

Same with the 3 min seeing migration today.

 Again leading negatives today on the 5 min nearly at new leading negative lows.

And the big picture of the Feb rally, that divergence should be screaming at you, those are the ones I NEVER IGNORE.

I'll have leading indicators out after the close, but so far so good, if we do get some bounce signals which we don't have yet except in some specific assets, we can hedge easily and make some extra $$$ doing it, if not then we stay the course, keep looking for the specific timing of the pivot and load up the truck if you haven't already.

Market Update

Finally those intraday negative divergences are looking like they'll start showing some downside. I'll have to look at assets like GLD, GDX, PCLN etc. as this move unfolds.

Even though VXX didn't pullback today as much as I would have like to have seen, it maintained steady accumulation/bid all day, there's some people looking for protection, but there are several events all culminating at once.

As I wrote a member...

"very short term, I think we have to be a little more patient, especially with Quad-witching tomorrow and the end of the quarter window dressing, there's a lot of games played on either one of those, with both it's insane and price often means nothing during that period, like I mentioned about window dressing, they aren't moving positions because they are interested in them, they want to look smart for the new prospectus and show they have the stocks that performed well through the quarter even if they only held them the last 3 days of the quarter, most people just see they have the stock and think, "Oh, that stock did well last quarter, they must know what they are doing", that's why we call it, "The Art of Looking Smart".

HYG saw additional distribution today so short term there's a lot of events that can cause quite a bit of volatility, but as far as what trend expectations and market expectations have been (distribution of the market, more importantly accumulation of VIX futures and distribution of the market manipulation lever HYG), that's right on track.

I have some charts I'm going to get out that include leading indicators, etc. Some of these may be a bit behind as the market moves, as it takes some time to capture, load and post them, but they should remain relevant in their point.


Quick Market Update

It looks like we are FINALLY going to get an intraday pullback which I'm most interested in right now for entries in to positions like PCLN.

The Index futures are in line and not showing the same as the averages, but that's fine. I'll use the SPY as the main example and show a few others.

 1 min SPY intraday negative divergence should pull the market back a bit.

At 2 min it's in line so not a major pullback here.

At 3 mins it's still negative so any upside thus far today has not been significant either as far as underlying trade and our trend expectations .

This is the 1 min QQQ, you should be able to see the negative divgerence pretty clearly.

This would be most useful for an entry in to something like PCLN calls which I want to hit on price weakness/3C strength.

This is PCLN 1 min as it was when I featured it just a bit ago as a trade idea and ...

The 2 min has joined so I think there's a good chance we get a shot at this one.

I think this is all window dressing only, either they (fund managers) don't have it and want it for their prospectus to make it look like they were in the right stocks or are in the right stocks or they held it and want to get max gains out at Quarter's end for the prospectus as well, it doesn't change the larger core short in any way.


PCLN (Possible) Trade Update

There's no way I'm letting go of PCLN core short positions (equity) so that's not even an issue, I'll show you why, but I may VERY WELL enter a call position which is looking pretty interesting, but for newer members you should know I really don't like leverage as much as you might think and only use it as a tool, not a trading system. 

I use leverage when I see a good looking trading signal, but threre may not be enough profit potential in the equity position alone, for example, there may be a 2-3 day base that's going to pop to the upside, well that move may be worth 4 or 5 % as an equity long position, that doesn't really interest me to take the risk for that return, but if the signal is strong enough that it really looks like it will move, then I'll use leverage - options in this case, which I prefer to buy slightly in the money with at least 2x more time than I think I'll need. I'm not trying to hit triple digit home runs, I'm trying to use the leverage as a tool to make what looks like an otherwise excellent probability trade work as far as profit potential. I'm usually out of these positions ASAP, that means before the first significant pullback or slowing of momentum so these are not held for home runs, that's an easy way to go broke, but once in a while they are held longer than planned, which is why I go for the extra time, as long as the 3C signal is still good, I'll stick with the position even if it hasn't fired off yet, if the 3C signal is fading then I'll take my lumps.

Here's what I have on PCLN, it looks like it has a decent chance for a decent bounce, but in no way would I let go of trend/core/ equity shorts there because of a bounce.

Remember that we have Quad Witching tomorrow and Window Dressing (the art of looking smart) as it's quarter's end so there could be some funky volatility around that which has NOTHING to do with the overall market or response to the F_E_D.

Wednesday March 26th is the T+3 day for the quarter (Trade plus 3-days for settlement) so there are some forces, influences at work that are transitory, that may be why PCLN is looking decent short term as it has a 13 or so% gain on the quarter and managers will buy it art the end of the quarter as window dressing to make it look like they held it the entire time, "The Art of Looking Smart".

 This is the 4 hour chart, PCLN has big trouble/distribution here, this is why I'm not touching the equity trend short.

I included a few other timeframes just for good measure like the 60 min leading negative

Ad the 30 min shows where PCLN made it's move on some accumulation and the distribution since, that was in my view a larger head fake over some stiff resistance that caught the eye of a lot of retail traders, the $1200 centennial psychological area didn't hurt either on that front making it easier to distribute in to demand. There was a head fake as usual right before the move started running stops, which just gives PCLN more momentum for the move up and then snowballs to a short squeeze.

#1 is the area of interest right now with a small "W" like base good for a counter-trend bounce.


This is the area of interest on a 15 min chart and there's a nice positive leading divegrence there, not much past 15 min so it's not a threat to the short position, but it's decent looking enough for a long , I do prefer some leverage to increase profit potential though to take the risk.

Normally I'd expect a run below the yellow trend;line where there's a "Tweezer Bottom" candlestick support area to the left, a head fake under that trendline would be a perfect set up for a call position on the move below the trendline so I'll have price alerts set there and that may be the deciding factor for me as to whether or not to take the position, it's a much better entry, lower premium, lower risk.

 The 10 min chart with positive divegrences as well as a leading positive, this is where I really get interested as the leading positive is showing growing strength in the divergence.

 The 5 min positive just reinforces the confirmation of signals across multiple timeframes and raises the probabilities of a successful trade.

 And intraday the 3 min leading and positive at the day's lows.

Here's where I think we might get a better entry.

This is the 1 min intraday going negative and looks like a pullback coming intraday, perhaps below the trendlline?

Since this capture this intraday negative has moved to (migrated) the 2 min chart so a PCLN pullback intraday looks increasingly probable. If we can slip in under the trendline with confirmed accumulation, that would be a choice entry. Otherwise I'll set price alerts for other levels below as I rec'd you do if you are interested in the possibility.