Wednesday, July 17, 2013

INTC Earnings and 3C Chart Follow Up

Earlier today I was asked to look at INTC to see if there was a possible leak before earnings. The last I saw INTC was trading down -3.31% after earnings

We did a test here at Wolf probably over a year ago (or more), but the point was I had seen in the past leaked economic reports as 3C made clear and leaked earnings so I wanted to prove it to members. I can't remember the exact number but I believe it was ultimately 22 stocks that were picked based on abnormal 3C charts before earnings (GOOG was found or rather didn't give a signal until 15 minutes before earnings) and the charts and direction the stocks would trade in were posted before earnings came out.

3C would have no way of knowing whether earnings were a beat or a miss because even with a beat, if guidance is weak, the stock will sell off. We were just looking at the pre-positioned players that obviously knew what the reaction to earnings was going to be and most likely by leak. Out of the 22 stocks that were selected, 19 were correct, it was just about a 90% win percentage. 

This isn't as easy as, "Hey, XYZ is reporting tonight, which way do we play it?". In fact, I looked at hundreds of stocks to select those 22, but when you saw them you knew something was not right with them.

 I always say, "With 3C it's not whether you can decipher the most probable outcome, it's when those signals jump off the chart without trying to read the Tea Leaves in which we find our greatest edge".

INTC had some pretty strange charts that did not look good going in to earnings, however they weren't to the degree that we've seen before and the short term signals didn't fit with the longer term signals and I hate positions in which all of the signals don't move in the same direction for the highest probabilities unless they are like that AAPL +50% 2 hour trade.

In any case, Intel missed on revenues, but worse than missing,  INTC Cut Guidance. The market isn't about what you have done, it's about perceptions moving forward, INTC is probably in some deep trouble moving forward and we'll keep in on the watchlist for a high probability/low risk entry.

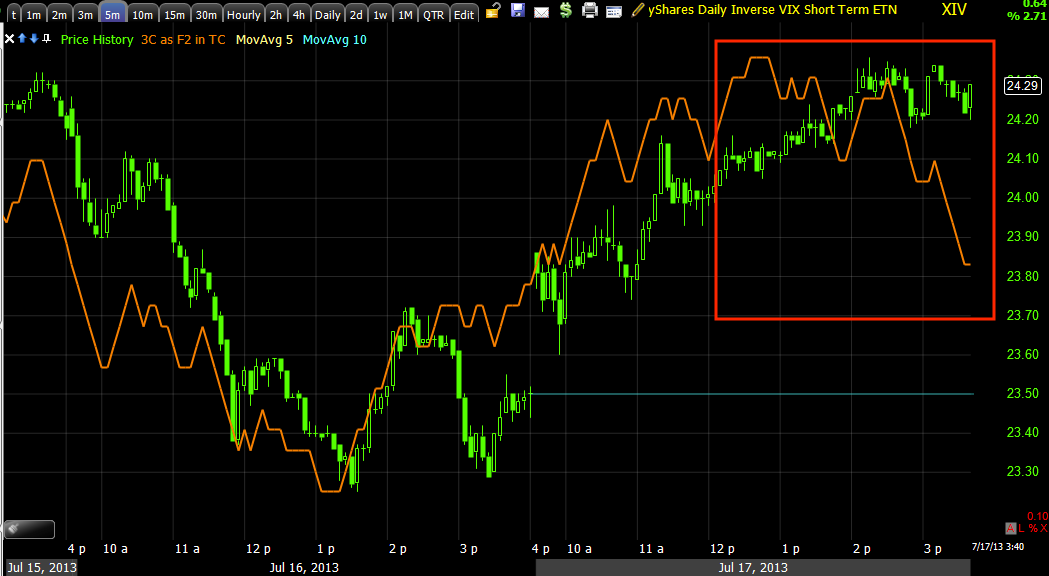
I'm showing you the 4 timeframes that showed clear distribution, it was strong, it was fast and recent (the last 2 days).

 INTC 1 min chart, you know how I say accumulation and distribution are most often found in flat ranges? And how about, "80% of reversals are preceded by a head fake move" which is in yellow as INTC briefly looked like it was breaking out of the range. 

If you want to understand why head fake moves are so important for timing and what their purpose is, how we use them for better entries and exits, then check out the two links, "Understanding the Head-Fake Move" linked on the member's site.

 The 3 min chart shows a VERY clear leading negative 3C divergence, at the same area as well and the head fake is evident.

This is a longer trend of INTC from distribution to accumulation which was likely just there so they could lift INTC to sell in to before earnings.

That's a very strong leading negative divergence on that timeframe, but nothing compared to this...


INTC 15 min 3C chart, we rarely see divergences this sharp, this fast, that's massive distribution.

Now you know how level the playing field is, but at least we have some tools that rely on an uneven playing field.

I'm going to a dinner engagement and I'll see what's happening with the futures when I return. There are plenty of good positions setting up or in place now.


AAPL and MCP P/L

AAPL was a long equity position that I believe will see more upside as I think it's part of a bear market counter trend rally (specifically in AAPL). However near term I decided that some of the charts I expected to hold up, just didn't and that holding this position (even though I intend for it to be a longer term position) would at best be opportunity cost and at worse, the loss of the recent gains. I actually called this out as a sell Monday, the AAPL Calls opened Friday late in the day and closed at 10:45 Monday morning had about 2 hours of market exposure and made +50%.

I never posted the P/L for the equity position or today's MCP equity position.


AAPL


At the fill of $429.76 the AAPL P/L came out to almost 7.5%, that's most of the move from AAPL's recent closing lows.

I decided to take half the MCP position off today and probably use a trailing stop on the other half unless something pops up, I do like MCP a lot as a longer term long position and although I really miss just putting a position like that away and not worry about it, I have to try to get you the best entry and exit areas I can.

MCP


At the $7.24 fill the gain came out to be a little better than +10.75%, we ended up closing this about $.08 off the intraday high.

MCP's closed out trade today.

For now I'd rather use a 15 min/50 bar m.a. as the stop, perhaps I'll use the trend channel at some point. If you want to tighten the stop up the 10 min 50-bar works pretty well here too.

MCP 15 min 50 bar m.a. as a stop, this should move higher and locking gains pretty quickly.

Energy / Oil

XOM ( already a core short - long term) position is looking really good, I think it has a little more time, but I don't think very much at all.

USO actually ended the day looking great to me, I don't really care that much about intraday price movement as I do about seeing continued confirmation or said another way, continuing to see what I suspected.

XLE is probably a position I'm better off not taking because of the correlation (USO puts and the position split with DTO long, one for the juice and one for the possible trend) although correlation in this market is basically down to two categories-"Risk on" or "Risk off", but I still cover it for members. ERY is a leveraged way to play XLE short with an equity (ETF) rather than options.

The difference between USO (WTI-West Texas Intermediary crude) and the Energy sector like XLE is that crude is just 1 form, there are many such as nat gas, coal, there are services like drilling, exploring, transportation, it's an entire industry vs a single type of energy.

So here's what we have, DTO and USO remain open.

USO
 This is the hourly chart, the divergences here are some of the most significant of any most timeframes, it takes quite a bit of underlying action (accumulation or distribution) to make it to charts this long.

The white area is of course accumulation which as almost always (98% of the time) is either in to lower prices, or a flat/range bound area), accumulation is almost never what retail thinks when they see price jump and volume expand, they think that's smart money accumulating-NO, they were in long before retail even though about the asset.

There's some distribution coming out of that area, the first peak is not distribution, it would be the second and that is where it starts, remember the other thing retails gets wrong is in assuming that institutional money can just move in and out of positions like we can-it can take them months and in some cases like home-builders around 2000, more than a year.

At the yellow areas I'm pointing out there is no significant accumulation in USO at either area so a lot of USO's gains have been because of conflict in the MENA region, not driven by institutional investment.


 The 30 min chart confirms the same as above which is important.

So does the 15 min chart so at this point we may not have a multi-year trend ready to unfold, but this should sponsor a significant move to the downside.

Starting now from the earliest charts and meeting in the middle, the 1 min chart  shows price/trend confirmation to the far left as 3C should move with price, then price moves up and 3C down, that's distribution and if you look at the period, it's very similar to the 30/60 min charts, this is excellent confirmation.

Here's the intraday chart on a close up today...
 First we have a relative (large relative) divergence (even though leading divergences are stronger), this is a large relative. Look at price and 3C and their relationship to each other to the far left, then in the middle price moves up significantly for this timeframe, but 3C refuses to make a higher high, that typically means there's money coming out as price moves up, then we have a 3rd high near the close at the same level and 3C is leading negative to the downside.

In fact CL (Light Sweet Crude FUTURES) did nearly the exact same thing as USO.
9:30 to 16:00 is the New York normal hours, note the leading negative divergence at the same area as USO to the far right late today.

That is excellent confirmation between an ETF in multiple timeframes and Crude futures themselves.

 USO 2 min is showing the same, the very last move today in price and 3C is the worst of the series.

 The 3 min trend, again similar to the 1 min trend (divergence) as well as the 30 and 60, while shorter timeframes have more details, they all agree on distribution starting in the same area, excellent confirmation.


And the 5 min chart meets us in the middle with the longer term (trend) charts, again there's a very obvious and sharp leading negative divergence at the highs near the close today.

As far an XLE or Energy goes, I'm not convinced on the timing yet, but to give you an example of perhaps the kind of trend we'd be looking to trade, see if anything sticks out on this chart of XLE/ 3C
XLE 15 min Trend

Went W/ Aug $20 XLF Puts

Like FAZ long Financials (XLF Short)

Whether options or FAZ (3x short financials) some of these charts are looking too good to pas up.


INTC Earnings

I can't get the charts out in time I don't think, as far as earnings, I can't say if this is a leak because it's similar to a lot of the market, but short term INTC's charts do not look good.

I'm not taking a position because some of their longer term charts (and I hate trading against the longer term indications) look good.

I'll have the charts up ASAP, but there are some very ugly near term INTC charts, if the market were acting bullish today and the signals were, I'd say INTC was definitely a negative leak.

VXX / UVXY (Short Term VIX Futures) and XIV (VXX inverse)

So the volatility ETFs, VXX and UVXY (which typically move opposite the market-I only say typically because the relative performance can be vastly different) were showing good signals on the short intraday charts from yesterday's bounce accumulation), it was the 5 min charts that were stuck, VXX/UVXY were not seeing accumulation as they should, XIV was not seeing distribution.

The longer term trend represented on longer charts like 15 min (plus) show the longer term position has already been put together.

The charts.
 UVXY 1 min looks great today.

A zoom in look shows a small range with an even larger leading positive divegrence, I love these flat ranges, they are so productive.

VXX 2 min also with a big leading positive move.

 Here's a 3 min of XIV starting to get really igly (trades opposite of VXX and UVXY and with the market), there was no way this kind of negative could stay on the 3 min without seeing this on the next timeframe, it's too strong.

VXX 5 min starts leading very positive very quickly.

 XIV starts leading very negative very fast -5 min

The longer term trend or the core of the position is already in place, the short term charts are like the primer to get it moving.

QQQ Charts

Aug should be more than enough to cover these signals, but I doubt we even need that long, I just prefer quality.

 QQQ 1 min intraday - remember new divergences (even from our intraday positive leading to the bounce off the lows to today) start on the 1 min chart and grow from there. The 1 min shows no sign of a positive from yesterday as the scale of the negative leading divergence in place overwhelms it.


 QQQ 3 min shows distribution, yesterday's intraday accumulation for an intraday bounce (remember it wasn't a lot accumulated, it can't support a large move) and today this is now going relative and leading negative. The longer term trend is much worse.

 The 5 min QQQ saw very little action (positive) from yesterday, the leading negative divergence here shows a clear change in character and quite strong, at the right spot as well.

 QQQ 10 min longer term, just to show the longer term chart even shows this last move as a distribution move which is what is was always expected to be going back in anticipation of this move , what? 4-5 weeks ago?
 We are also leading negative here. If I had to take a position and not look for a month, I'd certainly take this one short.

QQ 30 min shows a very clear change of character, heavy distribution out this far...

I'm trying to get other charts as well as trade ideas and quality/risk control all going at the same time in fast (information) moving market.

VXX New Position

Also Opening VXX Aug $16 Calls.

The equity option t for this would be VXX long or UVXY long which has 2x leverage, but volatility is already pretty volatile in these two.


Going with QQQ Aug. $76 Puts

For those looking for an equity way to play this with leverage there's QID (2x short) or SQQQ (3x short the QQQ)

Charts coming next.

I think this will likely have a longer trend so SQQQ or QID is not a bad choice.

QQQ / SQQQ

If I had to pick the worst looking of the 4 averages and wanted to take a position, it would be long SQQQ (3x short the QQQ) or QQQ puts. I'll get charts and/or a position out

Not so Fast...

Price action gets the heart pumping especially after a nice dull session, but I see a few things that looks like this is not the end of the intraday bounce started yesterday, it may change before the close, but I'm seeing it in positions I like and want to open and the arbitrage assets.

I'll take a further look, I'm going to try to give you an abbreviated version, just remember HYG (High Yield Credit ) leads the market and typically they use it for intraday upside manipulation, VXX/UVXY  trade the opposite of the market as VIX futures. TLT is the same as VXX, but I'm not getting too much in to that.

The only other thing is XIV which trades with the market and is the exact opposite VXX, however as even the VIX futures are all different ETFs the signals in 3C wouldn't match if there wasn't something there.

Specifically I'm thinking the IWM may pull a Crazy Ivan intraday around this little triangle.

 UVXY (2x leveraged VXX) 1 min has been showing (like VXX) accumulation today after yesterday's slight distribution, remember these trade opposite the market so the signals actually confirm with the market averages.

I have a VXX CALL Option position ready to go just as soon as I feel the timing is right on.


 This is a 2 min chart of XIV, it is the mirror opposite of VXX/UVXY and moves with the market, it is seeing the accumulation as the market did yesterday for an intraday bounce and distribution today, it's just not leading really negative yet and that's what I'd prefer to see for short term or option positions.
.

VXX 3 min is showing strong accumulation today, leading positive in to this move, in fact it almost seems as if it's being helped down a bit to be accumulated at the best prices.

 Here's where it is strange, 5 min XIV is almost in line, the exact same is true of VXX and UVXY, although they are starting to go positive there.

Longer term or as far as which way this is going, I have no problem being long VXX or even UVXY right here and now, it's more option timing that I'm concerned about.

XIV longer term knows it's over too, remember this trades with the market correlation.


HYG intraday 1 min is perfectly in line

2 min the same

only at 5 min does it show some weakness and that's because the accumulation yesterday wasn't strong enough to hold the 5 min together.

However the 15 min HYG chart also knows this market is toast here, still it's the very short term timing.

Quick Market Update

As thought, you'll see in the last post as I was writing it an alert I set for an IWM (start) of a breakout from the intraday triangle went off, as suspected the charts for the averages began to deteriorate even more. I'll keep following these as well as any assets that might be worth an immediate position.

GOOG Update

As I look around, it feels like we have a little more time, but not a lot, it seems like there's an event that they're  waiting for, VIX expires today, Bernie has another talk in front of the Senate tomorrow, but I keep coming back to the IWM triangle, I have a feeling it will be significant in timing which if you recall this started off after yesterday's early downside, while the market was still nasty we saw the first hints of a small bounce, at the end of the day yesterday we saw the first hints of some weakness coming in to that bounce and today we have a small bounce. I still think the IWM is key intraday.

As you know GOOG is a long term Core short position, meaning I like this as a long term position (trending). As fas as timing, would I enter a Put option in GOOG right now? No, but it is above the area we were first looking for it to move above as a prerequisite before exploring it as a short new position or add to. In my/our experience, typically these head fake moves go a lot further than you'd otherwise thing is reasonable or necessary.

I suppose if I was using excellent risk management, this would probably be a pretty nice area to start building of continuing to build a phased in position (typically in 3 parts) this is not the same as dollar cost averaging which is throwing more money in to a losing trade, this is the same way Wall St. enters and exits and the main difference is that the risk management for such an entry is worked out before you enter 1 share of the position, that means position sizing, wide stops and you are looking to be able to add at a better level if you can get it, if not, then you can add on the move down on a retrace.

Or the position would be pretty decent so long as you have good risk management, allow initial positions especially like this a wide stop which means fewer shares and make sure the stop is not at any obvious place including whole numbers.

 These are the exact same trendline I drew in on the last update, the areas I would consider looking at a GOOG short because they were bound to be hit. We can talk about these small double tops and how they perform differently from the TA textbook later, usually there's a bit more of a head fake move (yellow arrow), but it was enough to knock out all closing and intraday highs and thus long breakout limit orders.

 The 60 min momentum chart can be constructed using these or your own favorite indicators, the thing is you have the best chance when as many timeframes as possible are confirming and use longer settings, don't use the industry standards. I have RSI 6 on this (I know, but RSI doesn't respond well to longer settings), Stoch period 5o and MACD Histogram periods 26/52/9 I find you can double that when using faster intraday charts.

**Just now the IWM hit one of my breakout target alerts.

 This is the daily Money Stream, further back it looks even worse, but I'm most concerned with this small double top-ish area, it is negative there and big picture VERY negative compared to pre-2013.

 Daily 3C says the same thing, the current area is where I'm most interested, long term distribution in a stock as big as GOOG is not uncommon, but now that it's leading negative, it's more significant.

 30 min is a serious timeframe, the last run on this "Double top" (I know it's not a true double top) shows 3C showing heavy distribution in to the move which is EXACTLY what we want to see 

The 15 min chart easily confirms the same. 

From the fastest intraday timeframes now, 1 min shows yesterday's overall start of the market bounce we saw signs of and called VERY early , today it has been in decent shape, it seems there's some deterioration now. I suspect an IWM breakout would see all of the assets and averages see heavy distribution signals in these charts as they follow the IWM.

The 3 min chart is the last timeframe with any sign of yesterday's accumulation for a bounce, I should note the size and amount of time for accumulation would be so small, there's little upside the accumulation move could support.

And the 5 min is all clear, no positive activity hit there at all so that links us up to the longer term charts. In my view it's just a matter of timing for the best entry with the lowest risk.

*Bonus chart...
This is the 3C trend Version where all details and noise are taken out so we can just get a look at the pure underlying trend.
There are a couple of accumulation areas, mostly though we are in line until a move above the 3 year range resistance, then we see a trend of distributing in to higher prices, GOOG is a huge stock, these would be huge positions and can take 6-9 months for 1 firm to liquidate without being attacked by predatory HFTs Pinging for icebergs.

The leading negative or overall trend is what is really important for GOOG as a LONG TERM POSITION.