Today was one of those days when here was so much information (data) and it came in spurts of very small sections of time.
First I'm going to start with a different kind of Investor Sentiment, as you know we have followed dumb money sentiment as it has reached multi-year highs in many cases, tonight we are going to talk a little about Insider transactions. There's one thing I say about insiders selling, "There can be a number of reasons why, but one reason is not because they think their shares are going to be worth significantly more any time soon".
On that note, it seems
MarketWatch agrees with my statement:
"Corporate insiders are aggressively selling their shares.
This is worrisome because corporate insiders — officers, directors and the largest shareholders — presumably know more about their companies’ prospects than the rest of us do. If they were confident that the shares of their companies would soon be trading markedly higher, they wouldn’t be selling them now."
"For the week that ended last Friday, this sell-to-buy ratio for NYSE-listed shares listed stood at 9.20-to-1. That means insiders of these companies, on average, were selling more than nine shares of their firms’ stock for every one that they were buying.
The last time a weekly sell-to-buy ratio was worse than this was in late July 2011, right before that year’s debt-ceiling debate began to spiral out of control. Over the next couple of weeks, of course, as the U.S. Treasury’s credit rating was downgraded, the Dow Jones Industrial Average (US:DJIA)lost some 2,000 points."
Moving on from there, we are at a precarious position in the FX market, a number of important carry pairs, largely centered around the Yen have been either trending sideways or down for the last several weeks after months of the pairs (yen moving down) moving up which is bullish for the market.
Tonight the BOJ releases their policy statement, which normally would be an FX moving event, however it is largely expected the outgoing governors and head will leave policy unchanged and wait for the new crop of Abe nominations to be confirmed and take over on their bolder vision of ending 20 years of mild deflation through Yen currency destruction, which in turn prompts a sort of trade war as everyone moves to devalue their currency to do several things, one of which would be to boost exports/GDP.
I personally feel the event will be a non-event, but it isn't the news, it's how the market reacts to the news.
I'm going to go over Leading indicators and currencies because it's been a while since we have taken a comprehensive look and things are not what they seem if you are just reading the headline news.
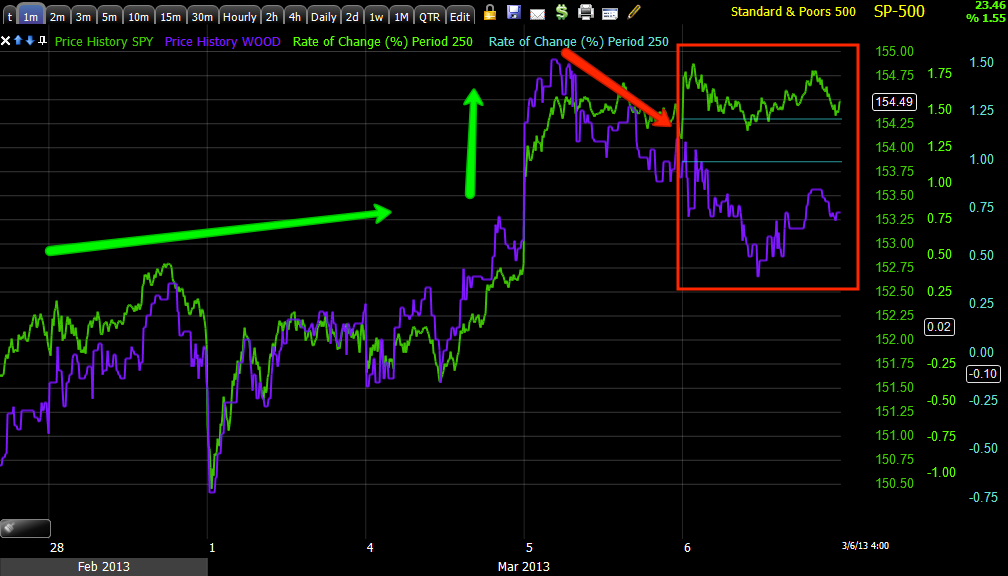
*Leading Indicators are compared to the SPX in green unless otherwise noted*
First, here's a longer term look at commodities vs the SPX since the bottom of 2009, both are risk assets and in a healthy market bot should move together, commodities did move with stocks for quite some time, but they have been severely dislocated for the better part of a year and a half and only getting worse.
You can see the difference between all of the averages performance today vs. yesterday, note how commodities traded much closer to the SPX yesterday and today just peeled away.
This is commodities intraday vs. the $USD in green, you can see the inverse correlation as the $USD trades opposite most every risk asset, that means today's $USD strength puts pressure on both commodities and stocks.
Here's the Euro longer term trading with the SPX, note how it too has fallen out with the SPX.
And intraday today vs yesterday... In yellow is the Euro taking out $1.30, I have a feeling this will not be allowed to stand, we'll see tomorrow morning if the ECB intervenes in the FX market.
By contrast, the $USD vs the SPX intraday.
Longer term you can see the $USD is looking as if it is coming out of a base and moving up, this won't help stocks at all or any other risk asset.
This is long term yields vs the SPX, they should move together as they did in green, they too have recently fell out with the SPX, Yields are like a magnet for stocks.
HIO has been a good leading indicator, in green it is moving with the SPX as it should in white it is leading, in red is leading negative, this is a sign of trouble in the market that is not yet being sen in stocks, but other risk assets are seeing money moving out.
HIO intraday, note yesterday vs today.
High Yield Corporate credit is one of the best leading indicators, it was leading stocks and sent them higher, since it has fallen out with the market, in yellow I suspected this bounce was a short squeeze...
Today HYG also lost ground vs the SPX.
This is a 30 min 3C chart on HYG, as you can see there's distribution at the top, it looks like my short squeeze theory was correct, that's not good for the market as credit leads and stocks tend to follow.
Junk credit trades much like HYG, I believe it too saw the same short squeeze after a deep drop.
Junk credit vs the SPX intraday the last two days, it hasn't even made a local high to keep up with the market.
This is Doctor Copper on an intraday 2 min chart, note the performance yesterday vs today, like I said, there was a lot of changes in the data today.
Here's a longer chart (30 min) showing the Sept. QE mini top, since the market was moving in a low volume/low volatility melt up in January, Copper has fallen out with the SPX as well.
Here's a closer look on a 15 min chart, remember how many things we noted that changed for the worse around Feb 1, here's another to add to the list.
In case you prefer Dr. Wood, it too fell out with the market today.
As for FX...
The AUD/JPY was trending laterally, it broke down and now looks to be in a typical volatility shakeout, however we'll see what the BOJ does overnight. I have very little in the way of 3C forward information, what I do have appears that the $AUd has a negative divergence, that would put pressure on the pair and carry traders in turn putting pressure on the market, here's what the $AUD futures look like and why I say there's a fairly strong hint of a negative divergence.
$AUD futures went negative at the highs and fell, it looks like a bounce is possible here, but the larger trend is negative.
The Yen isn't giving any real signals at all in front of the BOJ policy announcement tonight.
The EUR/SD which should be trending up with the market has been trending down, clearly trending down, it remains to be seen how long the market can hold without collapsing while this pair falls off more every day. It also remains to be seen if the Germans or French get their way and there is intervention, as i noted this morning, the last two times the Euro has dropped below $1.30 there has been support build in.
The EUR/JPY is also trending down, although there's a bounce, it hasn't changed anything technically yet, this can also pressure the carry trade and thus stock prices.
The AUD/JPY also went from a trend up to lateral to a break down and now looks to be shaking out lose hands, we'll see what the BOJ does or doesn't do tonight.
The same is true of the USD/JPY, as you can see, this is more about the Yen than anything, that's why I said yesterday that they Yen would be the pivot for the market today, likely tomorrow.
Today's VIX close came in as confirmation of yesterday's bullish morning star reversal, as you know the VIX trades opposite the market so a higher VIX means a lower market, remember it wasn't too long ago we got a buy signal on my custom indicator, the VIX has only moved up since then.
As for Price/Volume relationships among the component stocks in the 4 major averages, we had a dominant reading across the board, all 4 majors, Close Up and Volume Down which is the most bearish of the 4 possible relationships, it usually manifests in at least a 1-day move the next day (down). Remember these aren't the averages, but all the component stocks that make up the averages.
Last week I made the argument over and over that a new high in the Dow, even if it is only 1% would be a huge headline and as we know, most people only read the headlines. This is a great opportunity or has been a great opportunity for the headline to pull dumb money in the market, perhaps that's why the last time this happened in 2007 it marked the high before the market came crashing down leaving dumb money holding the bag.
As far as the underlying action during the last two 2-days, here's a quick look.
DIA
IWM
QQQ
SPY
Today we had a positive intraday divergence in the futures, the plan was to use upside momentum to sell in to /sell short in to, we barely got a move from that, but the intension seemed to be there while the more important charts are all showing major distribution if you saw my last market update, I wouldn't be surprised if we saw a continuation of this early tomorrow in the a.m. with the reversal (based on the longer Futures charts all incredibly negative), we have the range to make it attractive and to pull in the volume...
This was the plan for today, we just couldn't quite get the upside traction in price...
This is why I stayed relatively patient today, this is the plan fro today and there's nothing I see tonight that would make this plan less effective, in fact the surprise in the futures charts makes it more attractive, this would also give us that fast intraday reversal that I have long suspected, it's not like a "V" reversal would be hard here as we have spent 2 days in a range, the process part has already been taken care of.
In any case, I'll keep an eye on the futures tonight, if anything changes I'll let you know, but I have to say those longer charts all negative was a big surprise and may end up being a big surprise for those who chased the headlines.