Tuesday, April 23, 2013

Still Quiet

Not much has changed since the last futures post just before the close except AAPL's earnings.

You might be interested to know that 3C was originally designed for the TOS platform so we could see what was going on in after hours trade, on that note, here's how AAPL ended...

Interestingly there's a very strong positive divergence the last hour of regular trade, then some profit taking in to the highs after reporting, as price made its way back down, 3C went in to a large leading positive divergence. I'm always more interested in the next regular hours session as the thinner liquidity of after hours and the numerous games that can be played are deceptive, but according to this chart, it appears someone was accumulating the AH decline.

Other than that, the only thing I see moving significantly in futures trade is the $AUD, I'm not sure what the news is, but it's a steep drop, perhaps something out of China?

In any case, I'll let you know if futures change substantially tonight as long as I'm awake, otherwise, I'll see you in the a.m.


Perfect- A shiny Apple with a Worm in it

Not too hot, not too cold and the initial move anyway looks like exactly what we were looking for, what am I talking about, AAPL as an excuse to move the market that the simple CNBC investor can understand because they sure as heck won't understand why we bought all of longs last week when we saw smart money buying the market last week!

In essence, theory or now reality, AAPL was the scapegoat we were looking for, the thing CNBC could point to and say, "The market is higher because of AAPL earnings", when in truth the market is higher because that was pre-ordained last week.

Honestly, AAPL's results kind of stink, but remember I said, "It's not the news, but the reaction to the news"? Well Wall St. influences that to a large degree, look at CAT's earnings which were a disaster and it closed up almost +3%!

Here's why AAPL is perfect...

AAPL Earnings...

Revenue: $43.6 billion vs. consensus of $42.3 billion BEAT

EPS: $10.09 vs. consensus of $9.98 BEAT

Apple Boosts Buyback and Dividend! GREAT NEWS

Guidance for Q3 revenue at $33.5-$35.5 billion, below the estimated consensus of $38.4. 

Do you see it?

Looking at the Earnings and probably (although I REFUSE to turn on CNBC) all over the financial media, the headlines are "APPLE BEATS!"

As far as DUMB money  is concerned, the beat is reason to celebrate, to buy AAPL, to say, 

"Apple is back!!! I'm going to be able to sell my shares I bought at $700 for $800, I'm so happy I held my kids college fund and took that -40% loss, I knew Apple would come back!!!!"

It's because that's how dumb money thinks, they are lazy, they don't read beyond the headlines and more importantly (something Wall St. can control in After-hours), they take price action as confirmation and in After-Hours no less!!! 

"But wait a minute Brandt... You were saying there's something going on with AAPL!"

I said AAPL has some incredible charts, someone seemingly has been buying it by the boat load, but that's only so they can sell it at a profit.

The one thing dumb money doesn't get and for the most part, THE ONLY THING WALL ST. CARES ABOUT, GUIDANCE!

In other words, the way Wall St and Dumb Money look at earnings are totally different, dumb money looks for the headline beat, Wall St. could CARE LESS what AAPL did last quarter, the only thing they care about is sentiment toward what AAPL will do next quarter and there's where AAPL really stunk the joint out.

"Guidance for Q3 revenue at $33.5-$35.5 billion, below the estimated consensus of $38.4. "

Thats to 7.5% to 13% less than EXPECTED! 

That's a HUGE MISS in the only area Wall St. cares about for most companies. What a company already did is irrelevant, the only thing is there might be some information helpful toward figuring out the future like profit margins, trends in sales, etc.

So assuming the "AAPL is GREAT" sentiment holds up through regular hours (which I think Wall St. had already guaranteed no matter what AAPL's earnings as they obviously bought AAPL in size), then...

We have the best of both worlds!

We have our short term rally that we prepared for last week  and just so dumb money never catches on to what really drives Wall St., the AAPL earnings will be a nice, simple reason why the market is behaving the way it is.

On the other side, we are expecting a nasty turn down after this run is done, AAPL gave smart money EVERY REASON TO BE  A SELLER TODAY IN MISSING GUIDANCE! When it comes time for our downside reversal, Wall St. has motivation right from the very same earnings that drove the market higher in the short term!

AAPL use to always pull the "Scotty Trick" from Star-Trek, tell Captain Kirk it would take 30 minutes to fix the Warp Drive AND THEN LOOK LIKE A HERO WHEN IT WAS DONE IN 10 MINUTES, in other words, guide low and beat big on earnings.

AAPL lost its touch. AAPL was a cult following, an underground movement, those few artsy people in the know and they absolutely HATE that EVERYONE owns an AAPL something now, they hate the big, sparkly Apple Stores and their "Genius Bar" and they hate that Apple wants to make an I-Phone everyone can afford. AAPL lost something when Steve Jobs departed.

You probably remember, when the I-Phone 5 came out, after watching the unveiling I posted, "This is the first Apple product I've seen that is evolutionary rather than REVOLUTIONARY".

I won't renew my 2 year contract with AT&T because I don't want an Iphone 5 for 2 years when it hasn't even caught up to Samsung! 

Don't forget my chart of what happened to MSFT once they declared a dividend, Growth stopped, the lateral range began, the same is going to happen to AAPL. The glory days of AAPL aren't that far behind the glory days of Howard Stern, but for now, this is EXACTLY WHAT WE NEEDED!

SPY Manipulation

 3 min 3C distribution in to higher prices as we suspected, but how are they keeping the market up?

 SPY arbitrage shows manipulation, HYG is one of 3 assets used in the model...

 HYG intraday is perfectly supportive, but...

Look at the longer term of where the SPX highs were and where it is now compared to High Yield Corp. Credit, it is way higher, obvious manipulation to keep the market up a bit longer, until AAPL earnings and the reaction during regular hours tomorrow is my guess.

Futures...

I like what I see.. The idea is AAPL pushes the market up near term on earnings (tonight), we'll be looking to sell Calls and any short term longs in to price strength and initiate new or add-to shorts in to the same price strength, which I don't expect to last much longer.

As you may recall, a weak $USD is market positive, a strong Euro is market positive, a strong $AUD is market positive and a weak Yen is market positive, so looking at the currency futures, here's what 3C is showing for the short term...

The relatively strong $USD 1 and 5 ,min futures (usually overnight and in to the next day) are showing negative divergences, this is a market positive.

The Euro intraday has a huge positive 3C divergence, it looks ready to fly almost any moment now. The EUR/USD is also going positive on the 3C charts (also market supportive).

The $AUD doesn't have a very near term positive (as in ready to move right now), but there's a 15 min positive, that falls within our timeframe and the Yen looks pretty neutral.

In addition, the Carry pairs of EUR/JPY and USD/JPY also have building positive divergences (also both market positive near term).

The Index futures are all more or less in line, the 60 min "TF" (Russell 2000 Futures) has been a strong short term indicator despite its longer term timeframe, it is very positive.

As for Gold and silver... As shown in the GLD and SLV posts today, both gold and silver look like they have more work to do, but they are progressing and moving the right way for us to be able to look at new long positions at excellent/low risk prices and I believe very soon (We've done excellent in timing both and I HATE trading Precious Metals, so to see strong signals that would make me even consider either, you know they have to be pretty strong.

Our last long in both bought at the very low and sold at the very high and we were out before the collapse.


GOOG Charts

GOOG has a recent storied past, on 4/18 we opened some long calls... The very next day on the 19th, we sold those calls for a +56% profit for 3 hours of market exposure.

I posted on April 19th, "I Think GOOG Has More Upside", however probabilities are not the same as high probabilities and a low risk entry.

So here we go again...

GOOG charts...
 Here's the 3 hour, +56% trade.


 Here's GOOG on a 1 min chart with distribution at the pullback/top, but recent positive divergences, this is what I'm interested in short term, longer term GOOG as a short is an interesting position that I've been looking forward to as a new position or an add-to.


 3 min positive in to the pullback..

 And even on the 5 min today which is what I needed to see as this is where institutional movement starts.

The 10 min chart shows why I want to short GOOG in to any price strength for a longer term position.

 The longer term 60 min chart also shows the negative divergence as well as the more recent negative divergence on this most recent run.

This is the VERY short term intraday momentum screen going from negative to positive

Went With GOOG May 10th (weekly) $800 Call Position

speculative!

SPECULATIVE-GOOG Long/Calls

I'm going to look at a short term GOOG call position, slightly in the money, maybe 2-3 weeks out in expiration.

I'll post charts, but there are very short term positive divergences and longer term negative, I'm guessing this may be a 1-day (maybe a bit more if the market cooperates) move.

Charts coming.

NFLX Short (EQUITY)

I realize that an NFLX long here is a bit dangerous, especially if AAPL moves the market up tomorrow, this is why I decided to go with an Equity short, it has more room to manage, less risk and while I'd prefer a put position, I'd like to see what AAPL does as timing with options is crucial.

This will be about a 2/3rds normal size core position, I'd like to leave some room to add if need be.

Charts coming.

Leading Indicators Update

First, as we saw with the recent 4/12 to 4/18 decline (The volatility of which is a warning sign as there's a change inn character in volatility), Es continued to move past VERY extreme levels of mid 25's which I had not seen before to more than a negative 40 ES point differential, this suggests our expectations of a short term move up would be sold/shorted in to by smart money and a larger move down would follow, as such we want to take profits on longs set up last week for the short term move up and get ready to start selling short. Es confirms this larger outlook of our complete theory/expectations.

 CONTEXT's ES model is now at a negative 25 point differential vs ES (SPX futures) price.

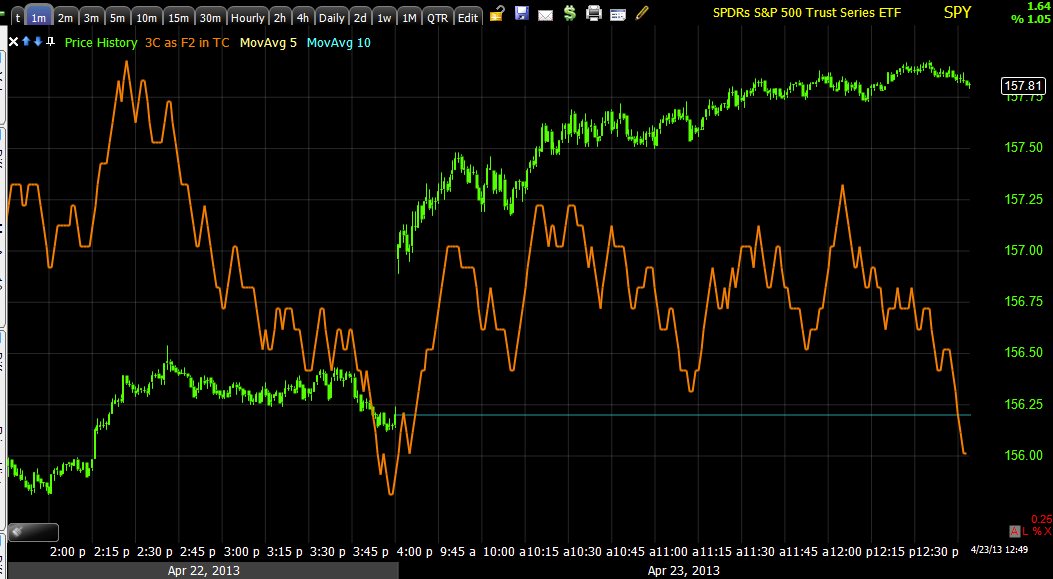
The intraday SPY arbitrage seems to have been manipulated to help the upside most of the day, perhaps this is why the negative divergences (selling in to strength) have been ineffective in sending the market lower as short term levers are being used to manipulate the market higher. The assets used in this model are HYG for Credit, TLT for Treasuries and VXX for VIX futures, that's it and those are all leading indicators we follow.

HYG (VERY liquid High Yield Credit) is OBVIOUSLY being used to manipulate the market higher, here's an example so you have some idea to what extent...
HYG (light blue) is much higher now than the former SPX high, this is HYG being used to manipulate the market higher.

JUNK Credit which is also High Yield is acting EXACTLY the same, the less liquid (therefore it needs to act sooner) High Yield Credit has been supportive of the SPX intraday, it is starting to give way, but it does not have this longer term, very strong correlation that HYG and JNK do.

Yields ARE NOT supportive from yesterday to today, they are also diverging a bit negatively from the SPX intraday.

The $AUD, Euro and $USD ARE NOT supportive of the market, they are more in line with a strong move down in the market and this may be why HYG manipulation is so important to keep the market from collapsing here.

The Yen is supportive over the course of this move up, but intraday it is not supportive, yet not extremely negative either.

Commodities aere also not supportive, I find it hard to believe the market can hold up in to the close.

I see the market is giving in to the overwhelming Leading indicators that are not supportive now.

Silver/SLV

As mentioned last night, silver/SLV looks to be a long trade that is starting to pull together, I would not enter yet, but I do believe that there's something here worth putting SLV on your radar...

 This is the last SLv (2x leveraged long AGQ) trade, we bought on 4/4 at the bottom and sold on 4/9 at the top. The recent gap down on large volume looks like short term capitulation (when I say short term that is to differentiate it from Primary trend capitulation which represents the start of the end of stage 4 or a bear market).

The rather flat price trend since that capitulation move alone, looks like an accumulation area, 3C confirms it.

Here's the intraday 15 minute chart and the flat range I mentioned, today looks like part of a head fake move below the range, there may be more coming.

The 1 min chart on today's "partial?" head fake move shows a positive divergence

 The 10 min chart shows a head fake, distribution and a downtrend, recently though we have a large leading positive divergence

 The 15 min chart shows the same. We need to see the shorter term charts fall in line before this is a probable long, but it should be on your radar.

The 15 min Silver Futures are confirming the SLC 3C chart as well.

Keep SLV as well as Gold/GLD on your radar.

Quick Market Update

For the most part, the trend in the Index Futures intraday as well as the 1-3 min and now some 5 min market averages continue negative, there was a noticeable 1 min positive divergence at the Flash Crash intraday lows, headline scanning algos were likely first to find out the AP Twitter story was a fake and were the fastest to move in and buy the deep discount intraday, but the overall trend keeps deteriorating.

I wonder if we do see the downside that this trend has been suggesting before AAPL earnings tomorrow or if this is selling in to strength in advance of the AAPL earnings, whether good or bad (market positive or negative as earnings don't matter anymore). In any case, it would seem AAPL earnings will likely be the final catalyst to trigger the transition from the short term move up we have been looking for and now have (to what degree is still unclear)  to the longer term negative price trend to the downside.

Keep AMZN (SHORT) on Your Radar

I believe AMZN is in position to make a new local high, perhaps even an all-time new high, however it is VERY much in the same position as NFLX as shown yesterday.

I'd be looking for at least >$275 or better, this also suggests the market upside is not done yet, although the Hacked "Twitter" account of the Associated Press sending out a message that there were two explosions art the White House with the president injured, is obviously what sent the market reeling minutes ago.

In any case,  keep AMZN on your radar, it also seems to suggest further market highs in the coming day/days...

AAPL May Still Be the Key

At least to short term action, as a reminder, AAPL reports after the close with a conference call at 5 p.m. EDT.

The AAPL charts still suggest that AAPL has a strong move coming...
 1 min chart really doesn't look that bad, the market averages since yesterday afternoon have looked much worse.

The 10 min chart has an enormous leading positive divergence.

 As does the 15 min chart

And the 30 min chart has shown some incredible upside momentum from an already very positive chart.

I may even consider adding to AAPL if the price correction and charts make sense.

And there it is....

The signs were there, that's why I was closing positions, but I really need to pay attention, this may be a short term distraction in front of AAPL earnings to really shake the tree in both directions, but I need to check a lot of assts and stay on top of them, email replies will be a bit slower than normal.

SPY 5 min

Intraday Index Futures Update

Here's a look, even though the averages themselves started going negative yesterday afternoon and all this morning, it wasn't until the Index Futures went negative that we saw movement, at least it allowed us time to manage positions.

 ES 1 min

 NQ 1 min

TF 1 min

However, the ES 5 min is still in line, as is the 5 min NQ and TF charts, this seems to suggest to me that we still have upside, whether tomorrow after AAPL earnings or... I wouldn't speculate on the short term beyond tomorrow. AAPL's important charts still look great.

So, the short term move was to get retail to buy the move up and the longer term is to sell to them (sell short also), so far, it looks to me from price and volume action that retail took the bait.

UVXY P/L and Follow Up

Here's the P/L and some charts for UVXY equity short that I just mentioned closing out...


At the $6.33 fill, this equity long made +19.5% in several short days.

 The short signal for UVXY...

 Recent intraday 2 min positive with a gap above.

3 min positive with a gap above.

So far the 1-3 min charts and this 5 min chart that is inline have been almost identical to the market average divergences.

5 min chart, much like the market averages, although there are very slight changes there.

This is the long term 2 hour chart of VXX, notice how it is in line until the November rally starts, then there's a bid for protection in Volatility/VIX futures. This is a VERY negative longer term/primary trend signal for the market.

Market Update

The Index futures have finally gone negative, we are going down from here, most of the averages look like this SPY intraday or worse.


Covering UVXY Equity Short

This is because of the gap, some short term signals, a nice profit and an abundance of caution.

DIA Calls P/L


+27% for a couple of days isn't too bad.

Taking at least half of DIA 141 CALLS

I'd also consider taking a little off the table with AAPL, but I'd like to hold most until after earnings. It would depend on my exposure, I wouldn't want a large position right here.

Leading Indicator Quick Update

I can see why the market is levitating and why SPY arbitrage is green, HYG (credit) is flying and very positive, leading the market, Junk Credit is doing the same. In my view, VXX could be lower so there may indeed be some safe haven buying or protection in VIX futures, VXX doesn't seem to show it today, but if you look on a relative basis as the SPX has been at similar prices, it should be lower than it is. HY credit is in line too, but I'm worried about a parabolic downside reversal.

Currencies are concerning, in the light that the pullback/consolidation (as ES CONTEXT suggests) could be larger than thought. The $AUD is way under performing the SPX, this has a lot to do with Chinese overnight data (PMI), but still, there are arbitrage programs running and carry trades so it matters, regardless of why.

The Euro is significantly weaker than the SPX, IT IS NOT SUPPORTIVE, so from currency's point of view, the market is frothy and short term dangerously toppy here, short term at least for now.

The $USD is moving up so the market is rising in to a very non-supportive atmosphere, if/when that fails, currency arbitrage could send the market sharply lower intraday.

Yields are in line intraday, but over the last few days they are negatively dislocated.

Finally commodities aren't doing much to support the market, I'd be careful here, I'm going to take a closer look at some specific assets. I feel some relief in having taken the IWM calls off the table for a gain, even if it isn't top-ticking the day.

Market Update

So far the resiliency of the market since yesterday afternoon quite frankly is surprising.

All of the Index futures are slightly negative, but mostly in line intraday, here's a look at some other indications...

 The SPY Arbitrage model shows the market getting some support, I'll check our own Leading Indicators next.

However, CONTEXT'S ES model has a 20+ point negative differential, this is not the consolidation/pullback I was expecting for today so I need to take a much closer look at Leading Indicators.

Volatility thus far is not really arguing much with the intraday direction of the market, there are some small differences, but nothing I'd make a call on.

 SPY intraday 3 min as well as 1 and 2 min are all negative, at 5 min it is in line, every market average shows the exact same as far as timeframes today.

 5 mon SPY momentum today, there's a slight fall off here as RSI and MACD are negative, but just slightly.

 DIA 3 min

IWM 3 min

QQQ 3 min-the reason I use 3 min is because it is the longest intraday timeframe negative, 5 min charts are still in line with price, which is why I thought any pullback or consolidation in the market would be temporary.

The TICK data should be watched, it's definitely not in line with the trend of higher prices.