Friday, February 18, 2011

Market EOD Update

Not looking too good in the market. We had a lot of bearish wedges that I thought would shoe some false breakouts and thus far that is appears to have happened.

 DIA daily Wedge

 DIA 60 min 3C

 DIA 10 min 3C


 QQQQ 60 min 3C

 QQQQ 30 min 3C

 QQQQ 15 minute 3C

 QQQQ 5 min 3C

 SPY Wedge breakout

 10 min 3C

 SPY 30  min 3C

SPY 1 min 3C

As you can see, by this sampling, most timeframes are negative or leading negatively divergent, when you' expect to see confirmation of a strong move. Also the percentage gains today have stalled into stars and doji reversal signals. I believe we are setting up for some kind of major change in the market.

REQUEST: TWM and EDZ


EDZ-I've been very bearish on emerging markets, the trade is overdone, they are fighting back and when cheap money dries up it will create a huge vacuum, it's already creating instability.
 This triangle was so obvious a false breakout was highly likely, that's what we saw as well and a fill of the gap.

 15 min 3C picking up on the false breakout.

 5 min has gone into a leading divergence.

 The 1 min is also in a leading divergence...
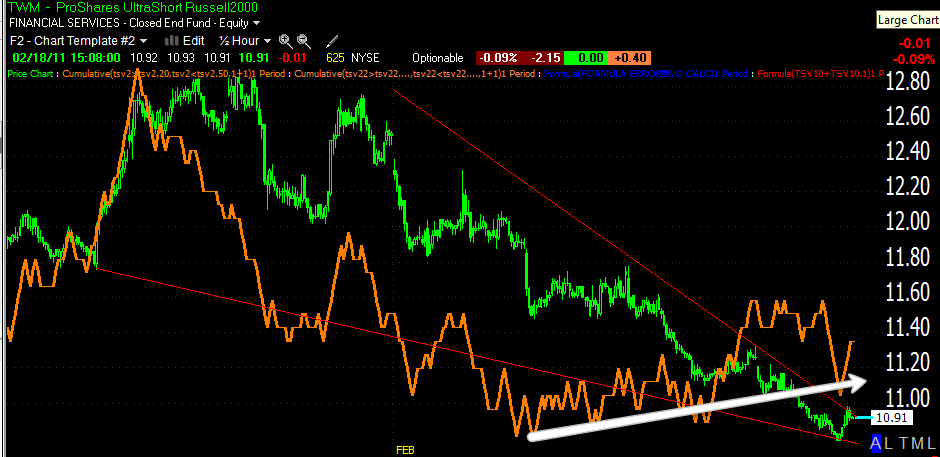
TWM

 Since it's the Russell that has been the focus of manipulation higher by the Fed & friends, it has the most to lose as well. Here we have another wedge within a larger wedge, this on more steep.

 15 min leading divergence in TWM-Ultrashort the Russell 2000 ETF


Filtering up into the longer 30 minute showing a nice relative divergence.

It may take a little more time, but things are moving fast and it feels like there's going to be a major dislocation in the market. Look at what's coming out of the fed. Yesterday's latest confidence builder, that larger banks were asked to cary out stress tests at 11% unemployment. That doesn't jibe to well with their uber-confidence.

MON Trade (short)

This trade is a bit counterintuitive to me, but there are many industrial dynamics I don't fully grasp. In any case, the chart looks horrible.

 MON's daily chart is getting ugly.

 Here's the hourly

 the 30 min.

 The 5 min.

and the 1 min

All are in negative divergences or worse leading negative divergences. I thin a position could br tried in the area with a stop above $75.88

Target (short ) TGT follow up

Yesterday I featured TGT as one of my trade,  Today it has broken down.

The stop can be moved just above $54 now. I suspect we'll see more downside from this leg before we need to look at managing the trade, just don't let an occasional up day put you off a good trend.

DB put it on your watchlist

This is a 5-day chart, you can see the recent bearish wedge at the right and the trendline of bounces it has shown in the past. This a European Bank and they've come under scrutiny lately.
One for the watchlist!

SSN JUST TRIGGERED A LONG TRADE

                 THIS IS ON THE FEB 7 SPEC. LIST.

USO UPdate

Here's the last meaningful update on USO.


Here's today, so far nothing but confirmation of the upside.


 USO 5 MN.

 USO 10 MIN,

 USO 15 MIM

 USO 30 MIN

USO 60 min

Not as Strong as it Looked

Across the board the dominant price volume relationship was Close Up and Volume Down-300 S&P stocks came in like that, nearly half of the Dow. This also happens to be the most bearish of the 4 P:V relationships.

Traders were content with today's gains or the PPT was and there was no further upside through resistance hit 3X forming a progressively worse negative divergence. Everything is lined up nicely for their breakout of the wedge to be a false breakout, we just need price to confirm of course

Just a word of caution to those of you who are trading leveraged WTFs of market averages,