Thursday, June 28, 2012

USO Improved also

You can compare to the earlier update in which there were a couple of charts that needed 3C to turn up.

 USO 2 min with a huge improvement with a new leading positive high.

 USO 3 min

 USO 5 min not only turned up, but led to the upside.

And the 15 min chart that needed 3C to turn up for a large relative positive divergence, finally did so.

TBT Follow Up

TBT was a trade idea from Thursday June 21, it's down about -0.39%.

Here's an update for TLT (20+ year treasuries) and TBT (Ultrashort 20+ year treasuries).

 TLT 1 min leading negative today

 TLT 2 min leading negative to a new low today

 TLT 3 min leading negative new low today

 TLT 5 min with a leading negative divergence starting mid-morning. TLT is typically a flight to safety trade, distribution in it seems to indicate that money is flowing in to risk assets as we saw with the last update. Although at this point I consider this a shorter term trade, TBT long was the choice to play weakness in TLT.

 TBT 1 min trend at a new leading positive high

 3 min put in a strong leading positive move today, the area in yellow is a typical head fake move.

Look at how much TBT added to the positive divergence today and all that was needed was a pullback.


Some Surprises

That move at the end of the day seemed like an intraday move similar to yesterday's, however some surprising timeframes were effected.

This is from yesterday's first market update around 11:15 a.m.


 "I would think and there are some hints, that the market would need to halt this move up, perhaps pullback a bit intraday or consolidate if positive divergences/accumulation are to continue. Smart Money doesn't typically accumulate in to higher prices."


 The DIA 15 min was moved to a new leading high, I don't think that strong divergence would have been possible without a move lower.

 The DIA 60 min chart moved on that divergence, I know it looks small, but to move a 60 min chart in such a short period of time typically takes some very significant underlying action.

 IWM 2 min leading positive at a new high, but take a look if I back the same chart up to 3:30

 Note that price is lower, almost all of that leading positive divergence was done in a "U" shaped base in the afternoon.

 IWM 15 min chart saw a strong leading positive divergence at the same area.

 QQQ 2 min leading positive

 The same chart backed up to before the market rallied.

 QQQ 15 min chart remained in leading positive position and created a new leading high over the last 2 days even though price was lower.

SPY 1 min leading positive position, but note where 3C as yesterday at the highs, as I said at the start of the post, smart money doesn't usually accumulate in to higher prices, therefore we need a pullback to see continued improvement in the chart, this is why I called it a "constructive pullback".

Just Because

One of my last market updates showed the probability of the market rallying in to the close similar to yesterday based on 3C 1-2 min intraday divergences.

 ES making a new high for the regular hours session and 16 points in less than 90 minutes on no news, just a 3C divergence showing someone was up to something.

The averages (most) are nearing unchanged on the day.

I know a few of you have been trading the market updates, I hope someone caught this move with a leveraged position.

GLD Charts-Reason for exit of put position

Firs of all, the market's character dictates a lot of the trading strategies. We are in a choppy market, take look at even the shortest of moving averages...
A 5 day average is pointing down, a 10 day is nearly flat and a 22 day is flat. There's virtually no short term trend whatsoever.

Apply the same to GLD...
At least the 5 and 10 are pointing down, the 22 is flat or trendless. For me, this means I need to adjust my trades to the market's mood. For the overall market it is telling me, "Unless you are trading with the primary trend, you need to be very nimble". If a 22 day average is flat, you can't really expect a trade to hold for more than a few days before you get some chop. This is all part of what we talked about back on 6/1 and 6/4, (the market is going to become increasingly volatile and increasingly unpredictable until it snaps and the primary trend asserts itself.)

 So the July GLD $155 puts are only a few days old, I saw 1 small bounce coming, but wasn't worried and held through it. Now I see something that looks a little more serious. There's a nearly 48% gain in 3 days or so, I always think of the saying, "Bulls make money, Bears make money, Pigs get slaughtered".

 Here's a GREAT indicator that has been consigned to the dustbin of Technical Analysis in favor of the newest trendy indicators, this is simple Rate of Change (ROC). I can almost guarantee you that if you take virtually ANY indicator, use it as a divergence indicator rather than what it was originally designed for and apply ROC to the indicator and use the ROC signals, that indicator will be 200% more useful and you'll be seeing things that no one else is seeing. What I see is a huge change in the ROC of GLD's price.

"Changes in character precede changes in trends"

 Longer term...

 GLD's 1 min 3C chart has been leading positive all day, it has migrated...

 Th 2 min chart is seeing the same leading positive and this has migrated....

 The 3 min chart is leading. These are about the extent of the intraday indicators in my mind. Around 5 mins you start getting in to signal that can affect the trend from day to day.

While the 5 min chart is not positive, it is nearly perfectly in line with price. With the shorter charts seeing positive divergences and the 5 min not showing anything negative, I'd rather not take the chance.

Closing out the other half of GLD puts

Update with charts

Here's a look at the end of day positive divergence similar to yesterday's, even though the overall analysis suggested very strongly that the market pulls back today.  I'll also show you why I think this is a constructive pullback, but also why I'm not ready to say it's over (it's only been a day).

 DIA 1 min positive and has been in a leading position all day, this latest low picked up a stronger divergence.

 The same thing happened in ES.

 The IWM 2 min shows the divergence the best, the IWM is often the leader of risk-on moves.

 The QQQ divergence alone would not have me posting an update, but there is something there and taken with the other averages, I thought it worth posting. Note this is a 2 min chart.

 SPY 1 min also shows a slightly stronger divergence at the late afternoon lows with a leading element.

Here is the rest of the analysis.

 The SPY 5 min barely went negative yesterday, that suggested to me that the divergence really wasn't that strong, meaning there wasn't HEAVY distribution. The fact the 5 min chart has been able to hold in a leading positive position today rather than move down and confirm price (in line), is in line with what I expected from a pullback yesterday. In essence, yesterday a.m. when I posted a market update, I thought it was highly likely we would see a pullback. I also explained that it is VERY rare to see smart money chase prices higher, this is why I was/am looking for positive divergences in to a pullback or even a consolidation.

As to why I'm not prepared to say,"This is the end of a pullback", when the 5 min chart is zoomed in to show intraday action, I expect to see charts like this show VERY positive intraday divergences such as a new leading high as well as migration through the short to longer term timeframes. I don't think we are there yet.

Quick Market Update

You may recall the 1 min positive divergence at the end of day yesterday around 3 p.m., we are seeing the same thing today. I'm not prepared to say the pullback is over, however I do see the same signal as yesterday at the end of day or in to the close.

USO

Since USO is effected so much by currencies, the next post will cover currencies. Also if you haven't seen it already, there's a clear change of character in oil from last Friday to the Monday open, the reason can be found right here in the NYT article that uncovers the Chinese manipulation of data and shows what's really going on in China, which is something I covered in a little more detail at the start of this post.

 USO Friday 1 min in a leading positive divergence, note the change in character after the NYT article as trade opened for the week on Monday the 25th. Currently we have a small positive divergence stretching from late yesterday

 Again the positive divergence Friday and change in character, also a positive divergence forming recently. On these timeframes a positive divergence could be a simple consolidation or a start to a reversal.

 3 min positive and change in character.

 5 min with a relative positive divergence. For this divergence to be taken more seriously, the current 3C position needs to turn up higher.

 There's the potential for a 15 min relative positive as well, similar to the 5 min chart, 3C needs to turn up here for this to be counted as a relative positive divergence which would be fairly large on an important timeframe.

 Interestingly this 60 min chart looks VERY positive. Normally I would chalk this up to an anomaly and ignore this, however...

For the first time since February, the daily chart has a positive divergence developing, that wouldn't be there without the 60 min having gone positive first. Interesting...

Risk Asset Update

Yesterday I really thought we'd see a pullback today, however from the charts it seemed to me to be a constructive pullback, you may even recall me mentioning that smart money doesn't often buy in to strength. I expected to see positive divergences during the pullback, thus far we have those too.

Although I can't say for sure how long a pullback may continue, I want to be looking at buying long positions (speculative in size and risk because the primary trend in the market is bearish) in to price weakness.

I wanted to check the risk asset layout and make sure there wasn't something we weren't seeing that was creeping in the wrong direction. So to sum up, this appears to be as I suspected, what I would call a constructive pullback.

CONTEXT for ES is fairly in line, there are no major divergences here.


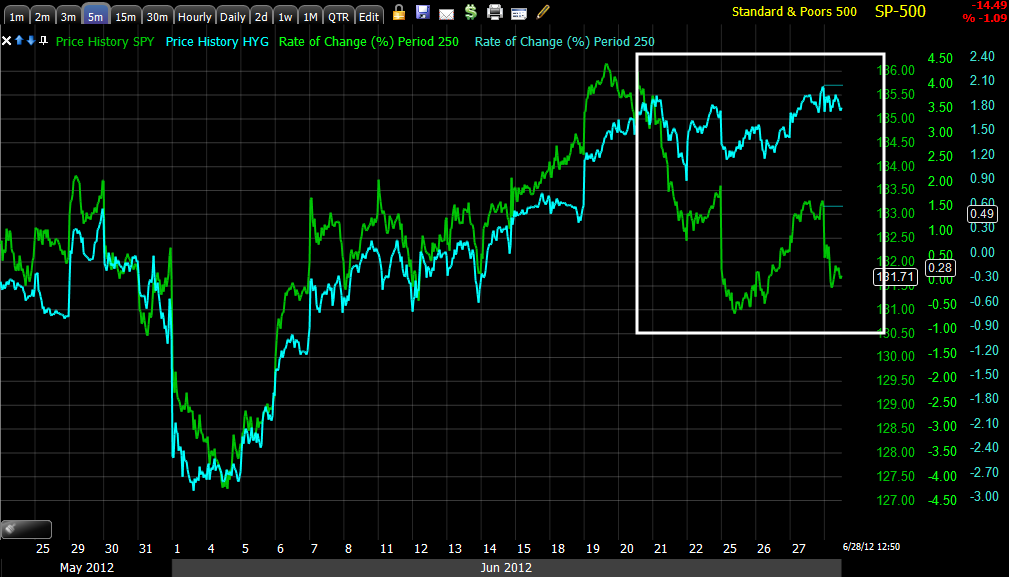
 High Yield credit is pretty much in line with the SPX today.

 HY Credit on a longer term view shows dramatic improvement from the Mid-May decline that put HY credit out of sync with the market; only High Yield Corp. Credit kept the market in line with credit, so this change is welcome as far as our outlook on the sub-intermediate trend. Right now I would call HY credit as being in line with the SPX right now.

 High Yield Corporate credit has shown a little better intraday momentum.

 Longer term in the trend, HYC credit is leading the SPX, this is the kind of signal we want to see during a "constructive pullback" in the market. Credit tends to lead the equity markets so this looks good as a bullish divergence.


 Yields intraday are not doing much

 Longer term there's been a lot of volatility, but right now we are what I would call, in line, which is fairly supportive of the market moving forward.

 The $AUD is one of my favorite leading indicators among the currencies and gives us some information about Carry trades and China as well.

 Longer term, just as $AUD  was positive divergent at the June 4 lows, it is in a positive divergence again, not huge, but it could be a lot worse.

 The Euro intraday and the SPX are tracking pretty well, which means the market and the Dollar correlation is tracking pretty well.

 Longer term, the Euro was positively divergent at the SPX lows, it is now negatively divergent. This is one of the few indications that don't look supportive of the market. The recent announcement of the ECB's balance sheet suggests the Euro should be significantly lower. However there is a huge short position in the Euro and I would think, if it is possible, FX smart money will try as hard as they can to effect a short squeeze. IF you want to read about market manipulation and especially how it relates to short squeezes, just read about Phil Falcone and the recent charges by the SEC as he created a Jesse Livermore style short squeeze, it's interesting and tells you more about how the market truly operates everyday; in the words of Cramer (regarding manipulating the market), "It's fun; if you aren't willing to do it, you shouldn't be in this business" (somewhat paraphrased, but accurate).


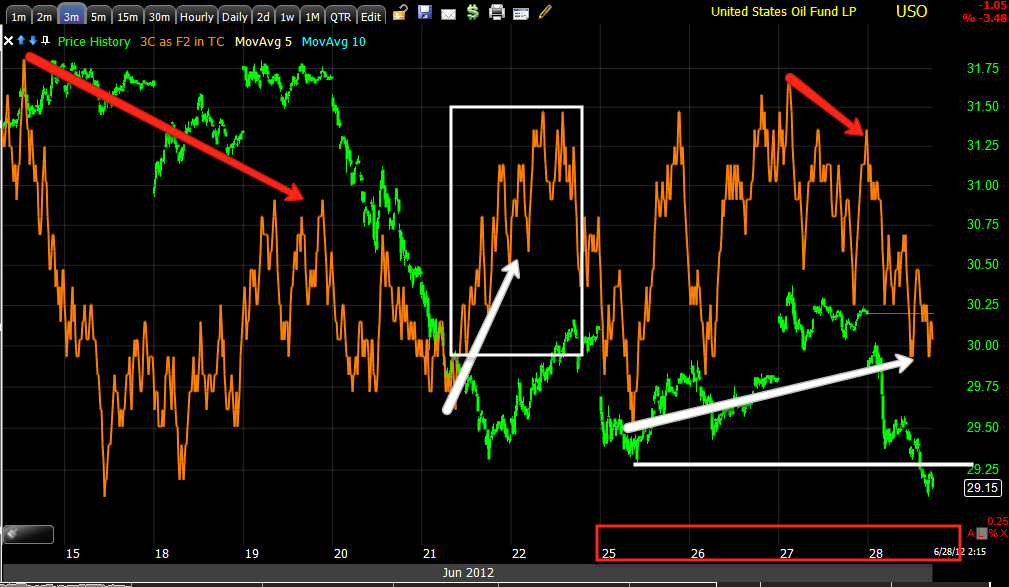
 Commodities today don't look too hot, oil and precious metals are under  pressure.

 Longer term though, there's an interesting trend in commodities, they keep making higher highs and higher lows even as theI wonder if there may be an election surprise in the way if QE?

 Energy sector intraday looks pretty good, remember oil is only part of the Energy sector.

 Longer term Energy has finally made it to a position that is in line with the SPX.

 Financials are similar to the market intraday

 Longer term Financials are showing a little better relative momentum vs the SPX.

 Tech is getting crushed today as well as yesterday

 Longer term, this isn't a pretty chart in Tech.


Sector rotation today, Financials are obviously down, surprisingly is the relative strength in the Energy sector as well as Basic Materials and Industrials. The flight to safety trades have kicked in, nothing interesting there, healthcare dipped late morning, but has since recovered some ground. I am a little surprised to see Energy, Industrials and Basic Materials looking as good as they do.