Wednesday, June 25, 2014

A True Dead Cat Bounce?

It has been quite a while since we've seen anything "true" in the market, driven by retail demand or supply with what seems to be a notable absence of smart money or their games, but to me, that's what today looked like, parhaps they were reconfiguring their trading systems and algos for the worst quarterly GDP print in 5 years at Q1 final of -2.9%. Some back of the napkin math tells us that even if the remaining 3 quarters all come in at 3% GDP growth, the best we could hope for on a full year 2014 basis is 1.5%, quite a bit below the F_E_D's recently dialed down forecast at last week's meeting that took full year GDP forecasts from 2.8-3% to 2.1-2.3%!

Here's their track record.
And now, assuming we go from -2.9% to positive 3.0% for the rest of the year, the F_E_D still has a major miss and recent economic data doesn't suggest we'll hit the 3% mark this quarter as Durable Goods missed by the biggest margin of 2014 this morning.

Still, it was difficult to watch today's market and try to glean information from it, at best it seemed like an old-fashioned 66% retrace (of yesterday's range), dead cat bounce.

The SPX closed for a 48th consecutive day below the +/- 1% mark, which , as mentioned earlier today is the worst stretch of low market volatility since 1995 according to the Associated Press. The Dow came in at +.29%, the NDX at +.72% which is interesting as it was the first to complete a positive divegrence by the close yesterday and the R2K at +.81%.

Of the 9 S&P Sectors...

 8 of 9 came in green today with Healthcare (which seems to be a flight to safety as it seems to always be up on the same days Utilities are outperforming, and why shouldn't they be with some of the biggest inflationary gains in healthcare and prescription drugs.


On a 2-week basis, the leading sectors are Utilities, Energy (as the Iraq crisis has sent oil higher) and right there at #3, Healthcare with every other sector posting a gain of less than half a percent or in the red.

I looked for an obvious catalyst for the move up in stocks, it didn't feel like a typical short squeeze which have gone to lasting long enough to run the entire February rally, approximately 1 month, to running most of the mid-May bear-flag/bear trap rally that broke above the 3-month range and SPX 1900 which has been approximately 2 weeks to the F_O_M_C last week which was half a day to yesterday which couldn't even hold half a day, the short squeeze lever seems to be broken. As for today...
The Most Shorted Index underperformed the Russell 3000, it also gave out first yesterday (red).

I looked at carry trades which have been all but dead,
 Longer term the USD/JPY (4 hour chart-each bar=4 hours) has been dead and it's only the BOJ trying to maintain the Yen at USD/JPY $102 as that's the line in the sand where it starts negatively effecting exports.

ES / SPX E-mini futures (purple) have long been seriously disconnected from the USD/JPY.

You can see the correlation between EUR/USD was very tight on this 4-hour chart from January 2014 to early May, then they dislocated badly.

Intraday the SPX (red/green) is quite out of sync with USD/JPY, it certainly wasn't lifting the market.

Then there's always the VIX to look at,

 SPX (green prices are inverted to show the natural correlation) and VIX (light blue), not only did the VIX outperform (not lead the market lower) as SPY/SPX prices lagged VIX today, but VIX also showed a lot of strength at yesterday's SPY/SPX short squeeze making a higher low vs. the 20th (last Friday). This is why I have been very interested in the long volatility trade, but as I said last night, I felt yesterday was a bit too early for anything more than a day trade.

Here's the normal correlation between the VIX in green and the SPX in red over the last 5-days, note the SPX (see the red trendline on the red SPX price line) is almost exactly where it was on the 20th when the VIX hit lows not seen since Feb. of 2007 compared to now as the VIX is higher while the SPX is virtually in the exact same spot.

Of course Treasuries are another one to look at,
 SPX (green with prices inverted to show the natural correlation) vs. TLT, again at yesterday's SPX highs, treasuries were headed higher right in to today where they saw a slight pullback intraday, but still outperformed the SPX.

Yields confirm the same...
5- Year Yields (red) vs. SPX (green) show that they were far from leading the market and are actually negatively divergent as yields tend to pull equities toward them, note the divergence in yields from the 17th to yesterday and the market's move toward the negatively dislocated yields, this is what I have been pointing out on a macro basis with 10-year rates as they have called the 2007 top, the 2009 bottom, the 2011 -20% decline and are diverging to the downside again at least as bad if not worse than the 2007 top, 10-Year Yield (Bemchmark) vs. the Market

As I was looking around for anything out of place today, I came across the Dominant Price/Volume Relationship which were heavily dominant in all of the major averages, 15 of the Dow-30, 61 of the NASDAQ 100, 891 of the Russell 2000 and 222 of the S&P-500 (of 4 possible relationships), the Dominant P/V relationship today was the most bearish of the 4, Price Up/Volume Down. 

Furthermore in looking closely at breadth indicators, I found this which may speak to high beta stocks that the market has been chasing all year and then some...
 Percentage of NYSE Stocks Trading Two-Standard Deviations Above their 40-day Moving Average.


Percentage of NYSE Stocks Trading Two-Standard Deviations Above their 200-day Moving Average.

In both cases, this is only the second time since late 1013 to early 2014 that the indicator in green (vs the SPX in red) have failed to make a higher high, in both cases the SPX had its biggest loss of the year, about -6% over 8-days.


Hopefully tomorrow we'll have some more insightful signals. All of the averages ended with 1 and 2 min negative divergences at the end of the day.

GLD & NUGT Update

The triggers I set for both GLD (as a put trade similar to yesterday's SLV $20 July Put, Trade Idea: (Short Term Spec. Options) SLV Puts) and GDX/NUGT didn't see too much action today, I think maybe one NUGT went off, but nowhere near what I suspect we'll see when the position is ready.

I am not eager to move out of NUGT (I already took most of the profits off the table +46% Monday, what's left of the position that was cut in half Monday is still at a +40% gain) as well as it has performed and as long as we have been watching this one for the right places to enter, but I'm less eager to potentially watch those gains of 40% suffer draw-down when the resources "could" be used to make another 30 or 40% rather than wait out the draw-down/pullback.

GLD as a put trade similar to the SLV Put from yesterday (linked above) which is at a -9.4% loss today (not that bad as options go) seems to look even better so while I'm not in a hurry to have 3 positions all with the same exposure (meaning SLV puts, GLD puts and DUST long would likely all move together directionally and that's a lot of exposure to one sector) the bar I've set for such a set of trades is pretty high as far as the entry goes, if it doesn't set up just right and at the best possible area, I'm ok missing the trade if need be rather than take sub-optimal positions with that much exposure.

So here's a brief synopsis of what I see in the positions and what I'm looking for to make the exposure worthwhile.

 Since calling the 2011 GLD top, as GLD has trended down, the first positive divegrence on a daily chart I suspected would be a counter-trend rally as GLD was already in an intermediate downtrend (#1), however the bounce from there was not of the caliber of a counter-trend rally and by the time we saw the second leading positive daily divergence (#2) it started to become clear we may be dealing with something bigger than a counter-trend rally, perhaps some near term base in GLD. By the time we made it to the range just before (#3) and the head fake below it that sent 3C in to another leading positive divegrence, it was clear that we were looking at a new base in GLD, potentially a primary bull market.

The point being, I don't take GLD shorts/puts lightly.

 This is the area labeled as #3 on the chart above, a range within the base and a head fake move below the range which saw very strong accumulation as you can see by the leading positive divergence. The move from the head fake (we commonly see head fake moves about 80% of the time just before a major reversal) has been exceptionally strong, sending GLD to 2 month highs with a solid 3.5% 1-day breakout gain on huge volume, still way underperforming our recent favorite, GDX/NUGT which have seen +19% and +66% gains respectively over the same period. This is obviously one of the reasons I believe we are starting to see pre-QE relationships start to re-emrge after being absent for about 5 years.

 However, no matter how strong the gain, consolidation of those gains, wringing out the excesses and the weak hands is a good thing for the longer term viability of the move. This GLD 15 min chart in a flat range after a near parabolic move up is a signal I take seriously, although I suspect it will be a constructive pullback/consolidation which will offer us great positioning on new or add-to positions with solid confirmation of accumulation during the pullback, the question is, "Can we make a tidy sum on the pullback as well?"

This is another example of a pullback signal on GLD's 10 min chart with a leading negative divegrence in the middle of a range where divergences are often seen.


Even a 5 min chart gives virtually the exact same signal, also confirming the concept of migration of the divergence or seeing evidence that the divergence is growing in strength. Still, as bad as these may look , compared to the 60 min, 2/4 hour and daily charts, it clearly seems to be little more than a pullback, even though they can be sharp, thus the question again is, "Is this a reasonable risk/reward set-up?"

Both GLD and GDX/NUGT (gold miners) have recent positive divergences in the 3- 5 min range that suggest they are not quite done and not quite ready to start their pullback such as the 3 min GLD chart above.

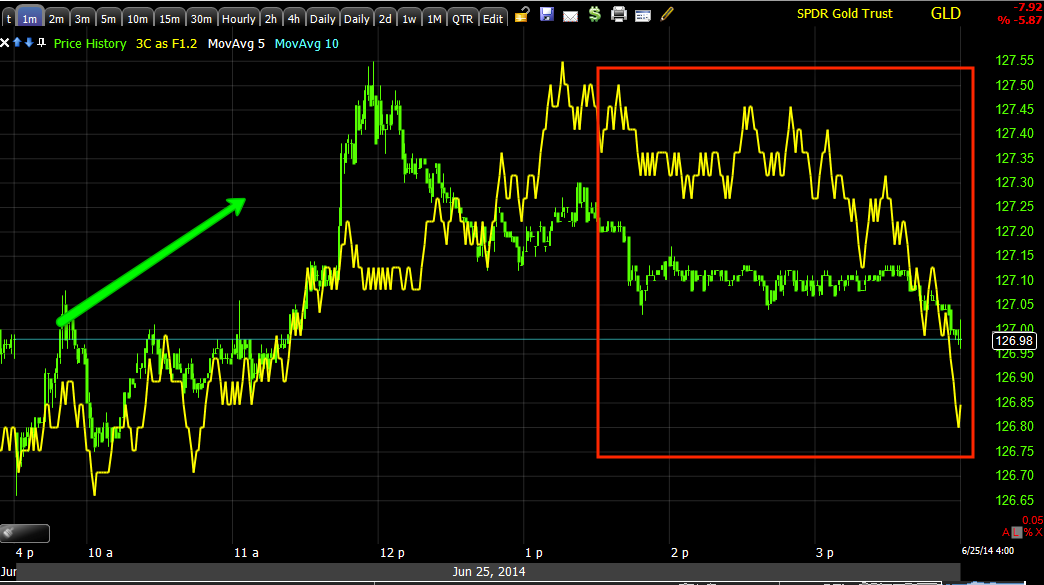
 I'd expect those 3-5 min positives to deteriorate before the positions (GLD puts, selling NUGT and opening DUST long) are ready, as usual, new divergences (a negative to take out the longer 3-5 min positives) will start on the earliest timeframes as it appears GLD started to see later today on this 1 min chart. When the 2 and 3 min are looking similar, we should be at a high probability/low risk area.

NUGT (3x long GDX/Gold miners)
 NUGT also has a strong longer term chart as can be seen at the left with a leading positive 30 min chart, but the exceptional move over the last 3 weeks or so has left it a bit over-extended and the 30 min leading negative divegrence gives me good reason to take gains off the table and perhaps even play the pullback trade via DUST long.

Again we have a 5 min positive divegrence in NUGT that suggests its upside move or at least its timing is not quite there for a position or closing this position in its entirety.

Like GLD, the 5 min positive above should see deterioration on the 1 min chart first and then migrate outward to the longer 3-5 min charts, I didn't see as much of that in NUGT today as the 1 min chart above is a little more positive than in line.

This is essentially all I'm waiting on, timing signals, if I miss them on an overnight surprise, I can live with it, what I can't live with is taking the trade out of greed or fear that I may miss it when it's in sub-optimal position.

I expect that we'll see deterioration here tomorrow as GLD is already showing some.

Market Update/Charts

This hasn't been an easy market to track today, it looks a lot like there's not much underlying trade, a lot like a text-book consolidation of yesterday's move, however I'd normally expect to see stronger distribution of a move of price strength intraday if that was the case. My original thinking this morning was that the positive divegrence started late yesterday after a -1700 TICK print which acts like a short term oversold indication, was that we'd see a move down and more to the right (sideways) overall allowing for enough of a positive divegrence to create a real bounce that we'd see selling in to.

Right now I can't say this is anything more than exactly what it looks like although there are hints of some distribution, they are on a very small scale and they'd have to show up at some point even if the goal was to create a positive divegrence big enough to allow for a decent bounce as we still would need price to come down to put in those larger positives. The way most charts sit, they are either in line or slightly negative so VERY short term trade is still a bit mysterious.

Looking at intraday Index futures, ES has a negative divegrence, TF (IWM) has the worst, leading negative and NQ (QQQ) has the one that is closest to in line, but given TF's I can't see any way that it can keep moving higher without a significant intraday pullback here.

 IWM 1 min is in line, however there was no positive divegrence here whatsoever to kick start it.

 IWM 2 min has a relative negative divegrence, there is a positive that started to form late yesterday and in to this morning's open.

The 3 min chart for IWM has nothing even close to in line, I can't say this is strong distribution, but it's not confirmation either, this is more in line with the TF signals intraday.

QQQ 1 min positive which was forming on intraday updates late yesterday, the green arrow is in line and a small relative negative at the red.

Again, like the IWM, 2 min QQQ has not kept pace and is in a small leading negative position, suggesting intraday downside, what happens at that point is the next question to put the next piece of the short term puzzle together.

QQQ 3 min is in line, I suspect the 2 min has not migrated over here yet, but there was also no positive divegrence to distribute.

SPY 1 min was in line and losing momentum, now a slight negative along the lines of ES.

 Like QQQ and IWM, the 2 min SPY is also in leading negative position, again I can't say this is distribution on any significant scale, so what comes during an intraday decline will tell us a lot about the next moves and how we might use them.

The SPY 3 min looks a lot like the other charts in this timeframe, not much to distribute and largely in line or just following price with no significant underlying action at all.

It appears as if the TICK is actually breaking the trend for intraday trade, below the channel will be decisive and it's close, this is something you can watch to give you early warning for intraday movements.

Quick Market Update

It looks like the intraday downside move is finally coming, it's still not telling us a lot, three's not enough distribution for me to think the next leg down is imminent, however until I see if there's accumulation near yesterday's closing lows, I won't know if there's some sort of bigger bounce planned, for now the best we have is this looks like a consolidation through time and somewhat price, consolidating yesterday's losses.

Charts coming.

Trade Idea: (short term) DUST long & NUGT / GDX trade Management

I really hope this is not a mistake, but at the same time I have to follow what the market is telling me and not make the mistake of falling in love with a position, which is easy to do with a trade like GDX/NUGT long as the return of nearly 50% in such a short period definitely grows on you.

As you know I already took half (profits) of the NUGT position off the table, I wanted to leave the other half just in case and then re-enter the  half taken off at the end of a NUGT pullback so long as it was constructive which is what I "thought" I was seeing yesterday even though in yesterday's post, GDX / NUGT Constructive Pullback,  I even mentioned...

"Yesterday when I exited half the long NUGT position... The idea was/is that a GDX/NUGT pullback is what I call a "constructive pullback", not distribution, but rather accumulation in to the pullback which makes for an excellent long entry or add to when the pullback looks to have ended as we have confirmation that there was accumulation of the pullback...Already this morning on a pullback of only 1.22 and 3.60% (GDX/NUGT respectively), we are already seeing signs of accumulation of the pullback which is unusual as the accumulation portion usually starts as price nears the lows of the pullback target area..."

Upon reflection, perhaps what we were seeing yesterday was in anticipation of today's bounce rather than the start of a constructive pullback as even yesterday it seemed too early and out of place.


We still have a +40% gain in NUGT on the remaining half position which is still significant and drawdown that I'd rather not sit through if there's good reason to make a change.

The safest play would probably be to exit NUGT and either put the cash in the dry powder fund or use it elsewhere for a short time, but I'm not looking to sit on the sidelines if there's a reasonable chance at adding to the gains by reversing the NUGT position and going long DUST for a pullback play on GDX/NUGT.

The GLD charts also seem to support the pullback view as I've also seriously considered a GLD put as the leveraged short Gold ETFs are very low volume.

The daily chart looks like this...

Here are the moving averages (blue=200, red=100, yellow=50), a break of the 100/200 at the same area would trigger a lot of technical trades (short) and the 50-day (yellow) would be an obvious target..

 The 60 min Trend Channel that I've been using for a near term stop has held the entire trend on this chart, but was stopped out yesterday clearly.

Yesterday's bearish engulfing candlestick (red arrow) is also confirmation of the downside reversal set up at the two yellow arrows,  which is a Harami reversal, today would essentially be considered noise.

The gap (orange) was an initial target as the 10-day was in the area, but that looks a bit too shallow.

Remember a big part of a pullback is a constructive pullback, smart money isn't going to chase miners, they are going to buy on the pullback so we'd have evidence of their buying before re-entering NUGT long which is ultimately the trade I like, however, significant draw-down on a pullback is not what I'd like to sit through when those resources could be used to make some solid gains until it's time to re-enter GDX/NUGT long.

Also today's candlestick with the longer upper wick is a rejection of higher prices (resistance).

 The 1 min GDX trend still favors a pullback. I'm not saying this is a perfect set-up, but it looks high probability.

The 10 min also favors a pullback

As dpoes the NUGT 15 min chart which is a bit longer of a chart than I'm comfortable sitting through.

Even GDX 30 min which has had good upside confirmation is showing at least a small negative all the way out on a 30 min chart.

And NUGT (it seems the more leverage ETFs have, the better/stronger/faster the signal they give).

As for DUSt, the 3x inverse GDX or opposite NUGT, this isn't the best set-up I've seen, but if NUGT and GDX go down, DUST must go up.

Here we have a clean/clear 15 min positive, it doesn't surprise me that there aren't many charts beyond 15 min as we are tracking smart money and they have large positions, it probably wouldn't be practical to enter a large position and try to get out of it on a pullback trade, thus I'm not too worried about charts not stretching further than 15 mins.

 The 10 min isn't beautiful, but it has been accurate and is positive right now.

As is the 3 min trend.

I think I'll take the remaining gains from NUGT and use them to enter DUSt long for a pullback in NUGT, bounce in DUST and when it's time , close DUST and re-enter NUGT long.

The only thing is intraday timing, I'll set some upside price alerts because I think we get an intraday bounce and that's where I want to execute the trade. I'm thinking somewhere above the 5 min 50-bar in the NUGT $43.25 range, I'll be watching intraday charts.

 intraday NUGT 1 min looks like a small bounce

As does the 2 min

The 3 min

And the 5 min.

Beyond that, I think the bigger move is going to be down so I'll let you know just before I execute, unless something in the bounce changes the dynamics which I doubt.

SLV Put Trade Updates

Yesterday on a precious metals pullback, following the lead of gold (and silver) miners as they seem to be reverting back to a relationship not seen in years under the QE regime, of miners leading precious metals, I put out a speculative (1/2 size position with a July standard expiration which is long for a pullback move) trade ideaTrade Idea: (Short Term Spec. Options) SLV Puts.

This morning's Final Q1 GDP shocker sent gold and silver higher in pre-market knee jerk move, with the net effect of sending the SLV put down from a 10% gain to a -15% loss, which is not as bad as it sounds for options with that much time for a move that should be a lot faster (pullback).

As with the rest of the market, things are pretty tame even in the knee-jerk PM complex. SLV is up .70% with a daily candle with a long upper wick denoting higher prices were rejected this morning and GLD is up about .15%, both are in areas of overhead and stage 1 resistance, SLV is at the gap from 3/17-3/18 which acts as resistance.

As for the charts, again, a bit tame... GLD charts are very similar in concept, but all around look worse, I may entertain the idea of a GLD put or at least put the idea out for those who may be interested, especially if you didn't go with SLV (not much risk management reason to take both if they are on a speculative basis/half size positions) so if GLD puts do come out, it's because I think the edge is very strong for the pullback.

 On a primary trend basis or longer term trade, there are few longs looking as good as the precious metals complex, this is a 4 hour SLV 3C chart with strong accumulation at lows of the stage 1 base area which ended with a leading positive as SLV broke to the upside making 3 month highs in no time .

The intraday charts were the reason for a "pullback" position and that's also why the leverage of puts were needed, on a straight SLV short, the profit potential is not there to bother putting the money to work and at risk in the market.

 A closer intraday view of the same chart shows a small positive toward the close yesterday that held up this morning and in line since, the dull part.

The same is true of the 2 min chart, the leading negative was the reason for the trade idea, but on a closer intraday view...

 The 2 min has the same positive divegrence at the same place late yesterday and the same dull in line status today.

The 3 min chart gives a pretty clear pullback signal, yet intraday it is bouncing about in line, however this is still in leading negative position for a pullback as this is still only a 3 min chart.

And the story is the same with a 5 min chart so there's not a significant positive divegrence and mostly in line intraday trade so I suspect a pullback is still very much a probability so for now I plan to continue to hold the put position.

As for Silver Futures, they look a little worse and more in line with the pullback trade idea.
 1 min intraday Silver Futures never went positive this morning and remain in a leading negative divegrence.

 5 min silver futures are onboard with a pullback move

As are 15 min

And the 30 min shows the uptrend confirmation at the green arrow as price moves sideways (note the increased price ROC to the upside just before the lateral range formed, again, seemingly bullish price behavior is often a red flag for a change of character, even though this is a short term change, the concept is fractal and works on all timeframes.

As for potential Trend Channel breaks and stops...
 Amazingly the tight 60 min Trend Channel (this is why this one an award, it's ability to adapt to most recent trend behavior unlike envelope channels or wild Bollinger bands) held the entire trend up, including now. A move below $20.13 on a closing basis should usher in a pullback.

As for the daily Trend Channel, it has a stop of approx. $19.40, although it will continue to lock in gains, this is a fairly small pullback of only about 4%, thus the need for leverage, however if it was a deeper pullback that filled the gap in the $19 area, I don't think I'd panic so long as the longer 3C charts held up.

I'll continue to hold the put position for now as I think it will work out.