Tuesday, March 26, 2013

EOD Market Update

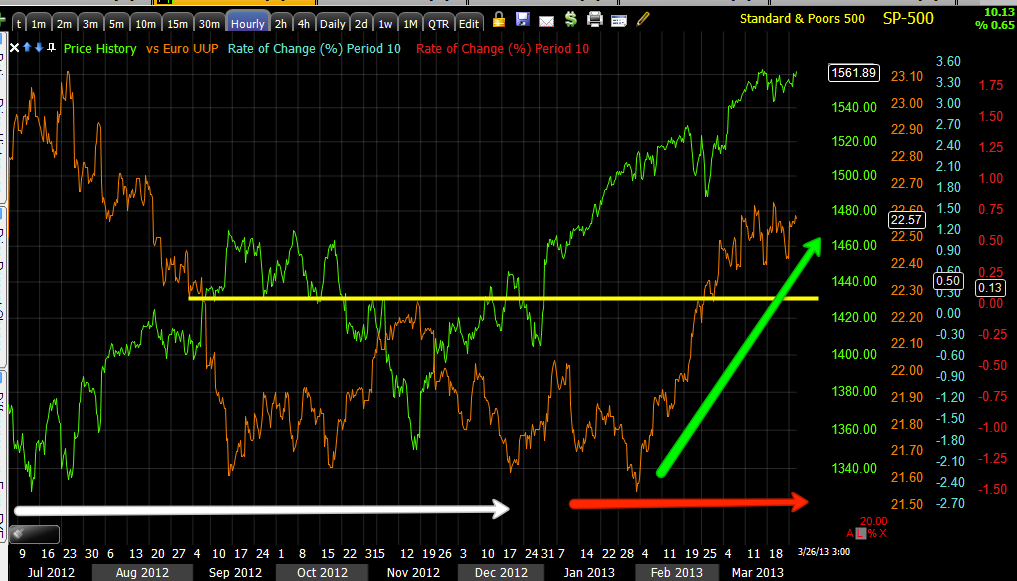
Well I don't have the closing data from CapitalContext yet, it's still lagging 15 mins behind the close, but as I said, we wouldn't see the model flip over the SPY because the differential was too wide, but it would give some sign and it did as it was moving up for the first time in hours.

Since 11:30 the model trended down until approx. 3 pm, then it trended up. The differential stayed the same as the ROC of both the model and the SPY remained fairly constant.

As for the assets that moved it, we know what goes in to the model, Credit, Treasuries and Volatility (specifically HYG, TLT and VXX), these are where I noticed a fast change and this is one of those 'Glimpses" of the market I often talk about, if you didn't see it happen in real time, looking back at the chart afterward doesn't do it justice as this was a fast move.

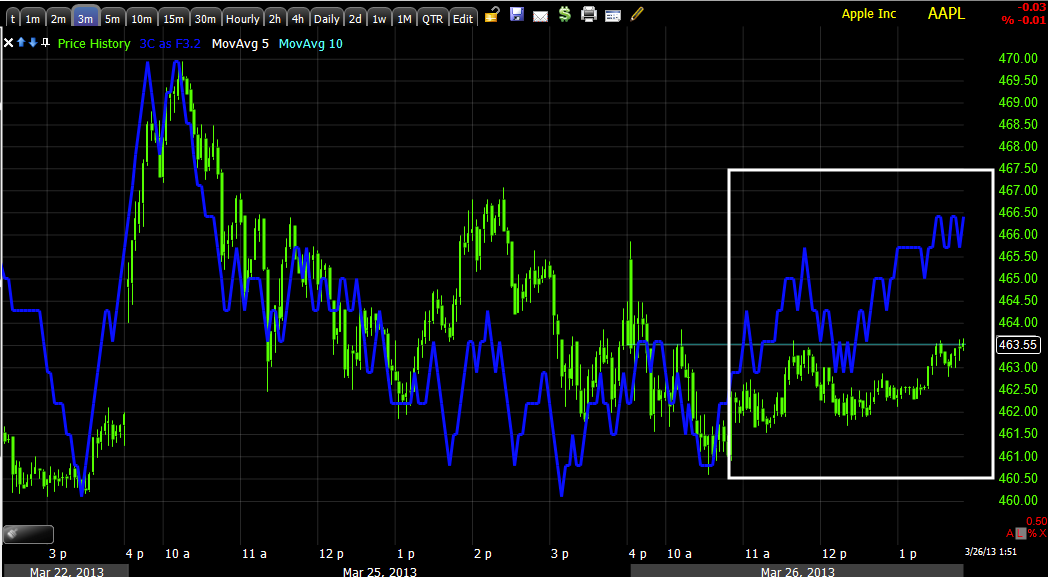
 This is the SPY vs HYG (High Yield Credit which is one of the three components in the SPY Arbitrage model above). HYG gave out early as we saw the Arbitrage model give out early, but HYG held in a very tight range for a good 2 hours and you'll see why. At the very close HYG made a sharp move to the upside, it didn't last long of course, but as the SPY and ES were starting to fade, they also got a boost from this move.

 HYG 3C 1 min chart with a sharp positive divergence and price moving within minutes of the signal.

 The 2 min, slightly longer chart shows HYG was flat (most likely because of the accumulation), although this is an intraday chart so it's not heavy accumulation, it was enough to support the EOD move and I suspect they still haven't given up on SPX $1565.15, although this will make 10 days now, a full 2 trading weeks.

During those 2 trading weeks because we all feel the grass is greener on the other side once in a while...
From the Dow-30 up +0.14% to the Transports down -0.79%, everything in between is +0.04% to -0.35%. Other than transports, nothing has moved more than a half percent over the last 9 days, 1 day short of 2 trading weeks. I have a hard time believing the Eurocrat's recent and biggest blunder has nothing to do with a lot of this as well as the, well the F_O_M_C.

Honestly, that's a pretty tough market to pull +49% out of in 1 day, but a lot of us did it and some of you did even better, hats off. 

"Take what the market gives!"

 SPY vs. VXX -As the SPY gained ground through the day the VIX futures weren't losing it, that suggests they were being bid for protection, a flight to safety of sorts.

 It took a pretty big bang to knock then off that support.

 To back up the idea that VIX futures were bid for protection today, 3C applied to UVXY (leveraged Short Term Volatility Futures) wasn't only leading positive until it too was jared loose, but making perfect higher highs and lows.

If you asked me what the market was going to look like tomorrow and I was looking at this chart, it would have changed 180 degreed in a matter of about 3 minutes, at least that's what the signal would suggest, but I have a hard time accepting all those bids for protection all afternoon were instantly closed in 3 minutes.

 SPY vs. TLT (Treasuries) and again TLT should have been making lower lows, it seems to have remained bid as well, which would be a true flight to safety, this is far from the first time we've noticed it in TLT as well as the 10-year rates as well as Swiss 2 year rates, everywhere you look there's a move toward safety and away from risk.

TLT was monkey-hammered a well at the close.

 Here's what it took to knick TLT down.

For the last several days, maybe a week, I've really been noticing and pointing out two things, 1)The market's inability to make it 2 or 3 points (some days), today only $1.20 which is a fraction of a fraction of the SPX, to that new high and this has been going on for what will easily be 2 weeks, maybe longer depending on where you look at momentum.

The second thing has been overwhelming information, not usually in plain site, but it's there if you look, that shows there's a nearly constant flow to safe haven assets both here and abroad, this in addition to some already very strong signals of such having already occurred in bulk.

I suppose thirdly we might consider the market using levers and still not getting it done.

I think it unwise to not at least consider the connection between sentiment toward the F_O-M_C and the market's action or lack of it. It seems no one wants to be the first to take on a tiny bit more risk and instead the great rotation is more of a stealth rotation in to safe haven assets.

Right now ES doesn't look too good...


Context

These charts unfortunately aren't real time, I think about 30 mins delayed, sometimes 15 mins so I'm not sure if they will show the SPY Atb. move, but 3C definitely picked up on a small, but very fast and sharp divergence in all 3 SPY arbitrage model assets around the time of the move.

Otherwise, ES and the SPY Arb. don't look good.

 ES is reaching toward the wides of the day with a -8 point differential between the model and ES, in other words risk assets are not sharing ES's enthusiasm.

The SPY Arb will not go positive even with what I saw, the differential is too wide at the wides of the day as of 3:23 p.m.

Not Liking ES/SPY 1 min

The charts on the 1 min for both are not to my liking, glad we closed when we did.

SPY $155 Weekly Call P/L

Here's the P/L for the position...


With the fill at $1.83 the gain on the position was almost +49%, not bad for a day

Closing ALL of SPY, not worth it

There are still other long positions that can benefit from the market move, I just can't see this as worth it at half with transaction costs.

Taking another Half off the Table in SPY $155

That will leave about 25% of the original position.

It may not be worth it to you, I'm a bit skittish here on Europe and the money is there.

Levers Pulled

HYG, TLT and VXX all have strong, very fast divergences, although I haven't seen the arb.  chart for the SPY yet, I'm almost sure this is what it is.

I'm thinking of taking a little more SPY calls off the table in to the momentum.

And Here's the News

Remember the disturbance in the force just about 45 minutes ago after we had some solid positive divergences in the market averages?

Well here's what was going on (you can guess which continent it originated from)...

The Dutch Finance Minister who is currently also the head of the Eurogroup, Dijsselbloem (Diesel Boom) had this to say as everyone else on the continent in positions of power are trying to convince depositors that Cyprus was a unique, 1-off case that will never happen again... Enter Dijsselbloem

*DIJSSELBLOEM SAYS LEVY ON WEALTH IS DEFENDABLE IN PRINCIPLE


*DIJSSELBLOEM SAYS DEPOSIT GUARANTEE SYSTEMS ARE NATIONAL


If they are national, then what happened to the Euro-area $100k depositor insurance gurantee? 


It sounds like he just said, 

"What we did in Cyprus is not exceptional or 1-off, it's sound principal" 

and

 "The Euro-Area deposit gurantee insurance is no longer a sure thing, it depends on how much money your banks have and how much we, the EU think we can take from private citizens to pay back banks across Europe and especially our friends in Germany."

If they were you savings, your business, your retirement, your children's inheritance, how would you interpret the above?

You think Obama's so called, Wealth Tax is bad? In Europe they don't even get to vote on it!


Leading Indicators. FX and no News

I couldn't find any news, it doesn't look like the levers have been reactivated...
 The SPY arbitrage model showed early manipulation of rates, credit and volatility, I could find each of those charts and confirm, since just after they were switched on, they went to the off position and have been running the opposite way of the SPY even since to give us the widest differential on the day at -$.60 as the model is leading below the SPY, ANOTHER INDICATION of the flight to safety.

CONTEXT for ES/SPX futures is little better, the model has been negative the entire day, a bit less so now then earlier, but still a good $7 point differential and that's pretty big when you still need about 5 points so in essence it's about a 13 point differential from the SPX new highs.

As for leading indicators, I was stumped on 1 thing, but figures it out quickly, to some degree...
 The run in commodities vs the SPX didn't make sense, this looks very risk on.

 I looked at the $USD and it is not supportive of a run in commodities, but one commod in specific I believe is behind this move in the group.

USO, which moved up on no news with a very high 3-day Rate of Change, I'm thinking what happened over the last 3 days as well as really pushing it on the 18th, you know what i came up with? Cyprus. The 18th was the first day the market was open after the first horrible EU plan was announced over the weekend and the last 3-days have seen the second even worse plan hatched (Sunday through today).

Remember I said Russia is playing it cool like chess players, but it's likely going to be a very long, cold winter in Europe? Well I think the market may be discounting that EXACT fact as Russia and more specifically Putin and Gazprom "Turn off the spickett" (in the vernacular of one George W. Bush) thus (as an OPEC member) driving oil prices through the roof as well as Nat. Gas. (UNG is having a decent day too).

 The lever of HY Corp. Credit (HYG) is obviously off, I'm wondering though whether this is true exodus from risk/HYG, there's a 2 min positive divergence, not sure if it is left over and will be wiped away or if it is there to stay and they'll try this again a bit later/tomorrow?

 I can say as a measure of pure risk, the sentiment seems to be clear, "Not interested" using FCT.

 The EURO which had been somewhat correlated intraday has been jerked around on all of the rumors/news/retractions and fear that the market actually knows the truth as the EU is just simply too damn dumb to hide it and that truth would be as the head of the Euro-group said yesterday in 2 interviews and then denied it, "Use Cyprus as a model for the rest of the EU".

 Notice a change in character in the Euro v the SPX? Check the date, the Friday of the plan and the next Monday after it was announced.

 Meanwhile the flight to safety, as predicted, continues to move toward the $USD as the correlation with the SPX to the left (white) is correct or typical and the one to the right (red) is very non-typical, a rising Dollar pressures almost all risk assets including stocks, so why have they held? A Hint: $1565.15


 The longer term correlation between the Yen and the SPX as sen above suggests clearly that the carry trade with the Yen as one of the pairs is or was alive and well, but the recent stumble in the yen twice has seen the market stumble, the first time it broke the Trend Channel and now look at it, why would the US market care what the Japanese currency is doing? Well normally it wouldn't unless it's part of a carry trade funding equity purchases and when you get scared that something might go wrong at 200:1 leverage, you sell the assets and close the carry.

 Yields also came undone from the SPX early this morning, this is a reflection of TLT and thus the SPY arbitrage as investors are willing to accept lower and lower yields to find some safe place to park money coming out of stocks.

 Longer term looking at the same chart v. the SPX, note the change in character on the Friday of the EU/Cyprus decision and the 18th, the Monday after it was announced.

Longer term there has been a flight to safety going on for longer than most thing, not the Great Rotation Out of Bonds and In to Stocks.

Good call CNBC!

SPY $155 Call P/L

This is half the position, half remains open.

The P/L was + 39% as they were filled at $1.71

Not bad.

Closing Half of SPY $155 Calls

Until I better understand this

Futures Update - What Now?

I haven't checked the news, but it looks like something fundamental hit, I'll check after this.

 Every time we get some positive momentum, this- ES intraday

NASDAQ 1 min futures

AAPL-May Even Be Worth an Equity Long

I like the option (call) trade, but there may be a longer term AAPL trade that is best traded without leverage or selectively in and out with leverage, but that becomes dangerous in a market environment like this.

 AAPL 1 min

 2 min

 3 min and we have migration through all intraday timeframes.

 5 min-now we have heavier money flows.

Ultimately between the intermediate and long term 2 hour chart above, there's work to be done, but if I were ever considering a long equity position in AAPL, this would probably be the time I'd take action.


Market Update

Here are the charts... I'll follow up with individual names like GOOG, AAPL, AMZN, etc. I also want to see if there's manipulation back on and what's going on with the carry, which at last glance was doing the same as everything else, "Flight to safety"


I love this so far (other than some frustrating intraday trade), it looks like our short term long positions are going to make money and then our long term short positions are going to make money from all indications, plus we can add or initiate new short positions on our terms as they come to us.

Why? Patience, knowing when to paddle in to the wave and knowing when to let it pass by and wait for the next.


 DIA 10 min-as explained last night, the DIA has the strongest divergences of all of the averages by the EOD yesterday, here's a 10-min chart.

 However going by intraday alone, you wouldn't think so. This is why comparing as many assets as possible, looking for a trend and seeing if it holds water is imperative to successful speculating in the markets. Remember what "3C" stands for!

 IWM 2 min leading positive off a larger basing positive.

 However, don't get too bullish and don't drink the Kool-Aid of a new SPX high, no matter what it does, this is just one of the longer term charts you should keep in the back of your mind and remember what the plan is, "Plan your trade, Trade your plan"

 Even R2K futures look decent intraday

 QQQ 1min positive divergence, I wonder where that came from, hint: "We took a position in the asset earlier today and it accounts for about 1/5th of the NDX's percentage move.

 QQQ 2 min leading positive...

 SPY is moving to a leading positive position.

 Our intraday system for taking the temperature of technical traders, the 50-bar 5 min chart has held as has the Trend Channel.

Momentum is starting to wind up in the SPY.

Market Update

We are getting some positive divergences in all of the averages, I don't know if the levers are back on, at last check they were in the full "Off" position, in any case, APL is among those that will help and the TICK is improving.

I'll see what the levers are doing, but I just collected a bunch of charts to post showing how they were shut down as the flight to safety overwhelmed market manipulation and that's an important lesson to learn, FEAR can do just about anything.

Levers Off

They are either off because the continued flight to safety is overwhelming any force used to turn them on or they are just failing for another reason, I'd think the flight to safety is the main reason, once again highlighting how difficult it is for this market to make a half a percent or even less, yesterday $.25 cents in the SPX, that's a fraction of a fraction!

The instinct of self-preservation is overwhelming even short term manipulation, don't just read that sentence, but feel it because the market is SPEAKING TO YOU.


 It didn't take long for the levers to be pulled this morning, but after a round of he said/she said , rumor, truth, denial, counter-rumor and lies in the EU, the market is just a mess and is acting like it doesn't believe anyone. Capital controls have reduced Cyprus ATM's from $100 EU a day to something like $35, more liquidity is needed at the banks and guess why? I covered this last night and old Wabble, or Schaueble (German Finance Minister) "didn't have exact figures" for the flight of Russian capital OUT of Cypriot banks during all the chaos of the last week from the time they announced the plan last weekend to the chaos and parliament voting it down without a single vote in favor, in the mean time as per typical EU fashion the Eurocrats were busy making sure the locals couldn't take out more than $100 Eur. a day while the Russians were taking out BILLIONS- the typical EU lack of due diligence, they left branches of these banks open in several other countries and Russians used the loop-hole to remove a large chunk (in the multiple billions) of capital leaving as I said last night, the burden to those few who didn't get out or the locals. Any one with an uninsured deposit of $100k or more will almost surely see a total wipeout of all of their  funds.  This wasn't an investment that they bet on that went wrong, these were their savings at a bank just like you and I that are being (likely  totally) confiscated and the small businesses in Cyprus that are among those with deposits of $100k or more are not only going to suffer the only group of people who brought and spent money in Cyprus, the Russians,  abandoning Cyprus as they have no more reason to stay in 5 star hotels or buy ultra-;luxury good or patronize local business, but on top of that, they are in the class of those with uninsured deposits and because the Russians (and rightfully so) found a way to get their money out while the Eurocrats played 3-Stooges, these are the employers who will most likely be totally wiped out.

The market's upset stomach today comes from a series of rumor, counter-rumor, statement and retraction in which as we all knew last weekend, Cyprus is the template and the Eurocrats have admitted it, so say goodbye to the EU financial system and this is the meekest among nations who will not inherit, but destroy the EU.

Once again the EU's grand "schemes" as they are always trying to rip someone off, have backfired on them and they truly shot themselves in the foot with a bazooka this time when they went after Russian money and in the end the Russians not only outsmarted them, but made the situation back-fire in the Eurcrats faces in a way they never imagined, PAR FOR THE COURSE!


AMZN Update

The AMZN April $255 calls (riding the roller coaster to the top of the hill, but looking forward to the drop) plan seems to be working, I think it will work-as I usually remind members, this is really more about a short set up that we are waiting to come to us, we just happening to be rising that move that we want to come to us (short term long position to enter a long term short position-confusing enough?)

 AMZN's longer term trend (2-day chart)

 This is what I think is the head area of a larger H&S top pattern. If we get the entry around $270 or better, we have about 6% position risk, if you have a $20k portfolio and are using the 2% rule, then you have $400 risk money, at $274 where we'd like to get in or higher, that leaves less than $10 risk per share which is less than even the 6% position risk. That allows a 40 share position which is over half of your portfolio, I rarely want to risk more than 15% on any one position so no matter how you slice it, if you follow the risk management guidelines, the total portfolio risk on an AMZN short is less than 1% of the $20k.

 As for the lost art of volume analysis, volume is exceptionally important in identifying a true H&S pattern rather than something that looks like one which we saw a lot of traders fall for this in 2009 from May to July, they saw the price pattern but never bothered to confirm the volume and subsequently many of them were squeezed badly.

This is a custom cumulative volume indicator I wrote, you can create it by using this code, Yesterday's volume + today's volume, in PCF language that most Worden platforms use, if volume is lower today than yesterday the line will tick down, but this gives you a much easier way to conduct volume analysis.

A H&S should have the opposite volume pattern of what you normally want to see in a healthy stock, volume should be light on rallies and heavy on declines, the orange area is a lot of volatility so this looks right.

 Longer term 2 hour 3C shows areas of accumulation and distribution, note the last accumulation area was very small, those shares would have been distributed long ago which means the ugly leading negative divergence showing continued selling is more likely than not, short selling.

 The 30 min chart has a positive divergence that can get us to the gap area.

 The 15 min looks good in the base-like pattern.

 Here is that base-like pattern, it's the right size for a move of that caliber.

And the 1 min chart in the base is leading positive through its trend.

I think our call will do well and when the time comes, if you are interested, I think it will be a high probability/low risk entry.