Monday, December 16, 2013

Market Update

Like I said before, I don't know if this is just a patch of softness, maybe a gap fill or the rotation we have been seeing as the averages come unglues from each other more and more every week.

The other possibility is that we are seeing distribution as it happens within this bounce, it doesn't mean the bounce is done, but the distribution events are strong enough to show up clearly.

Also as I said, it's not universal through the averages, some Index averages in the 1 min timeframe look like the DIA, others do not.

Ultimately I think it may provide some volatility, but shouldn't change the shape of what we expect too much.
 DIA 1 min clear intraday negative

IWM 2 min intraday negative

IWM 5 min shows the positive, but already damage being done or distribution at higher prices.

QQQ 2 min looks good, this seems rotational as I said.

 QQQ 5 min shows the same as the IWM 5 min though.

SPY intraday in line

And 5 min looking better than IWM or QQQ

I believe signals in the VXX / UVXY will lead the way to tell us when to make our moves, close short duration longs and enter shorts again in trading portfolios.

VXX 2 min shows weakness, this contradicts the DIA, but agrees with the SPY and QQQ

3 min shows more weakness

However the larger trend at 15 min shows a very strong trend that started to move, I believe it will pick up from there and create and second and likely third leg up.

PCLN Charts

As I said, it's the very short term and when you look at the 60 min chart, you'll see the size of the negative divegrence vs the $1200 area is really putting probabilities solidly in the bearish cap, but if we do see >$1200, I'd likely use it as an add-to or if I didn't have a position, a new short position for the longer term.

Short term bullish charts, this is why the Call option position was opened.

1 min leading positive

2 min leading positive

5 min leading positive

And the bearish...
 These are much stronger signals, 10 min leading negative, the $1200 area is highlighted.

30 min leading negative

And 60 min leading negative, you can see a move above the $1200 area isn't a very big deal vs the divergence and in fact would be a welcomed tactical entry.

I kept the PCLN trading short position open, the calls, if this works as planned, should make money and also serve as a hedge if need be, then when they are sold, I may look to add to PCLN short and the probabilities to the downside should make money on a longer basis/trend trade.

Opening PCLN January $1170 Calls as Hedge for PCLN Equity Short

I decided to open Jan $1170 calls, I expect this trade to last maybe a day or two and it will serve as a hedge to the equity short PCLN position.

The other way I was considering handling this was to let PCLN bounce, the $1200 area has been bothersome to me for a while, then add or initiate a new (or add to ) position. I'll post charts shortly.

EOD Action

Some late day action in to the close is looking a bit negative, there are still divergences strong enough to take us higher and the negative action is not universal through the averages, in addition, to muddy things up more, VXX is also showing some more weakness, so the two signals almost counter each other, I'm guessing this is gap filling or rotational movement.

PCLN on the other hand looks like it sees a bounce before a large decline, I'm trying to decide right now whether to hedge it, switch positions or leave it alone, definitely interesting late day activity though.

UNG / DGAZ Update

Looking at the charts for both, there are pretty impressive intraday divergences that imply a high probability that today's gap is filled, beyond intraday there are charts with high probabilities suggesting a move lower. I don't see this move as connected too closely with the broad market, I think it is its own move, but these two charts sum it up...
 UNG 2 min positive intraday looks like today's gap will be filled.

The 5 min DGAZ looks like after that there's more downside room for UNG, all of the charts confirm in numerous timeframes, I think probabilities are high of a gap fill and then a move lower. 

I was considering whether I should sell DGAZ and re-open it tomorrow or another day, I decided not to over-trade this position and just stay with probabilities, but I wanted to let you know.

Leading Indicators...

Leading Indicators suggest that we are both in a real bounce and that it is losing support as we go, but it still has gas in the tank, it paints a picture a little more negative than the market update, but not much more.

HY credit is underperforming on the day and HYG is underperforming on the day, VXX is outperforming on the day vs the correlation, see below.

 The SPX (green) is inverted so we can see the normal correlation that is 1.0, but here we see VXX outperforming the correlation, again the reason I would not short VXX/volatility last week. I think VXX is going to be the first place we are going to see a change moving toward the end of the bounce and the resumption of a leg lower.

Commodities are underperforming on the day and Sentiment indicators are split, 1 is in line with a slight negative bias, the other was the same, but has recently improved like the intraday market charts.

Yields
 I was just talking about the leading/predictive nature of yields vs SPX (green) as seen above, however intraday...

Like I posted last night, near term reversion to the mean.

While Yields called for a bounce and still support further gains, there is deterioration visible already.

Market Update

I've been watching with a lot of interest as things have been a bit slow today, but I'll show you what we have and what I think of it, keeping in mind the F_O_M_C STARTS tomorrow and the policy statement is Wednesday.

 SPY 1 min, this chart has at least been in line or confirming for most of the day, just recently we have seen a little more positive leaning in 3C.

The SPY 5 min shows the original positive divergence that this bounce has sprung from, there's enough size to the original divergence to push the SPY further, I have some reservations about it lasting in to the F_O_M_C, I believe it is likely that the bounce will end before the policy statement. As to opinions about why a bounce here and now, I'll get in to those later when I have a little more supporting evidence. There's always the chance of a leak and if that's the case, I'd expect 3C to show us that moving forward.


 As mentioned last week, most of the divergences are contained to the 1-5 min period, this 10 min chart is still negative so the bounce positive was not strong enough to move the 10 minute chart which makes me believe this is more of a last hurray selling / shorting opportunity for smart money before Wednesday. Again, I need more confirmation to put probabilities on what is as of now, just an opinion.


 IWM 5 min gives some sense of the positive divegrence and why we moved trading assets from shorts (took profits) and changed to longs for a short duration trade, looking to re-enter short positions. There's some loss of momentum on the larger chart, but not enough to cause concern about a downside reversal yet, but it does seem that they are selling in to price strength.

 The 1 min chart here too like the SPY is showing some more positive intraday activity as before it was largely confirmation.

 The QQQ 1 min also shows the same 1 min activity.

 We also see that on the 2 min so the Q's may see some better relative strength moving forward.

The 5 min QQQ positive divegrence and currently in line.

VXX is a good timing trigger in my view, while I don't want to short it, I do want to buy at the right time, so far I see only in line at best intraday.

The 2 min chart looks like VXX could see some more downside or at least be pinned to the area, further suggesting the bounce in the market is not over or moving that way yet.

 At the 5 min chart there is a positive in place so I do think VXX will see a strong move higher when this move shifts, this is another reason I don't want to short volatility, I think it will hold up better than the correlations suggest.

SPOT VIX's consolidation doesn't look like much of a consolidation at all, in fact it looks like it has considerable relative strength.

The TICK index is showing some late afternoon strength as the 1 min charts are doing above.

My custom TICK indicator vs SPY 5 min shows that there's no serious damage here yet and the move is still likely going to make more upside gains.

ES 15 min is one reason I took this move so seriously and moves almost the entire trading portfolio to a long posture.

On the 5 min chart there are some signs of initial distribution , although not enough to suggest closing positions and reversing course yet.

I think most of the lateral trade intraday has been because of the EUR/JPY losing strength, but it has recently turned to the upside which is probably why intraday charts are improving.


Finally, NQ 1 min again shows intraday improvement, again I believe this is because of the EUR/JPY carry pair's performance through the day.

I'll check a few more indicators, but this still looks like a "Trade management / Patience" market.

USO Update

It's no secret that I like USO / oil a lot for a position type move, longer than a swing trade, not quite a primary trend trade though, still worthwhile.

It's also no secret that I've been expecting a correction in USO, corrections can be price based as in a pullback or time based as in a lateral consolidation, I "Assumed " USO would see a price based correction, but that wasn't an assumption I had any grounds for, it's highest probability, but the only thing I had grounds for was a correction, as to what type, that's for the market.

USO is still acting well within the normal parameters of a correction, I'm not convinced it's a long again yet, but I am convinced it will be.

I've tried not to draw on the charts to allow you to look at the divergences for yourself, although I have given hints. Remember that the longer term charts are the highest probability and in a correction situation, the short term charts will usually be negative and we know the correction is ending as they start going positive and all new divergences (such as this positive) will start on the fastest timeframes and work their way to the longer timeframes like 2, 3 and 5 min.

Here's the charts for both the WTI based USO and the Brent based Futures, you'll find they have very similar signals at similar areas and timeframes.

 USO 60 min big picture, there are several set ups here, the most recent is the most important and the highest probability.

The 15 min chart shows the initial movement warning of an upside move and then the movement warning of a correction and there's even a head fake signal in there just before the reversal to an upside move.

The 2 min chart is the intraday action, this shows you more evidence of a probable pullback, but also tells you something about where the pullback is in the process. Certain things will have to happen before the short term probabilities change and move USO back on track toward the longer term highest probabilities, this is all very normal price action, there's nothing here unusual.


 Here's the X-over system, it's hard to call a pullback to a specific average when the long signal just started.

Crude (brent) futures.
 intraday 1 min chart tells you something about where oil is in the pullback process, much like USO's 2 min.

The longer term 5 min chart tells you something about how serious or not serious the correction is.

The hourly chart is kind of an overview map of what is going on

And this 4 hour chart shows the changes in USO and the highest probability trend right now.

UNG Update ( DGAZ Long)

UNG is another long term long position that I really like, it had a recent breakout and as of last week I was expecting a pullback in UNG so I went with DGAZ as a way to play the UNG pullback (DGAZ is the opposite of UNG essentially with 3x leverage).

UNG, as expected pulled back today (or started it) and DGAZ is the #1 long from last week's trading longs picked, so far a 6+% 1-day gain. So whatever the UNG analysis, it applies to DGAZ inversely (opposite).

Even though we have a decent gain today, I never thought this would be a long duration or even medium duration trade (like the rest of the positions/market). Here's what we have thus far...
 The first thing that caught my attention about UNG almost a year ago now was the change in character from a solid downtrend to a large or ever increasingly larger lateral trend consistent with a base. We've had long term trades, we've had +25% gains and traded around UNG and have done well, but the big picture trade hasn't emerged yet, that's a stage 2 liftoff out of this long lateral base and when that happens, UNG has the chance to be one of the biggest runners of the next year or two.


Here's the recent breakout, volume and the candle for the day were excellent, a strong breakout, but there were signals back then that we'd see a pullback, we just had to wait for them to become more defined. Note in yellow the bearish reversal "Hanging Man" candle and the increased volume, one of our concepts when dealing with candlestick patterns is volume confirmation, I'd say a candlestick pattern that has increased volume (bullish or bearish) is about 3 times more likely to work than one that has normal or average volume, so that candle was impressive.

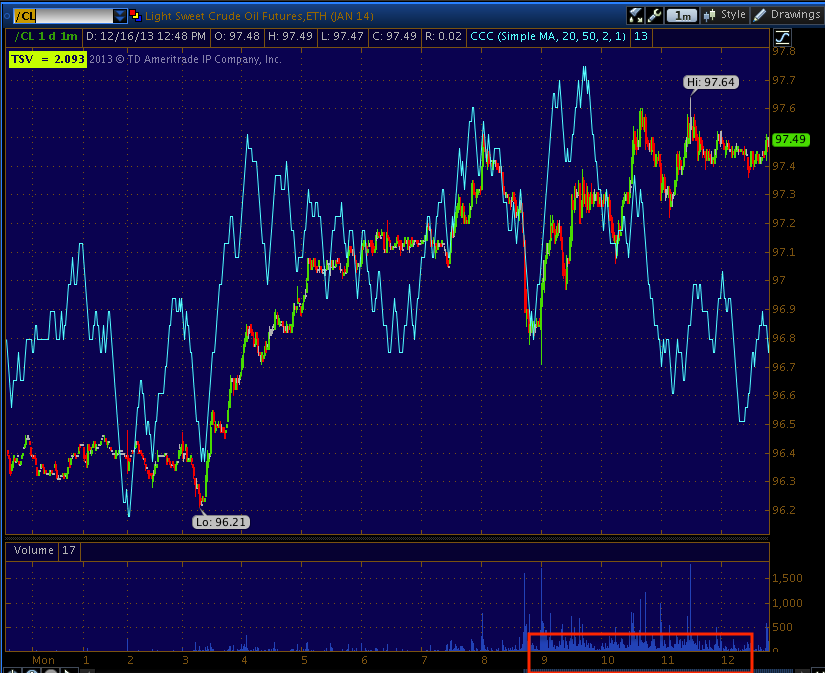
 This is what DGAZ did today, the recent surge in volume here is indicative of a change of character and a short term capitulation event, taken alone it may not mean as much, but with UN?G, they tend to confirm each other and raise the probabilities of our trade working.

My X-Over Screen is tricky in a lateral range like UNG has been in, but it is in a long signal, even now. The first pullback with this system on a new signal is almost always to the 10-day yellow price moving average, in this case though that "seems" a bit shallow to me, but for today I think we've seen as much as we are going to see, at least for now.

UNG's 30 min 3C chart has been deadly accurate in calling distribution and accumulation and the most recent pullback signal on a negative divegrence, but not one so damaging as to threaten the breakout.

 The 5 min chart overall has been a good timing indication as it went from in line on the uptrend to negative recently, so far this morning's gap down "seems" to have some accumulation, this is what we want to see considering DGAZ is a short term trade, the longer term trade is UNG long and the accumulation of a pullback is EXACTLY what we look for to confirm our opinion about UNG and to allow a tactical re-entry long in UNG or for a new position, it allows you to get in at a better price with a better risk/reward profile.

However, I don't think this signal on its own is enough to tell us to close DGAZ long and re-enter UNG long, it's just a good sign that things are going as planned.

The 30 min DGAZ shows the same confirmation of the downtrend as UNG showed at the uptrend and shows the same positive divegrence where UNG showed a negative divegrence, again this is confirmation as these may be related, but they are two different assets completely with different leverage, different management, and most importantly different volume which is key to 3C's signals, so when we get confirmation like this, it's very valuable information.

The 5 min DGAZ was also showing the probability of a near term reversal was very high with a leading positive divegrence, compare to UNG's 5 min chart. What makes the chart more compelling is how it has been spot on correct about the negative that turned prices lower, the in line signal confirming the trend and the positive sending it higher, that's 3 for 3 and with UNG confirmation, it's 6 for 6 on one timeframe alone, this is how we build a case or discover a built case for a trade, the more confirmation the better, after all 3C is a reminder to "Compare, Compare, Compare".

DGAZ's X-Over Screen is in a sell/short signal, but will likely correct like UNG to the 10-day yellow moving average, that is where the first correction after a new signal usually ends up, in this case, I could see a little deeper correction toward the blue moving average, but then again with the F_O_M_C Wednesday, there may not be enough time.

For now DGAZ is just being managed, I'm looking for shorter charts to start changing and giving us a clue that the move is about to end, then DGAZ will be closed for a profit and UNG will be bought at a lower price.

So far, so good.