Thursday, March 15, 2012

AAPL Close

AAPL's close was trapped between former support of yesterday's close (now resistance) and today's early intraday lows (support).

 On a 5 min chart this morning's support is very clear as a long hammer around 10 a.m.. After both levels failed, a test of resistance at yesterday's close (top trendline) failed.

 This is a longer term daily chart so you can see how big the true range of the last two days has been compared to AAPL's price history, as well as volume.

 AAPL's closing candle was just shy of a bearish reversal candle formation called "Dark Cloud Cover".  According to Steve Nison (probably the US's foremost authority on Japanese candlestick charting), the components needed for the formation are 1) a strong up day (I showed you the chart above so you can see how large yesterday and today's ranges actually were which is not as clear on this chart). 2) the second day (today) should open above yesterday's intraday high (the higher the open the better), which we saw today. 3) Today's closing candle penetrates at least halfway through yesterday's body, today we saw about 1/3 penetration instead of half. Because it didn't close half way or more, it is not considered a true "Dark Cloud Cover", but Nison says he believes penetrations of less then half can be valid, but prefers to see more confirmation.

There are a few things that make the pattern more powerful, 1) the strength of the day before, as you saw in the longer term chart, yesterday was a large candle. 2) Heavy volume on the open of the second day. Clearly today saw heavy volume on the open.

All in all, it's not the bearish engulfing candle that we saw earlier today, but with today's volume and the size of today's range, this was clearly not a good day for AAPL and opens the door to a reversal.

Here's some AH pricing

 ES rolling over a bit.

I usually don't care too much for AH action, but looking at the EOD 3C charts, it looked like the late dat bounce was going to roll over.

For instance in the QQQ, the bounce from 2 p.m. to the close looked like it was going to roll over both in 3C and price itself, in AH it has.

QQQ AH

I thought the same about the SPY at the same area...

In AH the SPY has started rolling over.

More updates coming...

AGQ Trade Idea (long)

This is another hit and run (shorter term trade, but whatever the market gives, I'll take whether it's a day or several weeks). I saw this one earlier but wanted to see a little pullback, I got the alert it pulled back and what I wanted to see in 3C started to form. This is an Ultra ETF for Silver so it may make some sense with the earlier Gold idea.

 I'll keep this simple, this is the daily

 This is the 15 minute, I wanted to see a pullback from that small shooting star at the top of the bounce.

 Here's the short term 3C chart showing a positive divergence, but also showing a likely pullback which has taken place.

The 1 min chart is starting to turn up a little.

I'll probably try this one out in the options model portfolio, I consider it speculative just because I envision it to be a shorter term trade, but whatever the market gives, I'll take.

APKT Trade Idea (long)

This is another short term trade idea, I would probably play it with options (buy calls), you can define you risk that way as well.

 The long term daily chart...

 Here's a closer view of the 60 min chart, it appears a small base has formed here.

 Off that base we saw a move up and a bullish consolidation pattern, as usual these can be candidates for a shakeout, but it's a fairly small triangle.

 With the 60 min trend channel, a stop could be placed o a closing basis around $27-$27.25 or so.
This channel held a month of the downtrend.

 On a 15 min chart there appears to be accumulation right in the small base area.

 The same for the 5 min chart...

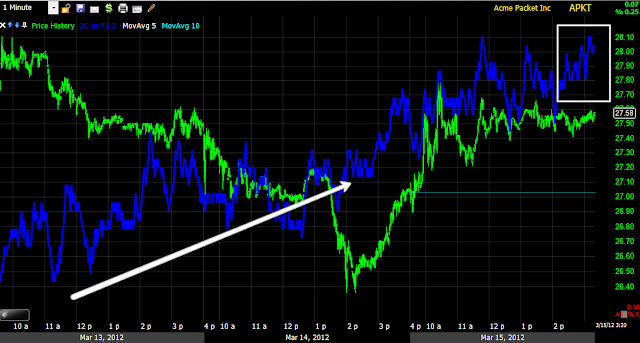
The 1 min chart looks like it wants to move soon.

I don't see this as a long lasting trade, but using some call as a speculative trade, it may generate some decent gains quickly.

AAPL Update

AAPL just tested resistance at yesterday's close and backed off, now it's heading back to today's intraday support which it broke earlier, forming a new support level at today's lows.

AIG Trade Idea Follow Up

AIG was an idea from 2/24  (short)

 AIG came out with earnings and the price action that followed was very reminiscent of AMAT which I'm still bearish on.


 Here's AMAT, from what I recall earnings were good in after hours and AMAT gapped up, but the conference call was the next day during market hours and I believe guidance wasn't good, so AMAT gave back all of that big gap up and then some.

 AIG is very similar, on my custom crossover screen (to prevent false crossover signals), AIG is very close to triggering a sell/short signal.

 The longer term charts didn't look good going in to earnings and still don't look good, they have actually deteriorated.

 However there's 1 chart that suggests AIG may bounce similar to what AMAT is doing now, the 15 min. Ultimately the 30/60 mi carry more weight, but positioning is everything.

Here's AIG in my Trend Channel on a daily chart, the move in yellow alone as well as the previous large green candle outside of the channel suggested something was brewing. As you can see by the red trendline, AIG has spent 6 days just barely above a sell/short signal for the Trend Channel. There's two potential plays; 1) based on the 15 min positive divergence, a bounce somewhere in the white area which is an open gap, that would also put an entry very close to the Trend Channel stop for a short position so the risk would be fairly small. The second entry and this is probably more market dependent, would be a break below the trend channel on a closing basis, the area would be around $28.05, although I'd prefer to see a solid break of the channel.  Maybe set some real time alerts for both options, I will as well.

Trade Idea - ABX (long)

This is more of a quick, maybe swing type trade, but GDX and GDXJ both look interesting as does ABX.

 Large volume like yesterday's (within an established down trend and with a long lower wick on the candle) is most often a short term reversal signal.

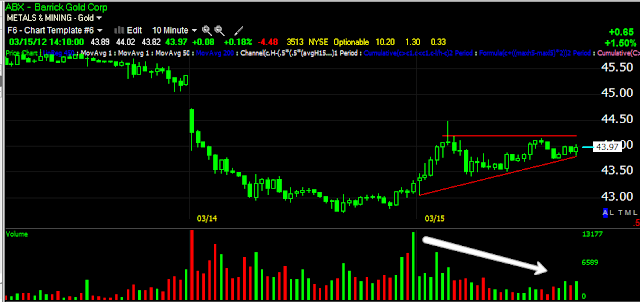
 Intraday on a 10 min chart you can see a bullish ascending triangle taking shape with correct volume, you always have to be aware of a shakeout in well formed continuation patterns like this.

 Both the intraday (60 min) close within range as well as the ATR have increased, I'm using a 60 min Trend Channel as a potential stop, I'd prefer on a closing basis considering the shakeout factor.

 The 15 min 3C chart is leading positive.

As is the 5 min. I think with the trend channel where it is as a stop on a closing basis, the risk / reward set up looks pretty good here. I'd probably use the Trend Channel as a trailing stop as well.

Quick Update

 ES

 SPY 1 min

 SPY 2 min

 SPY 2 min since bounce

 SPY 5 min

AAPL, who knows how we close, but right now it's heading for a bearish engulfing candle on decent volume

AAPL just lost intraday support

AAPL breaking intraday support.

AAPL A failed Test of Support?

Technically, yes, but there's still one more support level to be tested where a tweezer bottom (support) was formed earlier today.

 AAPL in the red on a failed test of support -0.50%

Earlier intraday support in white, this is the real support for today.

Credit/ R.A./Sector Rotation

First off, a White House aide has refuted the earlier story of a release of the SPR which sent crude down $2.00 in minutes. I'm running a scan for some individual stocks right now so in the meantime, here's the Credit/Risk Asset/Sector rotation charts.


 Commodities are underperforming intraday, but not by a lot as metals and PM's have seen some gains (GLD/SLV/Copper).

 This intraday action is still no where near enough to put Commodities in a risk on mode and are lagging the market bounce badly.

 High Yield Credit is selling off for the second day, diverging with the SPX.

 High Yield Corp. Credit is doing the same

 Here's Energy vs the SPX today, clearly lagging, but not the worst of the 3 pillars.

 Financials have been in line, since capturing this though they are starting to diverge away from the market.

 Of the 3 main industry groups,  the biggest laggard is technology, which may have something to do with the chart below...

 AAPL's 6th test of support at yesterday's close

Sector rotation appears to be a non-event, financials are strong at the bottom as you would expect from the chart above, Tech is falling off as you would expect from the chart above. There's good performance in Industrials today which you might substitute with the words, "Large Cap". Although there doesn't appear to be anything particularly exciting about this chart, I've seen these enough times to venture a guess that Utilities , Healthcare and Staples (all defensive plays) will start raotating in some time today.