Friday, April 19, 2013

Leading Indicators, Amazing.

***I captured the charts for this post around 1 p.m., just after the first pullback and before the range developed followed by the late op-ex Friday rally combined with the 3:30 ramp.

In any case, I captured the charts, both intraday and a bit longer - in line with the expected bounce move. You can see the incredible job Leading Indicators do at both and get an idea what this bounce should look like.

I have an appointment with the AAPL Genius Bar I have to rush to, but I'll catch  up on the market later, although all you have to know is right here. So keep in mind what time it is, intraday charts are for intraday moves, longer charts are for the bounce. I'll let you put it together, most assets are compared to the SPX in green, all indicators are labelled on the charts. Enjoy and talk to you soon.

Have a great weekend!

*Start of the post...

I just wish I could use this keyboard that is off to my right and spilt down the middle so I can't find the keys, then I have to go to my left to use the trackpad/mouse. I'd say I'm about 10x as slow!

I'll post the indicators though because if this doesn't convince you of their worth, nothing will and it tells you a lot about what we can expect from this move in to next week.

 CONTEX

 SPY Arbitrage

HYG

HYG-I almost stopped right here, says it all.

HY Credit

HY Credit

Commodities

Commodities

FCT-risk sentiment

FCT

HIO Risk sentiment

HIO

Treasury Yields

FCT Risk sentiment

$AUD

Euro

Euro

Euro futures

Yen

Yen

Yen 1 min futures

TLT-long Treasuries

VXX VIX Futures

GS

GS is already an equity short position that I'd like to add to on some strength, I think it will bounce and give us that chance-whether you want to play the bounce is up to you. I will- leave the short in place so the majority of the equity positions are in line with the primary trend (down) as well as providing a hedge vs the call positions.

GS 15 min is not only positive, but also has formed a bearish descending triangle that technical traders will short, especially if there is a break below support, even for a minute (long enough to trigger limit orders) and that is how Wall St. uses Technical Analysis against traders.

DOW Position

I decided to split the Dow/DIA long and went with DIA May 18th (Monthly) which is all that is available in the DIA (there's only about 145 stocks that offer weekly options) with a strike of $141-just in the money by a few points and the rest of what would have been put toward that position I oped a UDOW 3x long ETF. I figured I might take Call profits early on momentum, but the ETF I can hold longer and still have leverage and less risk.

Market Update-DIA trade

Earlier I said I thought the downside pullback was done and we'd consolidate sideways, that has happened. I don't see high probabilities of anything more than that today, however the important charts are using this lateral consolidation to build as I thought earlier. This may be op-ex Friday (PIN) related? However I do see the DIA as a good long opportunity here, perhaps option/calls or leveraged long etfs, like DDM or UDOW (2 and 3x leveraged longs respectively).

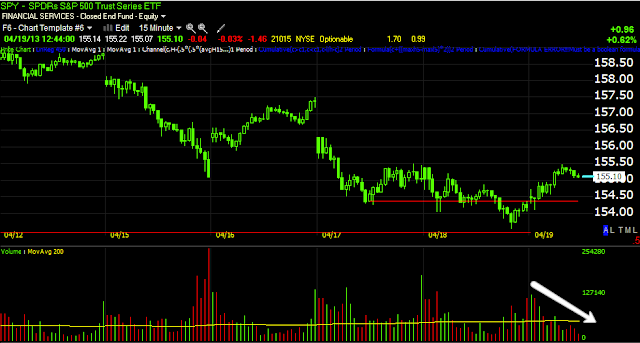
 SPY todaY, FIRST PULLING BACK AND THEN CONSOLIDATING LATERALLY (SIDEWAYS) which shapes out the Inverse H&S bottom pretty well.

 IWM 5 min doesn't look great for furtheer gains today

Nor does the QQQ 3 min, although toward thee end of op-ex Fridays as most contracts are closed, the market has more of a free hand.

SPY 1 min

SPY 5 min is pretty close, it could go either way.

 DIA 1 min

DIA 3 min

DIA 15 min


AAPL Update-Charts

 1 min

 2 min these are the intra day as to why I like AAPL here and now

 2 min chart's impressive trend

5 min chart- I can see the divergence because I'm so use to looking for them, but I added Rate of Change to 3C in red to better illustrate the divergence

10 min

EXCELLENT 15 min leading, if thee divergences stopped here, I'd still consider this worthy of even an equity long with no leverage

15 min trend in perspective

30 min chart in perspective

For a long time I have suspected something long term was happening in AAPL, I just couldn't find all of the charts liming up and didn't understand what the possible trade that was brewing was

This is the long term daily chart and primary trend which has moved from an intermediate down trend to a primary or a bear market in AAPL, but even without my notations, I think the halt in 3C negativity is obvious, thus putting AAPL in line for a counter trend bounce.

Target? I don't make forecasts on targets usually because there's no way to objectively define that in my view, but AAPL has lost over 300 points, if we use Fibonacci retracement levels which work pretty well, then maybe AAPL takes back 25%, 33%, 50% (150 points!) or even 66%.


AAPL Update

I'm pretty much set with AAPL, but if you are considering a new position, either Calls or even AAPL long (because I think even a long equity trade will be worth it for a counter trend bounce-Remember that counter trend rallies/bounces are some of the most powerful you will see in any type of market), then I think now is pretty darn close to the time. I'd add now if I had the room.

Charts coming next.

Update

I'm serious about the DIA, if I wasn't so handicapped today with technical problems, I'd be buying short term DIA calls, maybe a day trade, maybe in to next week.

As for the market, currencies are improving, divergences are improving, I kind of think the downside is about done and we consolidate sideways while the divergences build.

SPY Gaining Some Upside Momentum

I saw this a few minutes ago, but I'nm not convinced the pullback is done for today yet. As for the Leading Indicators I was capturing, they really are living up to their name, not just intraday, but very strong for a lot more upside on this move that hasn't even cleared the base yet.

I think a pullback here is great, it gives us a last chance opportunity to get ready.

?  
 The 1 min intraday is not quite there yet, but I saw it going positive just before price.

 SPY bouncing off the 5 min 50-bar

 Check intraday momentum, called the pullback perfectly and now is starting to build positive.

EUR/USD is also going more [positive which is good for the market when it turns up.

DIA v. SPY

Unless there's an op-ex pin today, I think there are pretty good probabilities the SPY/market makes another move higher this afternoon, but the DIA looks ready now.
 DIA intraday looking ready to push higher, it might even be a decent day trade for those who are nimble and have the stomach for it.


The SPY by contrast looks as if it could pullback toward that inverseH&S pattern, but there's no saying it won't be a slanting neckline with a shallower pullback and these really don't have to be that symmetrical.

The $USD looks like more pullback, but the Euro looks like it wants to move higher, I'd say the $USD carries more weight. I'm going to check leading indicators as well as look for some opportunities, AAPL is among them.

Market Momentum

I'd say we are on our way, especially after that stop run yesterday in the SPY, it was 4 cents away from the level I predicted the day before when I said, "If it were me" and "If I'm thinking like a crook", I guess you see it enough, you kind of know their games to some degree.

In any case, here's the short term intraday momentum vs the bigger picture (for this move) as well as the one tool you can always use to help predict intraday momentum which is excellent  for tactical entries or exits...

 QQQ 1 min intraday momentum fading with non-confirmation...

 However it's not much of a concern as the next timeframe at 2 mins looks perfect. In fact, this may lead to an add-to or new AAPL entry position.

 QQQ 5 min leading positive at what looks like an almost complete inverse head and shoulders bottom.

 QQQ 15 min shows last week's run on tiny relative accumulation and a really nice current 15 m chart.

 SPY 3 min intraday is peeling away from price a bit, 3 min is still an intraday timeframe.

 15 min looks great for a continued move.

 Intraday difference in $TICK momentum

And TICK itself is no longer trending intraday, that's a good indication for intraday activity.

I see the SPY has already lost momentum and looks like an intraday correction is coming.
These are some tools for your tool box and you don't even need 3C for the intraday, just apply ROC (Rate Of Change) to price and look for the divergence, it's there.