Monday, May 23, 2011

CHINESE STOCKS

I wrote the other day about a few funds that are having a spectacular run in identifying Chinese frauds companies listed on the major exchanges. When the blow up, boom-lots of money real quick. These few funds that specialize in Chinese Fraud stocks are outperforming the market by incredible margins. It kind of reminds me of the ".com" craze, when anything with a .com, no matter whether it was a viable company or not, instantly had an IPO fetching $100, $200 or $300 a share, and today, most of them are either trading at much lower valuations-or more likely are no longer trading.

So I've compiled a list of 106 Chinese companies trading on the major exchanges. While I've spent most of my time putting this list together, I have a feeling that 3C will be very useful in uncovering candidates.

I'm going to spend a few hours with my wife-it's been a crazy family day. And THANK YOU FOR THE LETTERS/EMAILS asking about my mother. She had a rough operation, it was meant to be 3 hours and ended up , as far as we can figure, between 10 and 11 hours. The side effects from being out that long have been harsh, but she's coming around, although she's been hallucinating a bit, seeing butterflies and the like (sounds pleasant) she's getting better every day. So again, thank you for the support and understanding.

If anyone is interested in looking at the list I compiled, maybe some of you using 3C, just send me an email and I'll send the watchlist to you.

Market Breadth

It was a long day to finish pretty much where we started. That also forms a doji or star on the daily chart.

I've highlighted several past doji days to illustrate that a doji or a slightly wider body candle, a star, are often short term reversal days. Today the US equity markets followed the overseas markets with not much on the economic data front, the market was obsessed with the crumbling E.U.

I looked at breadth today and found the following,

Only 7 stocks in the NASDAQ 100 closed in the green, 3 closed neutral for the day and 90 closed down.
The Dow had only 1 gainer of +.29% (MCD)
Of the 1901 Russell 2000 stocks, there were 259 gainers, and 43 that closed unchanged.
The S&P-500 had 37 gainers and 3 closed unchanged.

Internally the IWM had the best breadth, but the worst price performance; it too posted a doji-star. The largest price/volume relationship in all 4 was close down/volume down.

Here's a look at the closing charts
 Like most other averages, the DIA showed a pretty strong 15 min chart

 Here's the IWM doji-I'd like to have seen volume much higher today.

 Surprisingly strong 15 min IWM

 IWM 10 min

 IWM 5 min

 QQQ 5 min was the strongest for the Q's, the 15 min wasn't horrible, more like in line or a bit better.


 The SPY has long been traded by day trades using a 50 bar average on a 5 min chart, it found some support there at the close.

And the SPY 15 min chart

I'd feel much more comfortable suggesting the market today may have entered a 1 day oversold condition if the volume was higher. It would suggest short term capitulation. As far as the price/volume relationships within each average, Price down/ Volume up was not far behind price down/volume down. That taken with the doji/stars as well as some of the 15 min charts refusing to drop with price, suggests to me that today may have been used as an accumulation day for a bounce up, whether dead cat or otherwise. I wouldn't go so far as to say it's high probability, but I would say it's the highest probability of the multiple scenarios we have to consider.

Today's 3C action was somewhat similar to the reversal day on 5/17
I would even say that the apparent divergence now is stronger then 5/17's.

Looking at the 15 min chart, on 5/17 3C moved down to confirm price action, today that didn't happen so from a 15 min chart perspective, this divergence also looks bigger.

Tomorrow is another light day on the economic calendar, I believe new home sales is the only thing of note.

I'm going to look through some more charts and keep an eye on the Euro/USD, if anything interesting pops up, I'll post a follow up.

Lets not lose sight of the big picture though...

We've seen this market go from good price confirmation to a very strong negative divergence.

Market Update

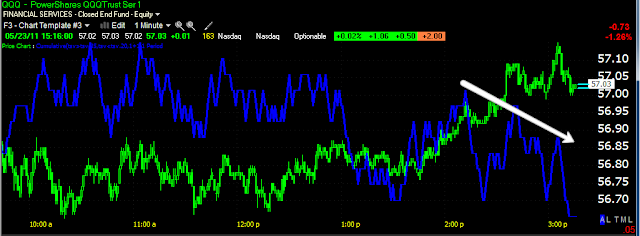
I'm using the Q's as an example for expediency, bit the other averages look the same.


 1 min negative divergence setting in which may be a consolidation or intraday shakeout...

With the 5 min charts still looking unusually strong considering what the 1 min chart looks like. Some charts longer then 5 minutes in some of the averages look strong as well. So we'll see if this is a correction, a multi-day shakeout or something else. Again, these are the trees, the forest looks pretty ugly.

And finally some movement

 DIA

 QQQ

SPY

I'd keep an eye on the dollar as well and all of the other assets that correlate inversely, i.e. USO.

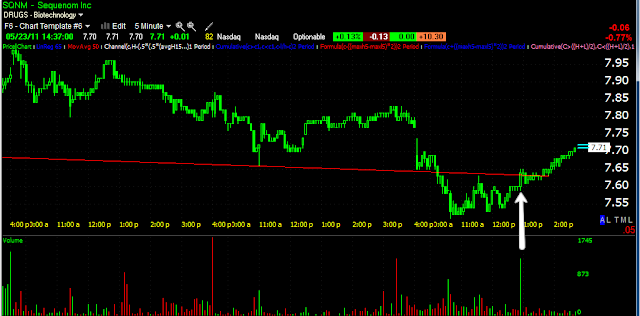
SQNM Follow Up

 This is a bull flag I've mentioned, a bullish continuation pattern.

 Here's this morning's dip below support, and move back above on volume.

 3C 1 min positive divergence

 3C 10 min positive divergence

3C 15 min positive divergence.

I think the risk isn't too large here with a stop below today's lows. Take a look.

Egypt

I said this Egyptian problem just started. In a quick re-cap, Mubarak was from the military, chosen by the military and was already in trouble before the Egyptian protests started as he was grooming his son to succeed him. That didn't sit well with the military, which is who really runs the country and has since Nasser. The protests were a gift to the military, it allowed them to remove Mubarak without staging a coupe. However, when it comes to reform, I said the Egyptian people would be disappointed if they thought they were going to get a democratically elected president without military interference. That problem has begun and will escalate into another round of protests.

Story Here

In the meantime, the US (as if we had our house of cards in order) just backed an Egyptian Bond issuance, more or less if there's a default, it's the American taxpayer that will foot the bill.

Story Here


Obviously we are way behind the information curve, but if the US is backing this government and the timing of the two events are a little ironic, then we can expect a pretty nasty "blow back".

In the meantime, take a look at EGPT
 MoneyStream daily

 3C daily

It looks like this may be an inverse H&S in the making...

Euro/Dollar

I wasn't kidding in the last post. Take a look at the FXE vs UUP

 Euro via FXE 5 min 3C positive divergence

Dollar via UUP 5 min negative divergence.

Contagion Hits The Core

Last night I rattled off a few European outlook downgrades, today the Fitch Rating's Agency went right to the core, meaning not the periphery that have been all the rage over contagion (PIIGS) and downgraded the outlook of Belgium. 

Suddenly the bailers become the next potential Bailees. Of course the more stable economies in the EU are not going to appreciate being the potential target of a downgrade, thereby causing them to pay substantially more on any debt issued and potentially putting their countries in danger, al for trying to be a good neighbor. I sense a lot of animosity building in Europe.

No reaction from the EUR-after all, they have a trade in play. It'll be discounted when they're done.

USO Update

I'm not really trusting this is it for a shakeout....


 The 1 min chart doesn't seem to want to follow price here, which I suspected it wouldn't as the positive divergence this a.m. was fairly small.

 The 5 min chart is not negative, nor is it positive, but it is in confirmation.

The 15 min chart is showing a larger cumulative positive divergence today, but if you look close, there' a slight negative. I'm just not convinced this is it for a shakeout, however, this is trees in the forest type observations.

USO Update

***See Update at the bottom*****


A lot of emails this a.m.  about USO. So Friday my thinking was there was time and space in the price pattern for USO to make 1 more run at the lower range, that's what we saw this a.m. In an update this a.m. I warned to be aware of the possibility/probability of a shakeout to knock out longs if USO is truly going to run higher.

 Remember that it's important to view support and resistace in terms of "areas" and not exact numbers as so many traders do. Once an area of support was established on 5/12, everyone drew the same trendline and the subsequent dips on 5/17 and 5/20 both found support, but in the area, not at the exact price level, this allows them to shake out traders and create a snowball effect, after each breach of "exact support" we saw the snowball effect with fast price runs up to the resistance area of the range. That's why I warned you about this earlier today.

 Sure enough, USO did what it's been doing. Look at the red volume pick up at the break of "exact support". Also on Friday, look at the buy side volume pickup on the slightest break above "exact resistance".

So we have 1 positive divergence on the 1 min chart, enough to move USO back above the trendline, but this is not what I'm looking for, I want to see something much more definitive. For the purposes of the trade, this is still a rather low risk area assuming you don't use that low risk to buy too big of a position.  I don't personally mind picking up a few shares here, but before I would put out a solid call on the buy side, I want to see a more positive looking environment.

So far USO has behaved pretty much as expected which can lead to a false sense of confidence. It's good that the analysis has been pretty accurate and hopefully we remain on the right track, but we need to look at this with fresh eyes every time and not let biases interfere with observation.

***Update-By the way, to launch a real breakout to the upside I would expect a deeper pullback then what we see now.

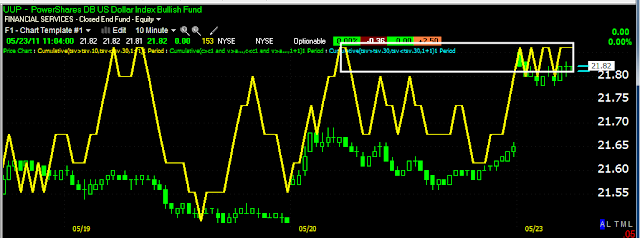
UUP / GLD

 UUP 1 min this morning is inline with price.

 While it may be a little early, I'd expect to see more of a reaction from the 5 min chart, it hasn't confirmed price and doesn't look to be trying very hard.

 The 10 min chart is actually negative (again it may be too early to be looking for a response from the 10 min chart as we only have 10 period of look back (on a 10 min chart) so far and this version of 3C is best suited to 30 periods.

Remember the $1.40 level being the significant level for the Euro, we saw an earlier break, and a recovery, this may be a shakeout, I do expect this level to break, but as we see every day, clean breaks without volatility around these important price levels are few and very far in between.

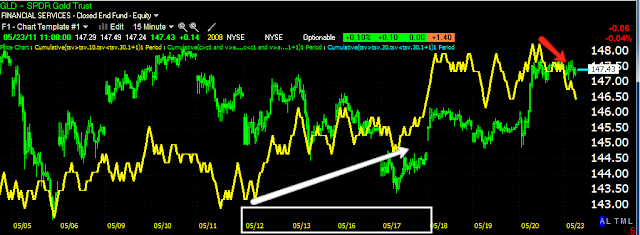
 Here's GLD, 1 min is in lock step with price, not giving us any significant information yet.

 The 5 min chart shows an accumulative period and right now a failure to confirm. Again, this is pretty early to be looking for divergences beyond a 1 min chart, but if there's a strong enough move, it will materialize on these charts this early.

 The 10 min chart seems to indicate some selling here.

On the 15 min chart you can see the accumulation period was actually about 4 days, that should provide more upside for GLD normally. We are just starting to see a small negative divergence on the 15 min chart, this is where divergences really mean something. However, keep in mind that distribution or the start of it doesn't = reversal. They distribute into higher prices, it gives us an idea of what's going on and ultimately will help with the timing, but I'm not sure I would write Gold's move up off yet.

Interestingly, a stronger dollar, at least in the Dollar index (which is 50% weighted against the Euro) seems to be in the card in the near future (beyond what we see today), however, we are also in an inflationary environment, despite what the Fed think of it (transitory) and historically gold has been the natural hedge against inflation. We are seeing a lot of central banks take delivery of physical gold, so we have two opposing themes working here, that of the inverse dollar correlation and that of an inflationary hedge. I would think one is going to have to give, it may be a matter of looking at two different trades happening at the same time and trying to analyze this as a single directional trade.

Market Update

As suspected, there was a retest, and it has given some reading now that seem to indicate some backing and filling of the gap will take place.

 DIA 1 min

 QQQ 1 min

SPY 1 min

VICL Follow Up

VICL was also a May 9th trade idea that went on to gain 22% before pulling back. There was also an earlier trade from March 9th, in which it went on to gain 103%, currently around 73% on the pullback.

VICL was in need of a deeper correction so the blue 22 day moving average seems like a reasonable area to take a look at VICL for a potential next leg up.

VICL still looks good on the long screen, we just want to see some accumulation on the pullback. 1 min charts are starting, but I'd like to see that reach the 15 min charts before deciding to pull the trigger again.

Following Up on BPAX

BPAX, a trade idea from May 9th when the chart looked like this

is now 22% higher and looking like this today

Did you miss the boat? I don't think so. This appears to be a large base multi-year in fact. I would keep a trailing stop on this one, but the volume for the base is perfect. I may wait for a pullback before entering if you haven't already. Remember, patience.

Long term 3C base.