I'm starting to find last Friday's The Week Ahead forecast remarkably "uncanny". Here's an excerpt from the first paragraph posted last Friday, May 15th.
"I feel that we'll definitely be moving toward the 3rd trend forecast from last week, the one that comes AFTER the bounce.
I don't think the bounce is quite complete or its reversal process is not quite complete which means that my first assumption would be that the market would be rangebound and choppy in the area finishing the reversal process, but we also have some very easily recognizable resistance areas that are a hot bed for a head fake move"
This was a tough call because the charts were suggesting that the bounce part of the forecast for last week from the prior Friday's "Week Ahead" forecast looked to be in a reversal process, while at the same time the huge Ascending Triangle price pattern and well established resistance running through March , April and May (up to that point and in the other averages as well) is one of our strongest, most reliable "price-based" concepts... A head fake move, and this triangle in the SPX would be the textbook example I'd use if I were to write a book on our concepts and specifically the head fake move and what elements go in to making an already very high probable occurrence even higher. So as I said, it was very difficult to reconcile the flat, choppy, range bound trade of a reversal process with that of a potential monster breakout above a well established, exceptionally familiar price pattern that every technical trader of equities would be aware of.
So far... The Week Ahead forecast from above has been reconciled!

This is a remarkably picture perfect set-up for a head fake move/false breakout (or failed breakout). Not only does it "look" like a bullish "Ascending Triangle" which is a consolidation/continuation price pattern, it's exceptionally visible (I believe a neophyte Technical Trader who has read "Technical Analysis of Stock Trends" a single time would easily pick out the price pattern) not only in terms of size, but in terms of the perfection of the price pattern.
We almost never see technical price patterns this textbook in the real world. However as a true consolidation price pattern, this is too big, the confirming volume pattern is wrong and generally speaking, triangles this big are almost always tops or bottoms depending on the preceding trend, the preceding trend here would make this a top. However, while not being a strong head fake move, after more than 2.5 months of resistance unbroken, this week we got the move above that I said on Friday in the post linked above,
"I have no doubt any head fake move or false breakout would be exactly that."
That's one of the scenarios down, 1 to go, but they are polar opposite, conflicting ideas... Or are they?

"I don't think the bounce is quite complete or its reversal process is not quite complete which means that my first assumption would be that the market would be rangebound and choppy in the area finishing the reversal process..."
Again, these are the major averages for this entire week, would you say that they look "rangebound/choppy", which is a typical hallmark of a reversal process (until the very end when a last small head fake usually appears) ?
It seems both ideas, as hard as it might be to reconcile them in my imagination on Friday, are in play exactly as forecast which I find amazing!
I had mentioned the trend in the 3 min SPY with this chart and excerpt in the same post...
 " The 3 min charts' trend shows it has been and continues to head that way, I don't think that changes next week."
Looking at an updated chart of the 3 min SPY trend...
 This is the same 3 min SPY trend as the chart above, except it includes this week as well. As anticipated, the trend has not changed this week.
In addition, we looked at the 5 min QQQ chart that would be migrating to the 10 min "Gas in the tank" chart that is the timeframe that I fell is important we see deteriorate before we consider this move as over and having hit the fulcrum to launch the next trend. Again from Friday's The Week Ahead forecast with a QQQ chart and excerpt...
 "The 5 min chart is showing clear, heavy distribution and migration that way, I suspect it will take a couple of days to sufficiently kill the 10 min chart."
An update of the exact same QQQ 5 min chart as of today's close looks like this...
 Perhaps the first thing to take note of is the exact same accumulation dates (and in some cases distribution dates) in multiple assets from the major market averages to bonds, to precious metals, commodities, currencies and individual equities. Secondly, the divergence has not only remained in its negative trend, it has hit a new leading negative low (red horizontal line at the bottom).
Finally at the end of the The Week Ahead forecast from Friday the 15th of May, it concluded with a VIX Short Term Futures (VXX) 10 min chart with the following chart and commentary...
 "The 10 min chart is strong and leading, it just needs the short term reversal process above to conclude.
My word for early next week is PATIENCE."
This is an updated 10 min VXX chart as of today's close...
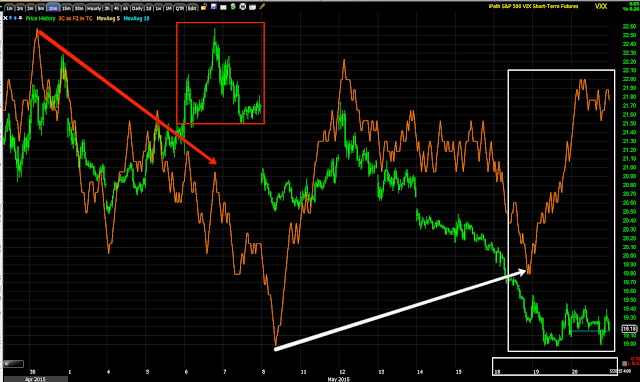 There has been SIGNIFICANT improvement in VXX's 3C accumulation signal this week, thus I'm not too worried about today's new position, Trade Idea: VXX with half the position in VXX long (equity) to capture as much trend as possible e and the second half using options to kick up the return.
$USDX UPDATE
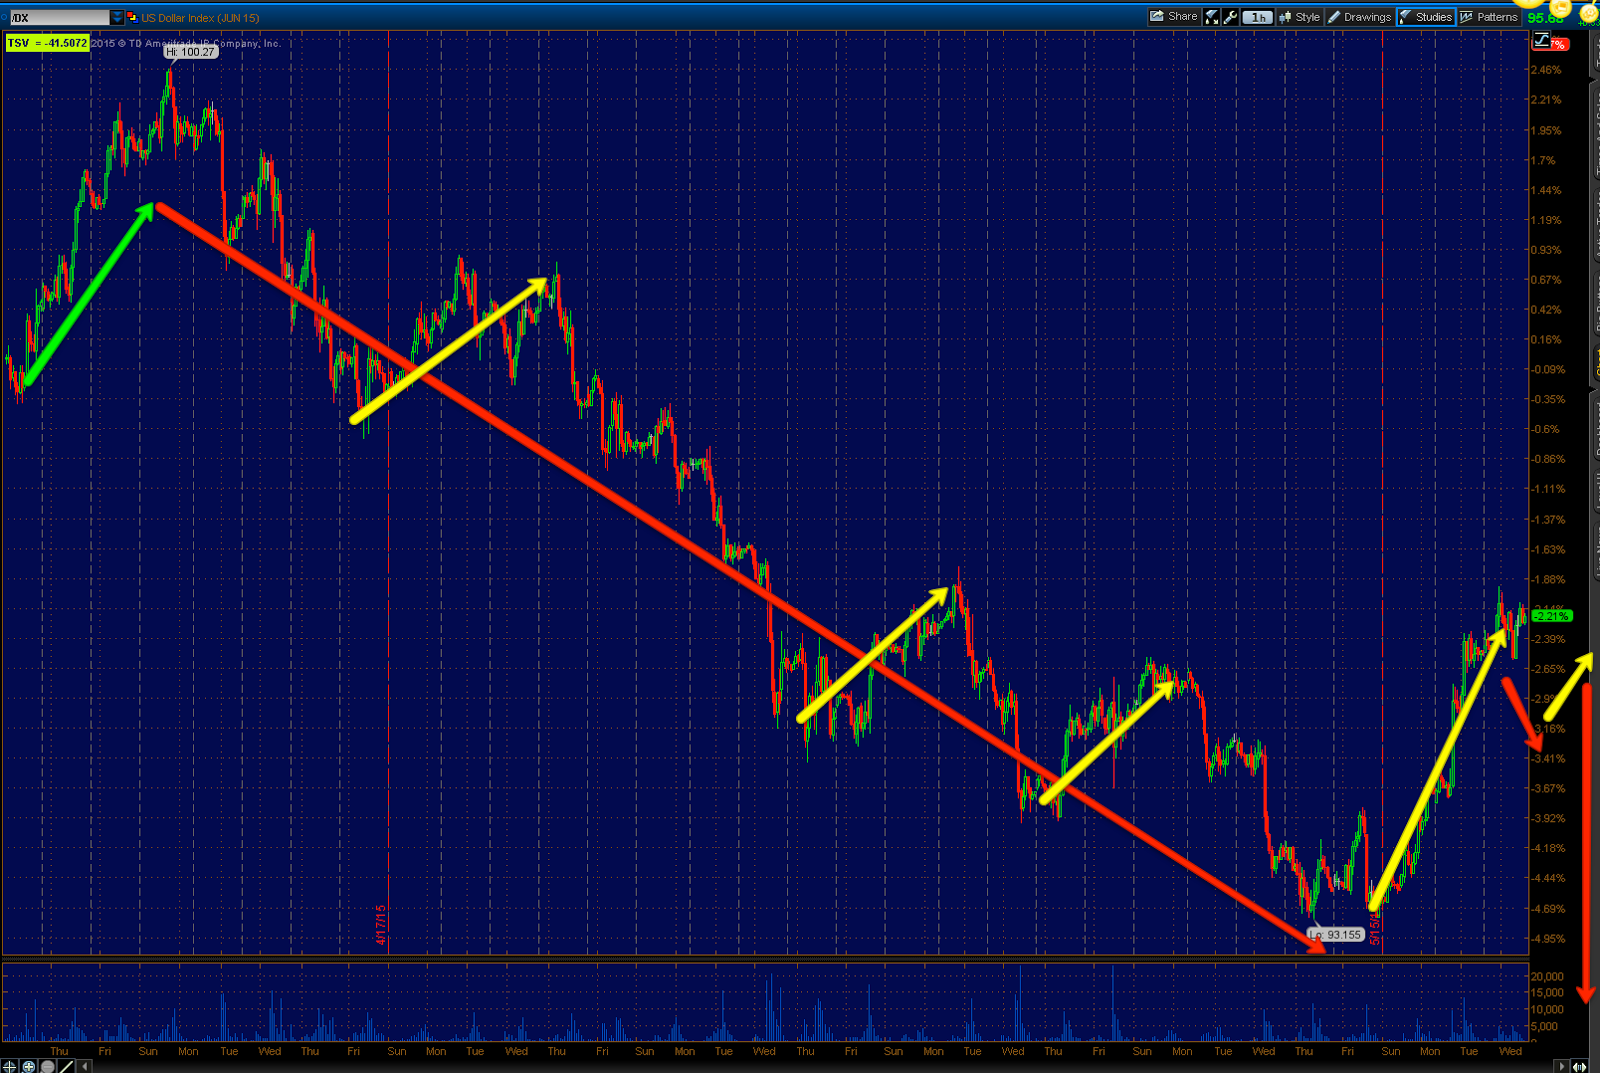
Our $USDX counter trend bounce has started (at minimum) and as expected, it is already the largest of all the $USD counter trend bounces since the forecast of a renewed, larger $USD downtrend after our bounce forecast of April 2nd which said the bounce would be followed by a much larger decline... Since, we have expected a counter trend bounce in the $USD which is key/center to many of our trades, trade set-ups and trade management...
 $USDX 4 hour chart... In white the $USD April 2nd forecast for a bounce and larger decline and our most recent call for a "Counter-trend" bounce in the $USD, except much larger than the previous ones.
As for our Gold Puts and USO short position which I decided to stick with yesterday rather than take gains off the table, GLD Position Management, to capture the longer term swing trends they were meant to capture as it was becoming probable yesterday that we'd see a short term corrective bounce in both gold and oil before resuming a larger trend down (something the $USD plays a large role in as they tend to trade opposite the $USD)...
We really didn't get the kind of moves today I had hoped to see in both oil and gold to the upside on a near term corrective (down) move in the $USD before it goes on to finish its current counter trend bounce and finally back to the prevailing downtrend.
Despite the lack of movement today in the $USD, it was due for a breather after the last 2-days put in the strongest 2-day $USD move SINCE OCTOBER OF 2011!
I THINK IT'S UNDERSTANDABLE IF THE $USD TAKES A BREATHER. In addition, the corrective move expected in the $USD would likely not be a "V" reversal and as such some rounding over or reversal process would be completely normal. the same would apply for USO/Oil and GLD/Gold.
Here are the updated charts for the currencies I think matter the most right now.
 The $USDX 3 min chart which is more of a timing divergence timeframe. Note today's price action (other than seeing some volatility around the release of the minutes) is largely in a lateral/rounding reversal process rather than a "V" shaped event and 3C is leading negative here suggesting that we are right on the edge of the anticipated $USDX short term corrective move.
I know this is probably a bit confusing so I'll try to lay out all of the trends we are tracking and when/where they are expected. So far the $USD has been in a major downtrend since April 31st, this was forecasted in our April 2nd $USD forecast with a bounce first which started just 3 days after our forecast (those 3 days formed the reversal process/base for the bounce). We have had several small counter trend bounces in the $USD since the April 31st start of the current downtrend and we have been recently looking for a stronger counter trend bounce than any f the preceding CT bounces (see the 60 min/4 hour $USD chart above with counter trend bounces at the yellow arrows).
Since the last 2 days (Mon/Tues) in the $USD have been the strongest 2-day move since October 2011, I'd say our call for a stronger counter trend bounce than the previous ones, was right on track.
We are now expecting a brief corrective move down within the current counter trend bounce, if we get this move, this should set-up entries for our second chance USO/Gold trades. Once the counter trend bounce resumes, the Oil/Gold positions should be making nice gains on a pullback/decline.
At some point I fully expect the counter trend $USD bounce WILL END and it will go on to make a new lower low within the larger downtrend since April 31st (see the 60m/4h chart above). This should coincide with our long term $USO trend reversal to the upside and possibly a gold trend to the upside so this not only gives us one trade nearby, but a second much larger trending trade.
 This is the Euro 3 min 3C chart with a positive divergence. You know what happens when the EUR/USD moves up... the $USD moves down in line with the expected corrective move within the current counter trend bounce so this 3 min 3C Euro Futures divergence tends to confirm our expectations of a near term $USDX corrective move to the downside which can be seen above on the 3 min $USD chart.
A larger, stronger divergence (as the 3 min is more of a timing chart) is on the 7 min charts of the Euro and $USD below...
 This is the $USDX 7 min timeframe. To the left you can see the very large positive divergence/ "W" base in the $USDX leading to the recent counter trend bounce of the last 2-days. At #2 we not only have a rounding reversal process, but a negative divergence suggesting the very corrective downside move in the $USDX I am expecting before it returns to its counter trend bounce and finally back to its longer term decline.
 The 7 min Euro 3c chart has a confirming positive divergence currently, this would mean we''d expect to see a bounce in the EUR/USD and specifically a correction o the downside in the $USD which is central to our Gold/Oil second chance trade entries.
As I said above, there are so many moving pieces here with unknown reactions to the F_E_D, although it seems for now that someone knew something in advance as the charts' divergences and price moves are not being effected by the F_E_D minutes.
 This is a 1 min chart of EUR/USD. Note how the downtrend (as the $USD has been rallying the previous 2 days) has abated and a lateral reversal process is in place ready for a EUR/USD bounce.
 Finally the longer term/stronger $USDX 15 min chart with a large "W" base and leading positive divergence. This clearly suggests that any near term corrective move to the downside will end with a return to the counter trend bounce on the upside which is what will make the USO/Gold trades work.
I do have a theory about the reason for this most recent move which came just below support of the $USD's primary trend's intraday lows or support. This is where numerous $USD shorts would have entered so a counter trend bounce here will be strong as we have seen as it squeezes the new $USD shorts. This in return allows the some-odd $9 trillion in $USD carry trade to be closed out at better prices (remember the average carry trade position is running with 100-300x leverage so moves can be extreme).
The process of closing the carry trade is to first sell the assets that were financed with carry proceeds, usually this is boss and that's one of the reasons bonds decline during a carry trade unwind, but because of the chase for yield, a lot of carry proceeds went in to equities as well. So these assets will have to be sold or unwound and then the original borrowed currency has to be returned, in most cases that's the Yen, this is the reason I have said that when the market is ready to break down, expect the Yen to rally as a flood of money will be bidding it up to close the carry trade. Remember in the USD/JPY carry, the Yen is borrowed at a ,ow interest rate and then converted in to $USDs and from there high yielding/high quality bonds are typically bought, this is why Treasuries outperformed Equities in 2014, but a lot of money went in to equities as well. Essentially it's a short JPY/long $USD trade just like the USD/JPY which is why the market was so closely correlated to that pair last year and why it has lost most of that correlation as this year progresses.
In any case I suspect this CT bounce will be one of the last good opportunities to close the carry trade without snow-balling the currencies as everyone tries to close the trade at the same time so I absolutely would not be surprised to see equities and/or bonds sold off. However as you know I am looking for a second entry to fill out a long TLT position from May 7th, Trade Idea: Long Bonds / TLT and Bond Rally / Swing.
This would give them a chance to unwind the assets purchased with carry profits at better prices as bonds have essentially turned to a downtrend (at least on the long end of the curve-TLT/30 year Treasuries). If you see the second link explaining the idea behind the trade, it too is a counter trend rally, not a trend reversal so it is expected to fail and move to new lows as well which would be the second trade for us after the first one completes.
I'll update both the USO and Treasuries tomorrow. Right now 30 year Treasury futures are showing short term positive divergence that could be taken as timing cues...
USO ended the day with some shorter term negative divergence which I'm hoping are only short term and it will bounce so we can get a second chance entry, but this is the reason I left the trade on and stuck with the primary 3C trend, it has the strongest probabilities. If we do get the opening in USO and Gold, then no harm done, you get a second chance opening at the trade ideas. If we don't get the bounce needed, again for those who stayed in the trade, you'll be back at a nice profit soon and for those who missed it, no $$$ losses, just opportunity opportunity. For now though I'm assuming the original plan from yesterday is still intact.
THE F_O_M_C MINUTES...
Interestingly today was nearly absolute flatness across multiple asset classes except for stocks for a brief time after the April F_O_M_C minutes were released and the HFT alleges were caught (illegally) "Spoofing". For more on the subject, see this afternoon's post, It took a bit, but now we are seeing $USD movement.
While the $USD saw some initial volatility up and down, it tended to move to the downside and then popped in to the close. To most market participants this would be interpreted as a rate hike is a bit further off. If we get the move we are expecting in the $USD (small downside corrective move) that will serve as additional confirmation that the market is taking the minutes in stride, however all of these moves were in place in advance (we saw the divergences well before the minutes were released). This could have been on a leak of the minutes, it wouldn't be the first time, but the carry trade unwind makes much more sense to me, especially as there was no real knee jerk move and many assets except the ones being spoofed, were flat.
The bottom line is the minutes made it sound like a June hike was unlikely, but they explicitly did NOT rule it out and left plenty of ambiguity to defend a rate hike. In fact when the subject of giving 1 meeting's notice before a rate hike, it was shot down and the subjective, "Let them follow our economic assessment" was essentially what was decided. This is where it gets interesting.
As many or most of you know, I believe the F_E_D has to raise rates for some reason that we are not entirely aware of. They know to raise rates now would hurt the economy, housing, Cap-ex spending which is non-existient anyway at ZIRP policy. The F_E_D is more afraid of not having elbow room and being boxed in than they are of the damage rate hikes will cause as the Macro Economic Data Surprise Index has seen the worst start to a year and sits at 6 year lows! It's pretty hard to make an argument for hiking rates in this economic environment so lets look at some of the minutes...
Shot down! They need to keep this as ambiguous as possible to pull it off because you can't make a rational argument for rate hikes without revealing what they are really afraid of and that would likely panic the market a whole lot more than rate hikes.
Again, making more excuses for the first quarter, but why if the incoming data is what matters?
The reason why came out before the close from Steve at CNBC...
It seems both ideas, as hard as it might be to reconcile them in my imagination on Friday, are in play exactly as forecast which I find amazing!
I had mentioned the trend in the 3 min SPY with this chart and excerpt in the same post...

Looking at an updated chart of the 3 min SPY trend...

In addition, we looked at the 5 min QQQ chart that would be migrating to the 10 min "Gas in the tank" chart that is the timeframe that I fell is important we see deteriorate before we consider this move as over and having hit the fulcrum to launch the next trend. Again from Friday's The Week Ahead forecast with a QQQ chart and excerpt...

An update of the exact same QQQ 5 min chart as of today's close looks like this...

Finally at the end of the The Week Ahead forecast from Friday the 15th of May, it concluded with a VIX Short Term Futures (VXX) 10 min chart with the following chart and commentary...

My word for early next week is PATIENCE."
This is an updated 10 min VXX chart as of today's close...

$USDX UPDATE
Our $USDX counter trend bounce has started (at minimum) and as expected, it is already the largest of all the $USD counter trend bounces since the forecast of a renewed, larger $USD downtrend after our bounce forecast of April 2nd which said the bounce would be followed by a much larger decline... Since, we have expected a counter trend bounce in the $USD which is key/center to many of our trades, trade set-ups and trade management...

As for our Gold Puts and USO short position which I decided to stick with yesterday rather than take gains off the table, GLD Position Management, to capture the longer term swing trends they were meant to capture as it was becoming probable yesterday that we'd see a short term corrective bounce in both gold and oil before resuming a larger trend down (something the $USD plays a large role in as they tend to trade opposite the $USD)...
We really didn't get the kind of moves today I had hoped to see in both oil and gold to the upside on a near term corrective (down) move in the $USD before it goes on to finish its current counter trend bounce and finally back to the prevailing downtrend.
Despite the lack of movement today in the $USD, it was due for a breather after the last 2-days put in the strongest 2-day $USD move SINCE OCTOBER OF 2011!
I THINK IT'S UNDERSTANDABLE IF THE $USD TAKES A BREATHER. In addition, the corrective move expected in the $USD would likely not be a "V" reversal and as such some rounding over or reversal process would be completely normal. the same would apply for USO/Oil and GLD/Gold.
Here are the updated charts for the currencies I think matter the most right now.

I know this is probably a bit confusing so I'll try to lay out all of the trends we are tracking and when/where they are expected. So far the $USD has been in a major downtrend since April 31st, this was forecasted in our April 2nd $USD forecast with a bounce first which started just 3 days after our forecast (those 3 days formed the reversal process/base for the bounce). We have had several small counter trend bounces in the $USD since the April 31st start of the current downtrend and we have been recently looking for a stronger counter trend bounce than any f the preceding CT bounces (see the 60 min/4 hour $USD chart above with counter trend bounces at the yellow arrows).
Since the last 2 days (Mon/Tues) in the $USD have been the strongest 2-day move since October 2011, I'd say our call for a stronger counter trend bounce than the previous ones, was right on track.
We are now expecting a brief corrective move down within the current counter trend bounce, if we get this move, this should set-up entries for our second chance USO/Gold trades. Once the counter trend bounce resumes, the Oil/Gold positions should be making nice gains on a pullback/decline.
At some point I fully expect the counter trend $USD bounce WILL END and it will go on to make a new lower low within the larger downtrend since April 31st (see the 60m/4h chart above). This should coincide with our long term $USO trend reversal to the upside and possibly a gold trend to the upside so this not only gives us one trade nearby, but a second much larger trending trade.

A larger, stronger divergence (as the 3 min is more of a timing chart) is on the 7 min charts of the Euro and $USD below...


As I said above, there are so many moving pieces here with unknown reactions to the F_E_D, although it seems for now that someone knew something in advance as the charts' divergences and price moves are not being effected by the F_E_D minutes.


I do have a theory about the reason for this most recent move which came just below support of the $USD's primary trend's intraday lows or support. This is where numerous $USD shorts would have entered so a counter trend bounce here will be strong as we have seen as it squeezes the new $USD shorts. This in return allows the some-odd $9 trillion in $USD carry trade to be closed out at better prices (remember the average carry trade position is running with 100-300x leverage so moves can be extreme).
The process of closing the carry trade is to first sell the assets that were financed with carry proceeds, usually this is boss and that's one of the reasons bonds decline during a carry trade unwind, but because of the chase for yield, a lot of carry proceeds went in to equities as well. So these assets will have to be sold or unwound and then the original borrowed currency has to be returned, in most cases that's the Yen, this is the reason I have said that when the market is ready to break down, expect the Yen to rally as a flood of money will be bidding it up to close the carry trade. Remember in the USD/JPY carry, the Yen is borrowed at a ,ow interest rate and then converted in to $USDs and from there high yielding/high quality bonds are typically bought, this is why Treasuries outperformed Equities in 2014, but a lot of money went in to equities as well. Essentially it's a short JPY/long $USD trade just like the USD/JPY which is why the market was so closely correlated to that pair last year and why it has lost most of that correlation as this year progresses.
In any case I suspect this CT bounce will be one of the last good opportunities to close the carry trade without snow-balling the currencies as everyone tries to close the trade at the same time so I absolutely would not be surprised to see equities and/or bonds sold off. However as you know I am looking for a second entry to fill out a long TLT position from May 7th, Trade Idea: Long Bonds / TLT and Bond Rally / Swing.
This would give them a chance to unwind the assets purchased with carry profits at better prices as bonds have essentially turned to a downtrend (at least on the long end of the curve-TLT/30 year Treasuries). If you see the second link explaining the idea behind the trade, it too is a counter trend rally, not a trend reversal so it is expected to fail and move to new lows as well which would be the second trade for us after the first one completes.
I'll update both the USO and Treasuries tomorrow. Right now 30 year Treasury futures are showing short term positive divergence that could be taken as timing cues...
USO ended the day with some shorter term negative divergence which I'm hoping are only short term and it will bounce so we can get a second chance entry, but this is the reason I left the trade on and stuck with the primary 3C trend, it has the strongest probabilities. If we do get the opening in USO and Gold, then no harm done, you get a second chance opening at the trade ideas. If we don't get the bounce needed, again for those who stayed in the trade, you'll be back at a nice profit soon and for those who missed it, no $$$ losses, just opportunity opportunity. For now though I'm assuming the original plan from yesterday is still intact.
THE F_O_M_C MINUTES...
Interestingly today was nearly absolute flatness across multiple asset classes except for stocks for a brief time after the April F_O_M_C minutes were released and the HFT alleges were caught (illegally) "Spoofing". For more on the subject, see this afternoon's post, It took a bit, but now we are seeing $USD movement.
While the $USD saw some initial volatility up and down, it tended to move to the downside and then popped in to the close. To most market participants this would be interpreted as a rate hike is a bit further off. If we get the move we are expecting in the $USD (small downside corrective move) that will serve as additional confirmation that the market is taking the minutes in stride, however all of these moves were in place in advance (we saw the divergences well before the minutes were released). This could have been on a leak of the minutes, it wouldn't be the first time, but the carry trade unwind makes much more sense to me, especially as there was no real knee jerk move and many assets except the ones being spoofed, were flat.
The bottom line is the minutes made it sound like a June hike was unlikely, but they explicitly did NOT rule it out and left plenty of ambiguity to defend a rate hike. In fact when the subject of giving 1 meeting's notice before a rate hike, it was shot down and the subjective, "Let them follow our economic assessment" was essentially what was decided. This is where it gets interesting.
As many or most of you know, I believe the F_E_D has to raise rates for some reason that we are not entirely aware of. They know to raise rates now would hurt the economy, housing, Cap-ex spending which is non-existient anyway at ZIRP policy. The F_E_D is more afraid of not having elbow room and being boxed in than they are of the damage rate hikes will cause as the Macro Economic Data Surprise Index has seen the worst start to a year and sits at 6 year lows! It's pretty hard to make an argument for hiking rates in this economic environment so lets look at some of the minutes...
"A few anticipated that the information that would accrue by the time of the June meeting would likely indicate sufficient improvement in the economic outlook to lead the Committee to judge that its conditions for beginning policy firming had been met. Many participants, however, thought it unlikely that the data available in June would provide sufficient confirmation that the conditions for raising the target range for the federal funds rate had been satisfied, although they generally did not rule out this possibility. "
Remember it's all about the economic data IMPROVING..
Remember it's all about the economic data IMPROVING..
"Participants discussed the merits of providing an explicit indication, in postmeeting statements released prior to the commencement of policy firming, that the target range for the federal funds rate would likely be raised in the near term. However, most participants felt that the timing of the first increase in the target range for the federal funds rate would appropriately be determined on a meeting-by-meeting basis and would depend on the evolution of economic conditions and the outlook. In keeping with this data-dependent approach, some participants further suggested that the postmeeting statement’s description of the economic situation and outlook, and of progress toward the Committee’s goals, provided the appropriate means by which the Committee could help the public assess the likely timing of the initial increase in the target range for the federal funds rate"
Shot down! They need to keep this as ambiguous as possible to pull it off because you can't make a rational argument for rate hikes without revealing what they are really afraid of and that would likely panic the market a whole lot more than rate hikes.
“The severe winter weather in some regions had reportedly weighed on economic activity, and the labor dispute at West Coast ports temporarily disrupted some supply chains,”
They are still making excuses for Q1 poor performance, but why?
They are still making excuses for Q1 poor performance, but why?
"a pattern observed in previous years of the current expansion was that the first quarter of the year tended to have weaker seasonally adjusted readings on economic growth than did the subsequent quarters. This tendency supported the expectation that economic growth would return to a moderate pace over the rest of this year.”
Again, making more excuses for the first quarter, but why if the incoming data is what matters?
The reason why came out before the close from Steve at CNBC...
Govt sees GDP data problems, backs CNBC findings
"The government agency charged with calculating the nation's growth rate is acknowledging problems with its numbers and pledging a series of fixes over the next several months.
In a statement to CNBC, the Bureau of Economic Analysis said it's "aware of issues" in it gross domestic product data and "is developing methods to address what it has found."
The BEA statement comes after CNBC, in a detailed report in April, showed that first quarter GDP data has been weaker than the other three-quarters for the past 30 years and substantially weaker in the past five.
Several economists, including researchers at the San Francisco and Philadelphia Federal Reserve banks and many Wall Street economists, have since confirmed CNBC's findings. Many attribute the problem to what is known as "residual seasonality" which are seasonal patterns that remain in the data even though it is already adjusted for seasonal variations.
Nicole Mayerhauser, chief of BEA's national income and wealth division, which oversees the GDP report, said in the statement that the agency has identified several sources of trouble in the data, including federal defense service spending. Mayerhauser said initial research has shown this category of spending to be generally lower in the first and the fourth quarters. The BEA will also be adjusting "certain inventory investment series" that have not previously been seasonally adjusted. In addition, the BEA will provide a more intensive seasonal adjustment quarterly service spending data."
In short, the first quarter's seasonal adjustments are about to be "READJUSTED", they are going to make Q1 look better than it is, which makes hiking at June easier. This is why the F_E_D continues to defend and make excuses for Q1, they are going to re-revise it to a "goal-seeker" number that allows them to hike as they have already introduced the language of ambiguity that doesn't need inflation or economic data to be strong, they just need to "FEELL" it will improve!
Internals were worthless today with everything so flat.
As for futures, ES made a decline after the close which was ugly, but I don't think it was the beginning of the end...
 ES 1 min moved to lows of the day just after the close, but note the minor 1 min 3C positive divergence, I suspect it holds. However with the look of VXX, I doubt it holds long.
We have numerous trade set ups that should be available tomorrow so it's likely I'll be very busy watching them and looking for entries: Gold, Treasuries, Oil, hopefully Transports bounce as they closed at 6 month lows that would send Charles Dow rolling in his grave (Dow Theory and confirmation of Industrials and Transports) as well as numerous individual ideas including sectors like Financials and specific socks like NFLX.
Have a great night and don't trust these crooks, read between the lines. Everything you need to know about the F_E_D and rate hikes they've already made public, people just tend to dismiss what they don't want to hear.
In short, the first quarter's seasonal adjustments are about to be "READJUSTED", they are going to make Q1 look better than it is, which makes hiking at June easier. This is why the F_E_D continues to defend and make excuses for Q1, they are going to re-revise it to a "goal-seeker" number that allows them to hike as they have already introduced the language of ambiguity that doesn't need inflation or economic data to be strong, they just need to "FEELL" it will improve!
Internals were worthless today with everything so flat.
As for futures, ES made a decline after the close which was ugly, but I don't think it was the beginning of the end...

We have numerous trade set ups that should be available tomorrow so it's likely I'll be very busy watching them and looking for entries: Gold, Treasuries, Oil, hopefully Transports bounce as they closed at 6 month lows that would send Charles Dow rolling in his grave (Dow Theory and confirmation of Industrials and Transports) as well as numerous individual ideas including sectors like Financials and specific socks like NFLX.
Have a great night and don't trust these crooks, read between the lines. Everything you need to know about the F_E_D and rate hikes they've already made public, people just tend to dismiss what they don't want to hear.