DIA 1 min leading positive
DIA 2 min Tuesday marked for reference, positive divergence
DIA 5 min, red arrow is Tuesday,positive
DIA 10 minTuesday at the red arrow, leading positive.
IWM 10 min leading positive
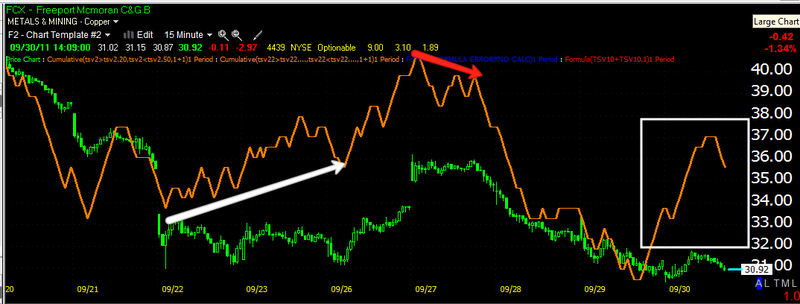
IWM 15 min -the red arrow is the end of the last rally cycle, then the white arrows are this round of accumulation, the green arrow is confirmation of the uptrend leading to Tuesday of this week and the far right white arrow is the current positive divergence, which is leading. I included so much history here so you can see the accumulation at the first period versus now on a 15 min chart which is significant. Many rallies we have had gained 8% of so without ever going positive on the 15 min timeframe.
IWM 5 min (sorry it's out of order, I need more coffee). This also shows the same history as above so I could show you the amount and strength of accumulation right now versus the last accumulation period which I consider to be all part of the same cycle.
QQQ 1 min positive divergence
QQQ 2 mn positive divergence
QQQ 5 min positive and some leading positive
QQQ 15 min, again with the same history as the IWM 15 min chart above, again to show the strength of the 15 min divergence.
SPY 1 min leading positive, the red arrow is mis-marked as a relative negative divergence when in fact it is in line with the price trend.
SPY 2 min positive divergence
SPY 5 min leading positive divergence.
SPY 10 min leading positive divergence
SPY 15 min with history including the last cycle up trend's top
Remember that accumulation occurs in to lower prices and flat trading ranges, usually in that order.
QQQ
SPY
DIA
IWM


 | Theme by Thur


