Friday, March 9, 2012

Preliminary Wrap

So close, but still so far away.... AAPL! A new closing high would have to break $545.18, AAPL closed at $545.15 a mere FOUR CENTS AWAY from a new high. However, I don't want to get caught in the same dogma I so often preach against (ex: "Support for the SPX is $1340.03"), it is the emotional reaction that matters. AAPL longs (and I've upset quite a few over the years) tend to be AAPL lovers not AAPL traders. I love AAPL products, I'm on my MacBook Pro right now with my I-phone sitting next to me, and I will trade AAPL long or short, but as far as falling in love, I save that for my wife, for surfing, for fishing, for my Vizsla and lately for Skittles.

I have said it more then once in a tongue in cheek manner, but seriously, after seeing that CNBC article last night about the department of labor turning to experts in keeping nuclear secrets so they can stop the leaks in the NFP data (as Wall Street has the numbers before anyone else-something we see in earnings and in particular, the EIA Energy report)-ok, I got off track... I have said several times, the Wall Street slogan/mantra, "Buy the dip" probably originated in the offices of Goldman Sachs-the propaganda unit that promptly put s it out on the web and on CNBC.

Point being, AAPL longs are probably the biggest "Buy the Dippers" out there. I'm not bashing AAPL, I'm not saying it doesn't have more growth, I'm saying AAPL virtually is the market and a break there, even if it doesn't hold for months, is probably more then enough to break the market. So back to emotions, after Monday's 2.2% drop what do you think AAPL longs did? And from what 3C looks like, it seems that the hedge fund favorite may have seen a little more selling then usual. What I am trying to say and could have probably said in a sentence, is that it is the emotional reaction that is the set up. If the longs are there and AAPL breaks, the snowball effect in AAPL and in the market could be tremendous.

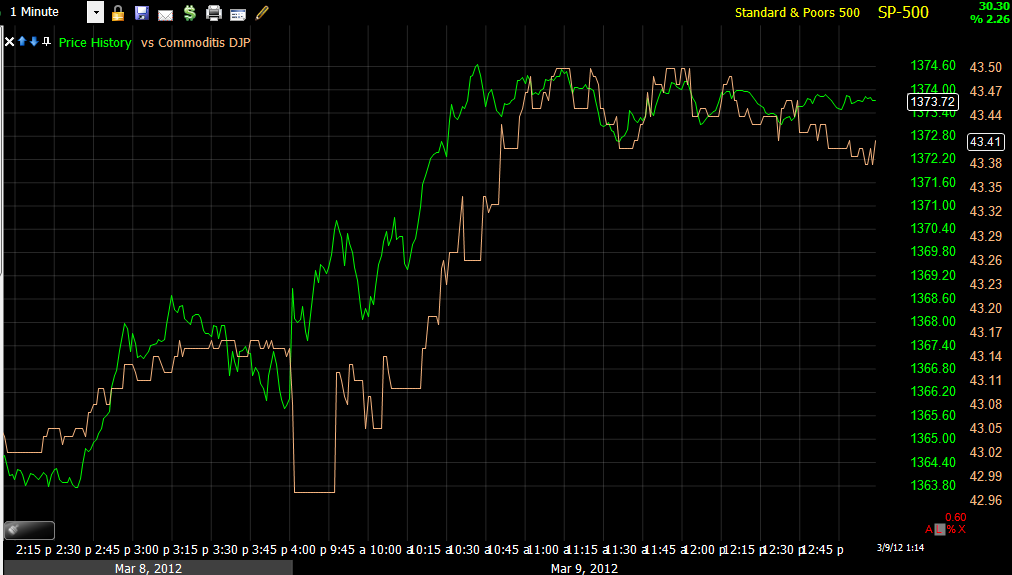
As for the late day VXX position in the Options Model Portfolio, VIX moved a lot closer to Capital Context's model.
I'm not sure how they construct this particular model, but their model suggests the VIX should be moving higher. After seeing the amount of information a hedge fund acquires about the market using options and models based on them, I can say there's a lot more out there then I ever imagined giving these guys an edge and I'm not sure if I'm allowed to say this, but their volatility models which are nothing like a simple volatility indicator (these are 3 dimensional models that take every bit of options information in the market available and make constructs) have turned bearish. Apparently the options system they are using (and I'll get the name for you) is used by the NYSE, the CBOE and the SEC, it's that accurate and the data is that clean.

I try to watch as much as I can, you never know where the next hint is hiding, one thing I've noticed recently and today specifically is the FX carry trade seems to be moving to a risk off mode, or they're unwinding the carry trade, specifically in the AUD/USD, this is one way to tell what the big boys are doing, whether they are using the carry trade to fincnace risk assets or moving out of it.

 Here's FXA (AUD) vs the SPX, notice the recent divergence and AUD closing down specifically today.

 This chart shows the AUD channel, the break of that channel with an upside false breakout leading to a move below the range. As the trade has advanced, the ATR has narrowed significantly and the Close Within the Range has gone from closing in the upper 50% of the daily range to the lower 50% of the daily range.

 The weekly average of the price percentage gain has also gone from positive to negative.

And my Trend Channel was recently broken as it now starts to head downward. This all shows that the carry trade is being unwound and funds aren't putting money in the market, but rather taking it out.

As for intraday trade...
 Talk about smart money, here you can see the sell-off in credit right before the market dropped.

 The same can be seen in Corp. Credit.

 Energy was also leading the way down today.

As for late day sector rotation, it became more defensive. Only Financials held up and Tech started to make a small comeback at the end of the day, otherwise, it was defensive trade in Utilities, Healthcare and Staples.

On the news front, it has been decided, Greece defaulted on their bonds and CDS is going to have to be paid. This isn't good news for the EU financial sector, no wonder they've been hoarding cash at the ECB. Already 1 Austrian bank looks to have a $1 bn Euro short fall to cover CDS that were triggered today. It will be interesting next week to see how many more of the hundreds of bans that wrote CDS don't have the financial backing to pay up on the insurance they wrote.


Germany is also at it again (meaning trying to take over Europe for the 3rd time, but this time with debt instead of bullets) , as Reuters reports:

(Reuters) - Germany wants to reignite a debate over creating an EU constitution to strengthen the bloc's ability to fight off financial troubles and counter-balance the rising influence of emerging economies, Germany's foreign minister said on Friday.


an example of what they want...


"Germany argued that change was needed to enshrine tougher fiscal discipline and safeguard the bloc from further financial troubles.
For example, it wanted an amendment to incorporate tighter regional oversight of government spending and allow the European Court of Justice to strike down a member's laws if they violated fiscal discipline.
But Britain vetoed the plan in December in a row over safeguards for its financial sector."
I'll be posting more over the weekend and looking at some new tools that I have discussed with some members, I'll make the announcement after back testing the system, but lets just say any options traders should love it.

Otherwise, have a great weekend

PCLN Idea

I hope I don't regret this, but I've never had more emails about shorting a stock then PCLN, everyone wants this one.

The only reason I bring this up is because the risk here doesn't look bad as PCLN formed a tweezer top today which is also a reversal pattern. I'm looking for a move potentially in to the gap.

 The stop would be above today' highs.

 60 min

 30 min

 15 min

2 min

If you take this trade idea, it is essential to honor your stop, I would be a little above the highs and take fewer shares.

Can AAPL Still Pull It Off?

If you've been in the market a month, then you know just about anything is possible, taking a look at the charts...

 Looking at the 1 min chart, where the positive divergence that most likely would have sent AAPL on a breakout today had the ISDA news not broke around the same time, what I see is 3C sitting at a higher low with price at a lower low from. This is still a positive divergence. Compare to the SPY below...

The SPY has no such luck, the SPY's only luck would be to piggy back off AAPL.

As I have mentioned many, many times, we see head fake moves nearly 80% of the time before a reversal. Still, this AAPL chart is VERY ugly, bouncing on diminishing volume in to resistance, a failure in AAPL here would be very old school TA, but nonetheless, it would still be a failure and no matter how it happens, head fake or old school failure at resistance, the point is that AAPL breaks, that's the key no matter how we get there.

CORRECTION VXX APRIL CALLS NOT PUTS

VXX / VIX Volatility Index

 VXX 1 min is even stronger on today's move lower

 VXX 1 min zoomed in, I like the new leading high on a lower day...

 I also like the 2 min chart which is long term positive, being right on the money with positive divergence well before VXX moved up at all. If VXX falls a bit on any market strength from here, I'd likely add to the position.

 I also like the 5 min chart nailing the move earlier today and making a new leading 3C local high.

 The 30 min chart shows what I view as the second half of a "W" type base with stronger 3C readings.

 The 60 min chart from decline to a "W" bottom with positive divergences at both bottoms, but stronger at the second bottom which made an intraday new low (head fake move I look for in reversals).

The 2 day VIX chart is hitting a new leading high the last 4 days.

Model Portfolio Options Trade

I'm going to buy the April $24 Puts in VXX, I  see good divergences there, I'm not too worried if I have to wait a day or a few days, I like what I see.

As soon as the screen capture initializes I'll post charts.

Here's Why

ISDA CDS Trigger Decision Is Unanimous


It looks like Credit Default Swaps Just got triggered, this is the insurance against a default in the bonds, meaning a boatload of mostly EU banks are now going to have to pay up on the insurance they wrote.

ES Taking a hit

I have to reload my screen capture that is going haywire, but ES is taking a big hit on a 3C negative divergence...

GOOG May Make For a Decent Trade

GOOG daily MoneyStream Negative and leading negative divergence. GOOG has mostly traded in line, but the first relative divergence sent GOOG gapping down, now we have a leading negative divergence.


 GOOG Daily in a small bear flag...

 GOOG 60 min, the ideal trade would be for GOOG to re-enter the bear flag it just fell out of today, either inside or above would be even better, setting up a low risk/high probability short. I would set price alerts for such a move if you are interested in the trade.

 GOOG 60 min positive divergence sending GOOG higher with good confirmation (green arrow), since a negative divergence sending GOOG gapping down and in this consolidation a leading negative divergence.

 The 30 min chart shows the same, a negative divergence sending GOOG gapping down and a leading negative in the consolidation. Thus far it looks like GOOG's break of the bear flag is real and should be moving to a new leg down.


 The 15 min chart. Confirmation of the uptrend to the left, a negative divergence on a head fake move above resistance which sent GOOG down in to a bear flag before it gapped lower. The the last white arrow is a positive divergence forming a bigger bear flag which has since gone negative and leading negative.

 The 5 min chart just confirming the 15 min above.

Here's where the potential set up is, the 2 min chart has a relative positive divergence after GOOG broke from the bear flag. This could be enough to send GOOG back in to the bear flag, where it would likely set up a high probability/low risk short entry.

Let the trade come to you.

AAPL Update... This looks like it...

Thi is one of those moments, I'm working as fast as I can to get it out to you...


 The closing high for an APPL head fake move would have to be above the previous close of $545.18 to draw suckers in, we are in that area.

 The last time I saw an AAPL head fake move coming this is exactly what we saw, Bollinger bands pinch in to 3C weakness- (although as you may remember I was looking for a bigger one, but didn't see how it would be possible as the Bollinger Bands were so tight and then the next morning we got the head fake move-small, it brought AAPL down 2.2% on the day, it's the bigger move I've been looking for this week at least on a closing basis)

 This was Monday's head fake move in AAPL I wrote about last Friday after the close and Sunday night, note the Bollinger bands, just like now, pinching.

 3C was weak during that last move on Monday in the yellow triangle, right now it is even weaker, however...

 The same chart as above zoomed in tight on an intraday basis, is showing the intraday divergence it would need to send AAPL higher, especially with the Bollinger bands pinched.

 Here's the 2 min chart with weakness going in to Mondays smaller head fake move, this timeframe remains leading negative.

 Zoomed closed you can see a negative divergence thought out today.


 The 5 min chart is leading negative and weaker then Monday

A closer view shows the wekness today.

This is essentially nearly the perfect set up for what I'm looking for, a price move in to 3C weakness, the same as Monday just on a bigger scale. The 1 min chart positive divergence is an intraday chart, it's just a primer to get the move under way, it's not indicative of strength.

Lets see what happens.

Sectors, FX, Context Models, etc.

Starting with the Capital Context ES and VIX models...
 Make sure to look at the time stamp, this is about 20 mins. delayed and ES trades 24 hours. The ES Model is weaker then actual ES, which is what I would expect, so no surprises there.

This VIX model is from the start of today's trade, the VIX is much lower then the implied level of their model, again not surprising considering the market is trying to move up with the EUR/USD in collapse, like I said, I can think of only 1 good reason it would try to do that.

As for our own models that are more specific...
 This is very interesting, not only is the market up against its normal EUR/USD correlation, but commodities broadly as well today, this is aberrant behavior especially  for commodities.

 Commodities vs the SPX (green line) since the bounce, commodities clearly are less excited and longer term at a much, much larger dislocation since December. The point of looking at this is that commodities are a risk asset and when the market is truly in a real risk on mode, they should rally with equities (which besides everything else I've shown you, the market Breadth post from 2 nights ago clearly shows equities falling apart individually, that is not apparent in looking at the averages alone, only when you look at internal breadth).

 The normal Euro/Market positive correlation is absolutely smashed today, meaning today's move is a rare and strange move, again I think you understand why I don't find this to be strange, but expected.

 Longer term, divergences between the Euro and the SPX have sent the SPX lower, they should rally together for the most part unless something is very whacky in the currency pairs which makes the $USD and Euro travel in the same direction which they almost never do and are not doing today.


 This is what the divergence in the Euro/SPX from above would have looked like at the time before the SPX dropped.

 High Yield Corporate Credit should not only be in sync on a risk on move, it should lead equities, here it is lagging badly on the bounce.

 This is the Energy complex vs the SPX, in white Energy had more positive momentum and led the market higher, now it is negatively divergent with the market.

 Financials are in sync today with the market and have been pretty much that way throughout the bounce, but remember the Financial/Tech post from last night, underlying action is very bad.

 Technology led the market early in the bounce, today it is nearly running opposite showing a lot of weakness.

The findings from the 3 major sectors above (Energy, Tech and Financials) can all be seen and confirmed in today's sector rotation, Financials at the bottom have the best relative performance vs the SPX, Energy and Tech have some of the worst performance. Utilities are also showing strong performance, which is a bit odd as they are a defensive sector.

As for commodities strange behavior today (and strange behavior is part of what I was looking and hoping to find this week), lets take a look at a few major commodities.

As I mentioned above, the only way commodity strength today would make sense with the Euro down (because if the Euro is down, the dollar is up and the Euro/$USD pair is the biggest influence on the dollar Index-out of the dozens of pairs, it accounts for 50% of the DI) would be if there were a major FX upheaval that saw the Euro and Dollar trading together which I don't think I've ever sen, but just for confirmation, I use the dollar in these comparisons.

The basic concept to understand is that most commodities are traded the world over in $US Dollars, therefore when they dollar is weak, commodity prices must rise to make up for it, when the dollar is strong, commodity prices fall. Today the dollar and commodities are strong, aberrant behavior.

 This is a multi year chart of USO with the $US Dollar in red and you can see the inverse relationship I described above, when the dollar is up, oil falls, when the dollar is down, oil rises.

 Now look at the behavior today, even yesterday you can see a hint of the inverse relationship at 3 p.m., today they are traveling in sync.

 Here is USO but with the Euro as the comparison symbol, you can see (because the Euro trades opposite the dollar generally) the positive correlation, if the Euro is up, oil is up, if the Euro is down, oil is down, NOT TODAY.

 Here's copper vs the Dollar with the typical inverse relationship to the left and a totally whacked out correlation today. It's as if these assets are being moved against all odds, against all correlations or you might say they are being manipulated higher.

 GLD vs the dollar, everything is normal (inverse relationship) until today.

 The same with Silver

The same with Steel.

Like I said, it looks like these assets are being artificially manipulated higher to support the averages.