Friday, June 29, 2012

Some Closing Charts

So what did we see at the end of the day instead of selling in to the close, a SHORT SQUEEZE!!!

That doesn't mean there wasn't distribution in to it, but it's neither here nor there as they are intraday signals and not really all that important to our strategy.

 Here we have the SPX and the former closing highs at the red trendline to the right.

At the close, we see a short squeeze, small, but a squeeze as price moves above that trendline which I may not have drawn exactly perfect. This is what a short squeeze looks like, there are few if any pullbacks, it's just a snowball effect.

A quick look at some charts...

 DIA 1 min intraday shows a leading negative divergence, this suggests that the DIA was seeing distribution in to today's gap up. This is also only a 1 minute chart, it doesn't have much weight except on very near term trade. Looking at this, I would expect a little backing and filling on Monday, BUT we are in short squeeze territory, if we get some positive sentiment over the weekend, this divergence will be run right over by a short squeeze.

 DIA 60 min, this is where the trend really counts, only a daily or multi-day chart is more important. The small negative divergence on May 1, you may recall. We even knew how the second half of the day would look and that was the last day we entered core short positions. 3C stayed in line with the downtrend until the pennant portion of a bear flag/pennant was formed, 3C went very positive there. This is why I suspected the bear flag was a trap. Sure enough the bear flag/pennant broke and 3C showed accumulation by smart money as retail shorted the market, the bottom was June 4th at the 3C positive divergence. Then I said, "Watch out at resistance, smart money will want to draw in shorts by making a test of resistance look like a failure"-a classic short set up), sure enough at the next negative divergence, there it was, the apparent failed test of resistance, price backed off and in to another positive divergence and here we are today. We have called every major move and reversal since May 1st (actually even before) and many, like what would happen as the bear flag/pennant formed, were called before the action even started.

The point of this chart is that the 60 min is in strong enough position to execute a short squeeze which is what we have been looking for since the lows of June 4th.


 Intraday this chart of the afternoon shows what I believe to be some short term distribution in to the price strength. This could also be distribution that is just taking profits off the table in front of an uncertain weekend. Either way, it's intraday, not a big deal.

 The 2 min chart of the IWM looks more like we see backing and filling Monday, but still, it's only an intraday chart, easily run over by the Euro gapping up above the June highs Sunday night.

 3 min IWM, shows a negative divergence, again this is along the lines of backing and filling on Monday, unless the Euro opens up and holds, then we are off to short squeeze land.


 The 5 min IWM is about as serious as the negative divergence gets, this is a timeframe that is a bridge between intraday and trends that move the market for a day or more.

 The 15 min shows the head fake in yellow at the June 4 lows with a serious positive divergence. Think about this, a perfectly formed bear flag/pennant breaks down, technical traders have price confirmation on what they know to be a continuation pattern (continuing down), as they sell short, they give smart money not only the supply needed to accumulate in size, but at better prices and they get to use the shorts as an ignition source in a bear trap. There are a few smaller divergences, but the overall trend of 3C is clear and it's higher than it was at the May 1 highs.

 IWM 60 min is plenty strong to do what we have expected.

 QQQ 2 min intraday, again suggesting some backing and filling Monday

 3 min at the EOD, it looks like the price strength was sold in to, but still very small beans.

 The 5 min-negative, not horrible, consistent with a consolidation/pullback.

 Look at the QQQ 15 min, look at the positive divergence yesterday and how much more accumulation there was at the same relative price level as the 14th. Also note the leading new high.

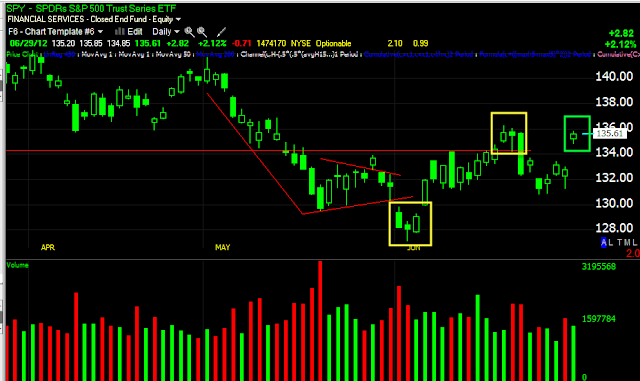
Finally the SPY 1 min, from a negative to actual small accumulation on the move above the former SPX closing highs.

All in all, I'm very happy wit where we are at. How many successful GLD puts did we have the last week? 3, 4? We set up a bunch of other trades and on our terms, we didn't chase anything. In the equities portfolio where the core shorts and the leveraged long hedges are, there are 6 core shorts, all in the green up to 22% in CAT, BIDU at +21%. There are 4 leveraged longs as hedges, 3 of 4 are in the green with TYH down 4% and TNA up 19%, that's 10 long and short positions with only 1 at a loss.

I think this market has been a meat grinder, but at the same time I think we have successfully navigated it. I have so many great emails every day of great trades that you all are putting on and best of all, many are your own, you applied the concepts, used the market updates and you made it happen, that's my goal.

I'll be posting some here and there over the weekend, but for now, ENJOY, You have done a great job the last 5 months in a really tough market!

The Basic Question

In different forms, I'm getting a lot, LOT of emails asking about the market. As for the near term, the charts suggest a pullback, some backing and filling and we can see that forming up in all the averages, but I'll just use ES for now.

 ES intraday going negative, from what is visible now (not trying to predict the weekend), it looks like some backing and filling is in order.

As for our sub-intermediate expectations, so far everything has gone the way we expected, the head fakes in the yellow boxes, just about everything and we've had to trade nimbly. The one thing that hasn't happened is a short squeeze in the EUR/USD and market. Both are in the area that could produce a short squeeze and over the weekend we could get some news that easily trumps the short term 3C negative divergences suggesting a pullback from here and then it would be off to the moon.

Our risk asset layout is still supportive of the market, most of the 3C longer term charts are still supportive of a final short squeeze move, although some damage has been done.

The way I see it, short term trades like the GLD trade, etc that were leveraged, I want to close out, they made their money. The leveraged long hedges that were bought at the market lows as a hedge for the core short positions, I want to leave in place and of course the core short positions which are ALL at a profit still, I want to leave in place.

That's how I have set up things and I think many of you have done the same. So very short term trades, I want to take profits off the table. The sub-intermediate leveraged longs that were to act as hedges for the primary trend, core shorts, I want to leave in place and the core shorts I want to leave in place.

I realize there are many individual stocks and trades, this is just a general assessment. For instance, I'm leaving the BIDU long in place even though it was meant to be a shorter term trade. There are some exceptions, but for the most part that's how I view things at this point.

If the Euro can hold up and make new highs above the June highs, we may finally get the short squeeze I have been looking for before we see the next primary trend leg down.


Is UNG Going for Stage 2?

I still have the straight UNG long at about a 14% gain, I view this as a long term position. After the slight break above resistance this week there were 2 options, 1) UNG made a slight pullback, gathered steam and went for a breakout from the stage 1 base to stage 2 mark up and the second option was a deeper pullback to the diagonal support trendline of a large ascending triangle pattern.

Lets take a look...
 There's the trend line I mentioned for UNG, it was either a small pullback and go for it or a larger one, earlier yesterday before the "event" I thought a deeper pullback, now I'm not so sure.


 UNG 1 min leading positive off a strong positive yesterday on the pullback we've been expecting.


 The 2 min is leading positive above the recent failed breakout attempt.

 The 3 min is positive from yesterday and also leading positive-you see the migration through the timeframes?

 The 5 min is leading positive and we already know about the longer charts...

 The 30 min looked like a deeper pullback, but

The more important 60 never went negative.

I'm holding UNG either way, but a break out above this level should send UNG in to stage 2 mark up and there should be a trend there.

USO Follow Up


The Calls came out at 103% gain, here's why...

First, as they say, "Bulls make money, bears make money, pigs get slaughtered" I think USO has potential for more upside, maybe I'm just a little too use to trading this market nimbly while we wait for a potential short squeeze, but with a gain like that and some relative negative divergences, a pullback or correction seems likely, unless we get our short squeeze and I'm starting to think whatever happened yesterday may not have been about the EU.

 USO intraday 1 min negative

 2 min negative relative divergence

5 min negative relative.

Like I said, I still think there's more room on a short squeeze, but for now I'll take the 100+%

Selling USO Calls


USO July $30 calls, I'll look to add at a lower price.

Pullback in to the close?

That's what I thought earlier, this isn't a full market update, but if there's a negative divergence for a pullback in to the last hour, this looks like it.

 SPY 2 min neg.

SPY 5 min negative.


Risk Asset Update

Overall they're not looking as bad as I expected after seeing CONTEXT.

 Commodities are performing well today, despite some pressure from the $USD intraday (ONLY).

 Take a look at GLD, we closed our GLD puts yesterday on a 3C signal, that makes something like the 3rd or 4th successful GLD trade in a row for 30-nearlt 50% gains in 1 -3 days.

 High Yield Credit seems a little off today vs the SPX.

 Longer term, for a while HY credit looked like it was sending us a signal that the party was over, but it shaped up and is pretty much in line with the SPX now.

 HY Corp. Credit is lagging a little today vs the SPX, it's not the kind of divergence I would trade, but there's a slight bit of underperformance there. You may recall that HYC Credit was quite supportive of the market yesterday as can be seen in the white box, that's the kind of divergence that's worth paying attention to.


 Longer term HYC credit is still in good position and supportive of the market, even though on it's daily trend, it is quite extended above its downtrend channel.

 Yields are a bit weak today.

 Longer term they are close to in line, but you can see today's weakness.

 The $AUD is holding up well today.

 Longer term $AUD is still supportive of the market.

 The Euro intraday is obviously a bit weaker than the market, I think we are seeing some short covering and stops being hit in a number of trades we identified as being bear traps.

 Longer term the SPX is a bit more excited here than the Euro, however the picture was a lot worse at the start of the week.

Sectors, nothing surprising here, all of the defensive sectors are off, Industrials, Energy and Basic Materials are still outperforming on a momentum basis as they were yesterday, Tech is finally picking up a bit and Financials are leaking off a little as the day wears on.

All in all I think the trend that we are looking for and the probability of a short squeeze still look good, there's no major damage here, at least nothing that we haven't already seen looking a lot worse.

FX

 Here's the daily chart of EUR/USD and this is the resistance level the Euro has had trouble holding, I also suspect if the Euro holds this and moves above the June highs, we'll see a Euro short squeeze which will send the market higher as well.

 On a 5 min chart, this is the break above that level, you can see how the Euro has leaked off a bit during regular hour market trade as I mentioned in the USO update.

 The Euro intraday is seeing a 2 min negative divergence.

 This has leaked slightly to the 3 min chart, but nothing horrible.

 The 1 min chart very recently has a slight positive, but it would need to really build on that and migrate through the 2 and 3 min charts before I'd suspect that it would hold the Euro up through the close. It may be getting ready to shape up for overnight, but this is way too early to tell with 1 divergence on a 1 min chart. It does match the $USD charts below for the same timeframes.


 The 2 min was leading positive and drifted off from that divergence.

 That bled through to the 3 min chart, this would suggest the $USD head a bit higher intraday.

 Again however, we see the 1 min is deteriorating, the opposite of what is seen in the Euro. Still this would have to bleed through to the 3 min chart and I don't give it a high probability of happening before the close.

Longer term, this supports the idea of a short squeeze in the Euro...

 The $USD negative at the May/early June top and has stayed leading negative even as it bounced in June.

The Euro went positive in May/June and stayed leading positive even as it pulled back in June. So the bigger picture still looks good for a possible Euro short squeeze.