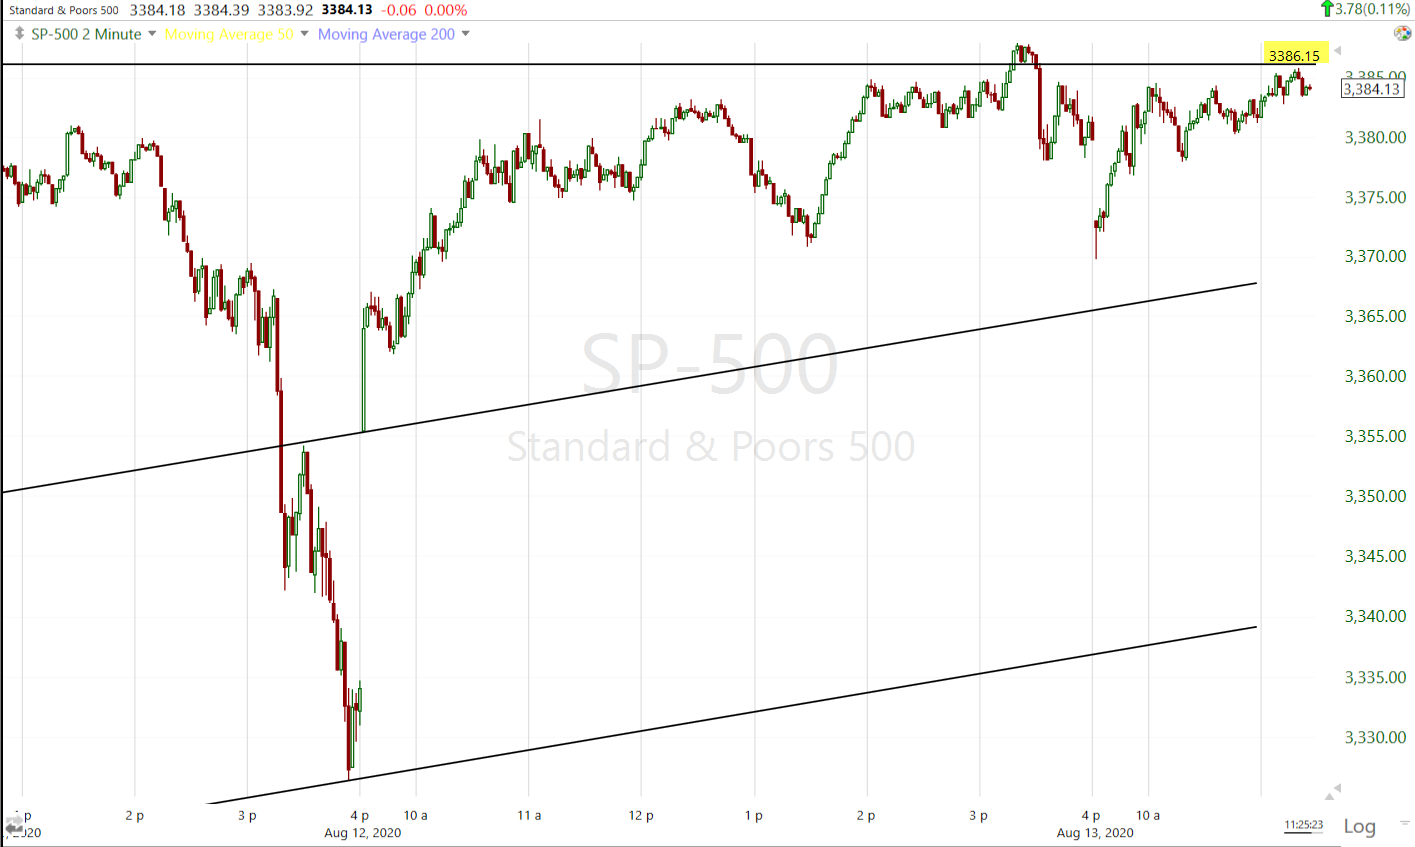
Index futures made an unusual push higher in the wee hours of the morning. S&P built on that in the cash session to come within a few points of its February record high, but couldn't quite seal the deal this afternoon.
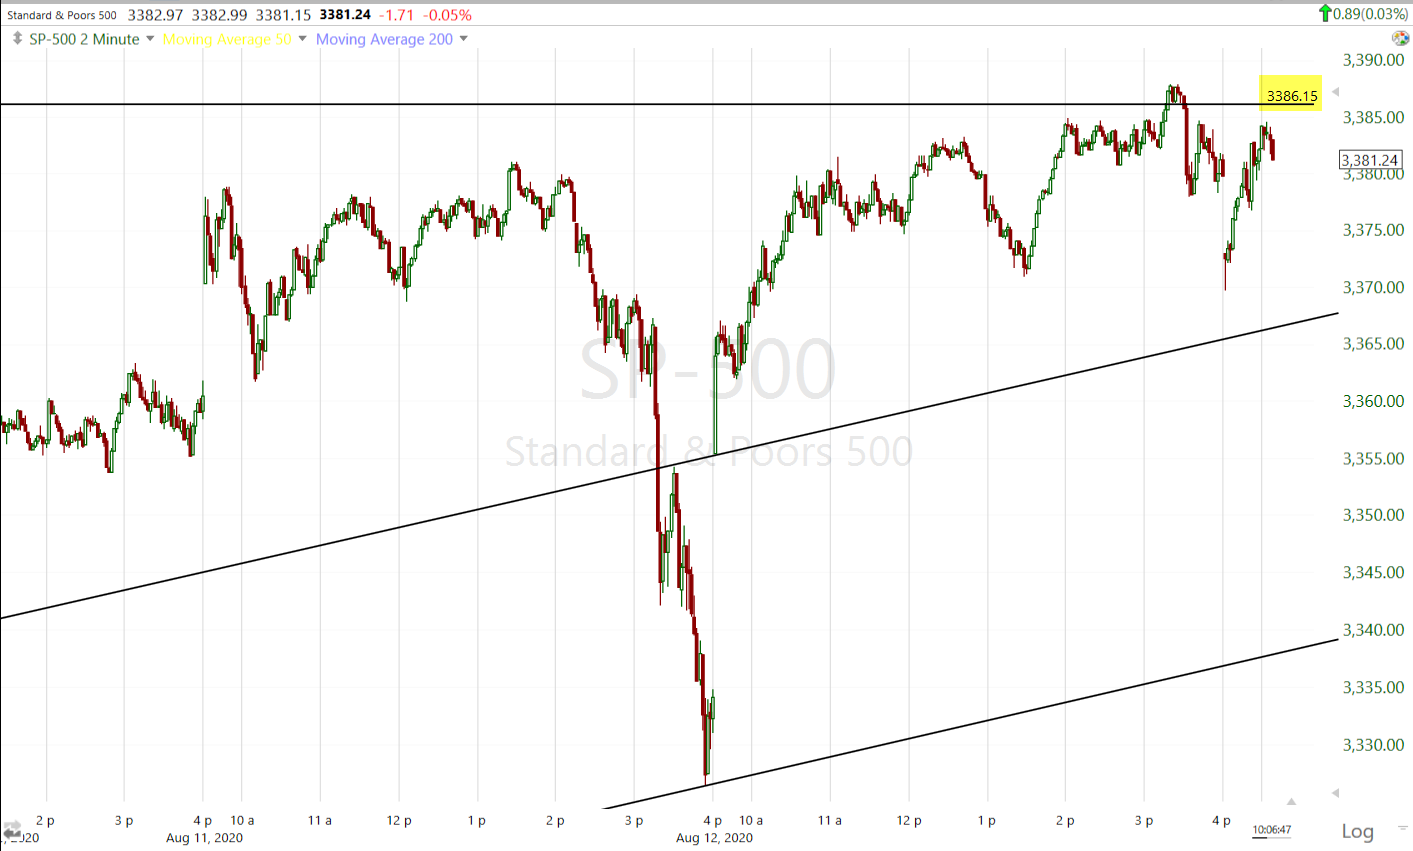
SP-500 (2m) briefly above February's closing high.
What was more unusual than the overnight ramp was what happened at the very start of the cash session. Before the open Small Caps and Dow had a slight edge as they've had the last 3 days, not so much as to stand out as notable strength. As soon as the cash market opened, things changed fast.
Small Cap Russell 2000 futures (1m) ramp in the overnight session, and decline from the cash open
NASDAQ 100 futures (1m) ramp in the overnight session and rally from the cash open
Dow futures (1m) ramped overnight, but were more or less flat on the day from the open.
The dynamic between NASDAQ and Small Caps today is the exact opposite of what we've seen the last 3 days as rotation from growth and momentum to value, lifted small caps and sunk NASDAQ.
Small Caps and NASDAQ 100 (1 min intraday) the exact opposite of the last 3 days.
It's not unusual to see relative performance differences between sectors, style factors and the averages, but generally the averages trade in the same direction. The last 3 days, and today's complete reversal of the trend, is highly unusual. You can see just how unusual on the chart below.
Small Caps and NASDAQ 100 (5m) trend mostly together, except the last week.
As for the rotation of the last 3 days into economically sensitive cyclical sectors and value style factors, it hit a brick wall today. The growth factor retraced all of the last 3 day's losses, an momentum retraced about 80% of the last 3 days loss/rotation. It has virtually vanished.
After leading yesterday's declines, the mega-caps Tech stocks were the top performer today, almost as if the invisible hand that moves markets saw that small caps were not moving the S&P enough to take out the Feb. high, so Apple (+3.3%) and Microsoft (+2.86%) were called up to finish the job. As mentioned last night, Apple's market cap is about the same as 90% of the Russell 2000 combined.
Yesterday's best performing sector, Financials led by banks, were today's worst performing and the only sector to close lower.
Moderna (MRNA +0.8%) reached a $1.525 billion dollar deal with the U.S. government to manufacture and deliver 100 million doses of its vaccine candidate. The stock gained as much as 11% and then lost most of it to close less than 1% higher.
MRNA (5m)
The day's whacky award goes to Tesla(TSLA). The stock rallied 13% simpy because of an announced 5:1 stock split. A split does nothing to the value!
In news, Treasury Secretary Steve Mnuchin reportedly offered to resume COVID relief negotiations, but Democratic congressional leadership said that administration officials refused to budge from their prior stance. This didn't help gold.
Averages
After 3 days down, NASDAQ is the leader and small caps the laggard.
S&P 500 ⇧ 1.4%
NASDAQ ⇧ 2.59%
DOW JONES ⇧ 1.05%
RUSSELL 2000 ⇧ 0.41%
NASDAQ 100 (30m) - you can see the broadening formation I mentioned yesterday (higher highs/lower lows). I still think there's a pretty decent chance this has been a large distribution zone. You have to consider the size of institutional positions in the most popular stocks (mega-cap tech), they're way too big to turn on a dime.
S&P sectors
Technology was the clear and singular leader to the upside, lifted by the mega-caps ralling together, which has been rare recently. Financials went in the opposite direction with the banks lower (-0.6%) despite higher yields. Yesterday the defensive bond proxy sectors and defensively oriented Health Care were also very weak, today they were strong. Many of the stocks in these sectors fall into the momentum style factor like the Tech sector and the style factor retraced most of the last 3 days of rotation today.
Materials ⇧ 0.59%
Energy ⇧ 0.99%
Financials ⇩ -0.28%
Industrial ⇧ 0.32%
Technology ⇧ 2.27%
Consumer Staples ⇧ 1.29%
Utilities ⇧ 1.45%
Health Care ⇧ 1.68%
Consumer Discretionary ⇧ 1.33%
Real Estate ⇧ 1.26%
Communications ⇧ 1.19%
Basically everything that was weak yesterday was stronger today and areas that were very strong yesterday (i.e.- Banks) were weak today, right down to the most shorted index of stocks that has been performing better than any of the averages. They traded much more like Small Caps (weaker).
Internals
Considering the S&P and NASDAQ gains, market breadth and volume was uninspiring. NYSE Advancers (1844) edged out Decliners (1084), but not by much considering and on much lower volume of 770.9 mln shares. NASDAQ advancers (1825) weren't much more than Decliners (1426) considering NASDAQ's advance.
The price/volume relationship was extremely dominant at Close Up/Volume Down, the weakest p/v relationship. Internals today are very close to a 1-day overbought condition, except the ratio of advancers to decliners is too weak.
Market breadth had been better with small caps' stronger recent performance, it deteriorated noticeably today.
NASDAQ 100 (1m) and NASDAQ Comp. Advance/Decline line
SP-500 (1m) and NYSE's Advance/Decline line.Volatility
VIX (-8%) gave back most of yesterday's outsized gain, but considering the S&P retraced all of yesterday's loss and added +1.4%, VIX shows a little relative strength. It's Russell 2000's volatility index that stands out with unusual relative strength.
Notice it started displaying relative strength 2 days before yesterday's loss. The same thing happened last week with NASDAQ's volatility just before it traded lower.
NDX volatility displayed relative strength 1 day before the 3-day decline.
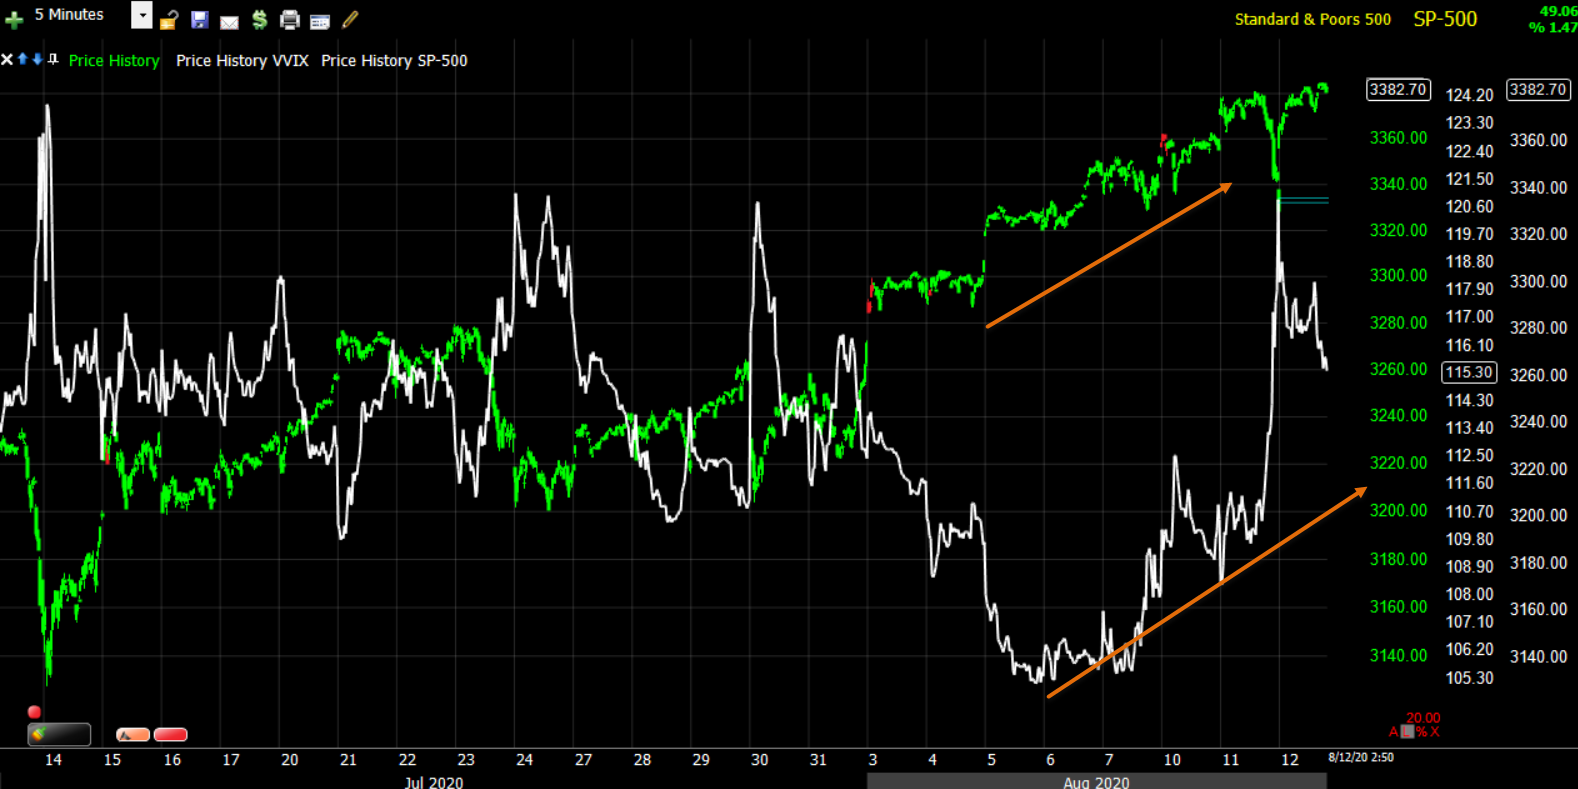
VVIX's relative strength is jumping off the chart.
VVIX vs. SP-500 (5m) relative strength points to pros hedging risk.
As mentioned in the Afternoon Update, VIX futures built a positive 3C divergence throughout the cash session.
Treasuries
Treasury yields were up for a 4th day, but in a narrow and choppy range, finishing little changed. The 2-year yield was unchanged at 0.16%, and the 10-year yield increased one basis point to 0.67%.
10-year yield (daily) ended with a star candle (loss of momentum) near the 50-day moving average.
Currencies and Commodities
The U.S. Dollar Index decreased -0.2% to 93.44 which allowed commodities and precious metals to recoup some of yesterday's losses.
WTI crude gained +2.3% to $42.60/bbl.
Gold futures gained a modest +0.1% to $1,949.00/oz a day after losing more than 4% on rising real yields. As covered last night, gold's price action has not stabilized yet.
GLD (15m) after COMEX gold closed, futures and GLD sold off into the close. Gold miners (+0.5%) displayed a little better relative performance, but I'll be looking for prices to stabilize in both miners and gold. If yields lose upside momentum as they seem to be today, it could help gold stabilize being gold is tracking real yields inversely.
Bitcoin bounced and GBTC gained +4.4%. I still like the prie action here, BTC is just at a key level it needs to work through ($12k).
Summary
Whatever the rotation from momentum/growth (mega-caps/Technology/NASDAQ) to value (cyclical sectors/small caps) was about, it was almost completely unwound today. As demonstrated by the divergent price trend between Small Caps and NASDAQ over the last 4 days, it's highly unusual. From the second week of May to the first week of June there was an even stronger rotation to value with much better confirmation from other asset classes (bonds, commodities, currencies), and there was nothing like this divergent price trend.
I got the feeling from the overnight ramp and the leadership of mega-caps (while very little else participated meaningfully as exhibited by weak breadth) that is was almost like the invisible hand that moves markets made a phone call and said, "Get the S&P above the February highs". Driving Apple and the other mega-caps higher is a much more effective way to accomplish that goal. That's just a feeling.
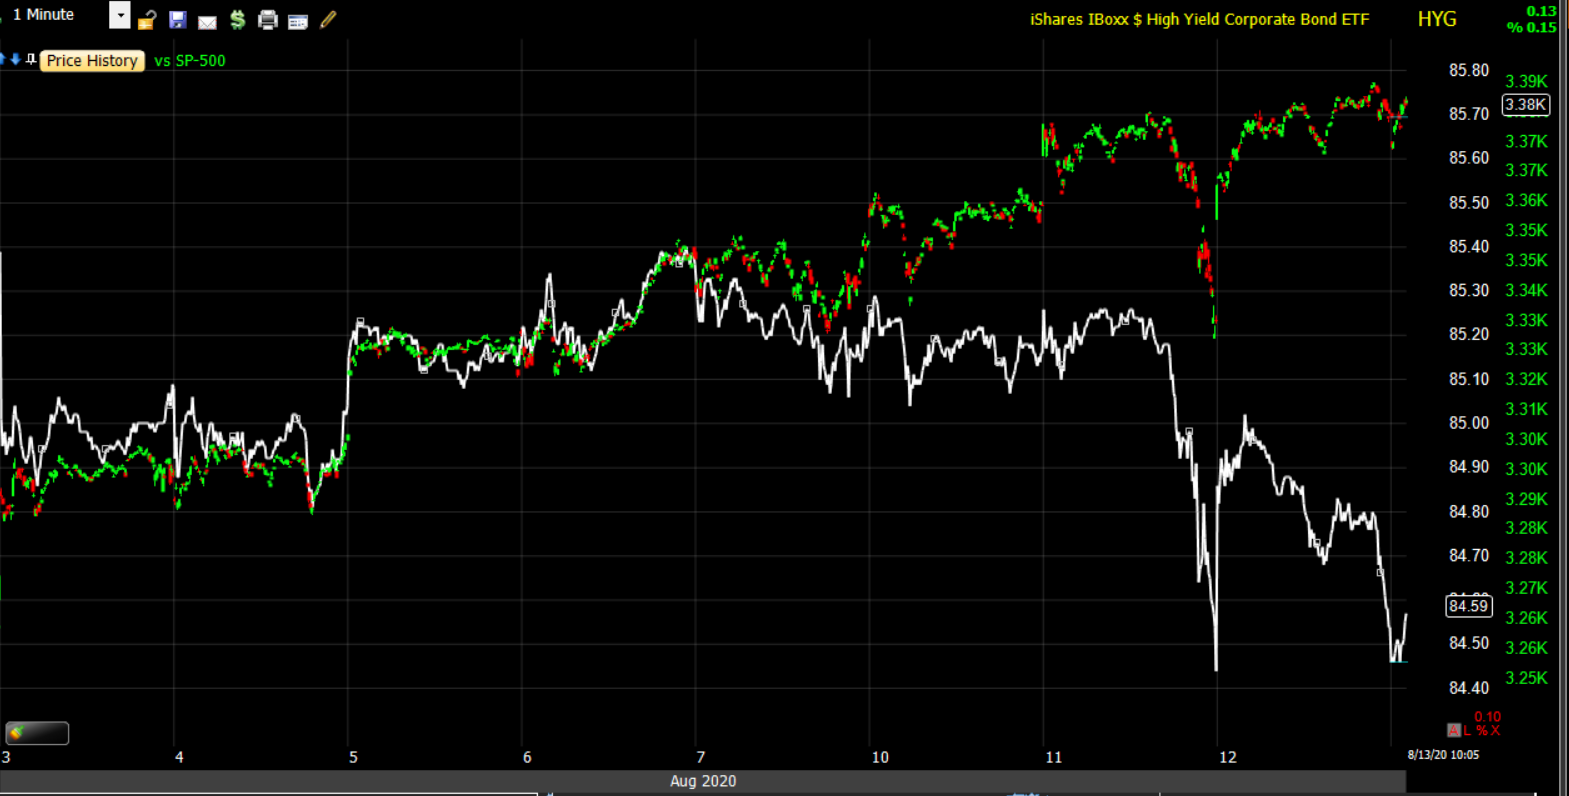
Something else stood out today. I mentioned it in the first cash session post and the last - High yield credit. Yesterday credit sniffed out something it didn't like and not long after stocks were selling off across the board. Credit was not enthusiastic about the S&P and NASDAQ's advance today, but toward the close it got outright ugly again like Tuesday afternoon.
SP-500 (1m) and HYG (high yield credit). HYG is not the only credit asset not playing along. I don't know what caused the weakness in credit yesterday that preceded the decline in stocks. I mentioned that HY credit does not like higher yields as a possible influence, but yields weren't moving much today. Look at the sell-off in credit into the close as the S&P was just a few points from the February closing high. It happened fast, but after flashing weakness all day. That's uglier than yesterday.
In last night's Daily Wrap one of the issues I mentioned was technical levels as an influence (I used Energy as an example). The S&P is two-tenths of a percent from the February high. That's a psychological magnet. I'm surprised it wasn't hit at the close. I expect it will happen. If credit still looks like this (or worse), I'll be entering a new short trade.
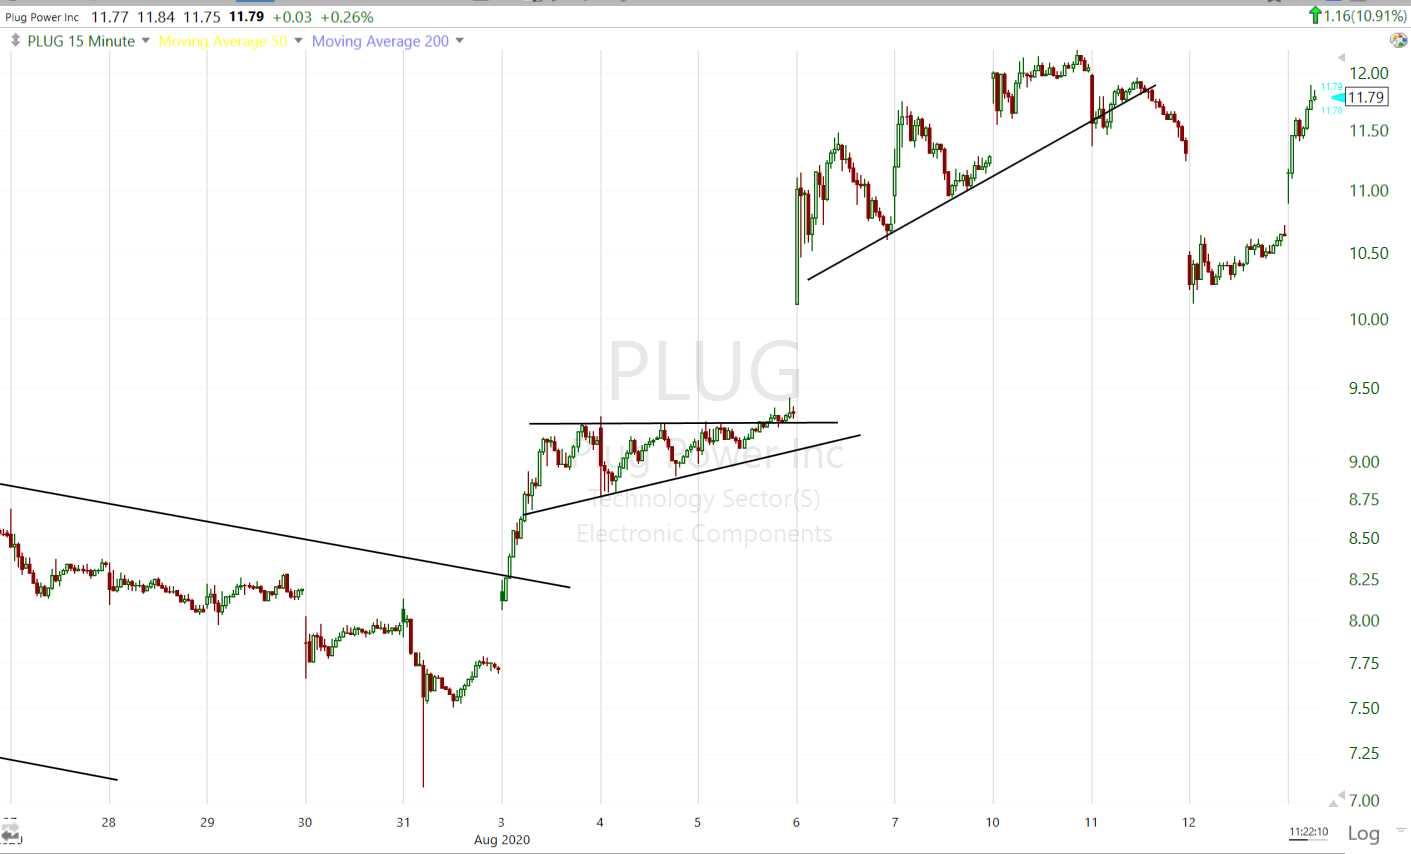
*I closed out the PLUG long this afternoon. My trailing stop to protect profits waas $10.25. Yesterday I sold enough to take all risk off the table and let profits run and I moved it the stop up to $11. Price gapped down below $11 today. I gave it the rest of the day to see how price acted and while it came up +5% off the morning low, the price action suggests a high probability of more near term downside. I think filling the gap down to the $9.25 area is probable. If it does, I'll take a look at it on the long side again. It will also depend on the tone of the broader market. I don't want to have a lot of long market exposure with credit taking the ugly turn it is taking.
Overnight
S&P futures are near unchanged (-0.05%). Russell 2000 futures ended the day with weak, ugly price action similar to yesterday.
WTI crude is near unchanged (-0.15%). Gold futures are down -1.1% , that's the late day selling after the COMEX close.
Treasury futures are flat and currency futures have flat price trends. I think someone put in a lot of effort last night to get the S&P close to the February highs so I suspect it hovers in the area overnight.
I'll be looking at credit in the morning.
Hopefully the website issue will be resolved. Last I heard was they have a ticket in to work on it, but apparently this effected a lot of people due to the roll-out of a new version of the software. When the regular site is back up you will get updates in your email and you'll know that it's back up. My apologies for the inconvenience.
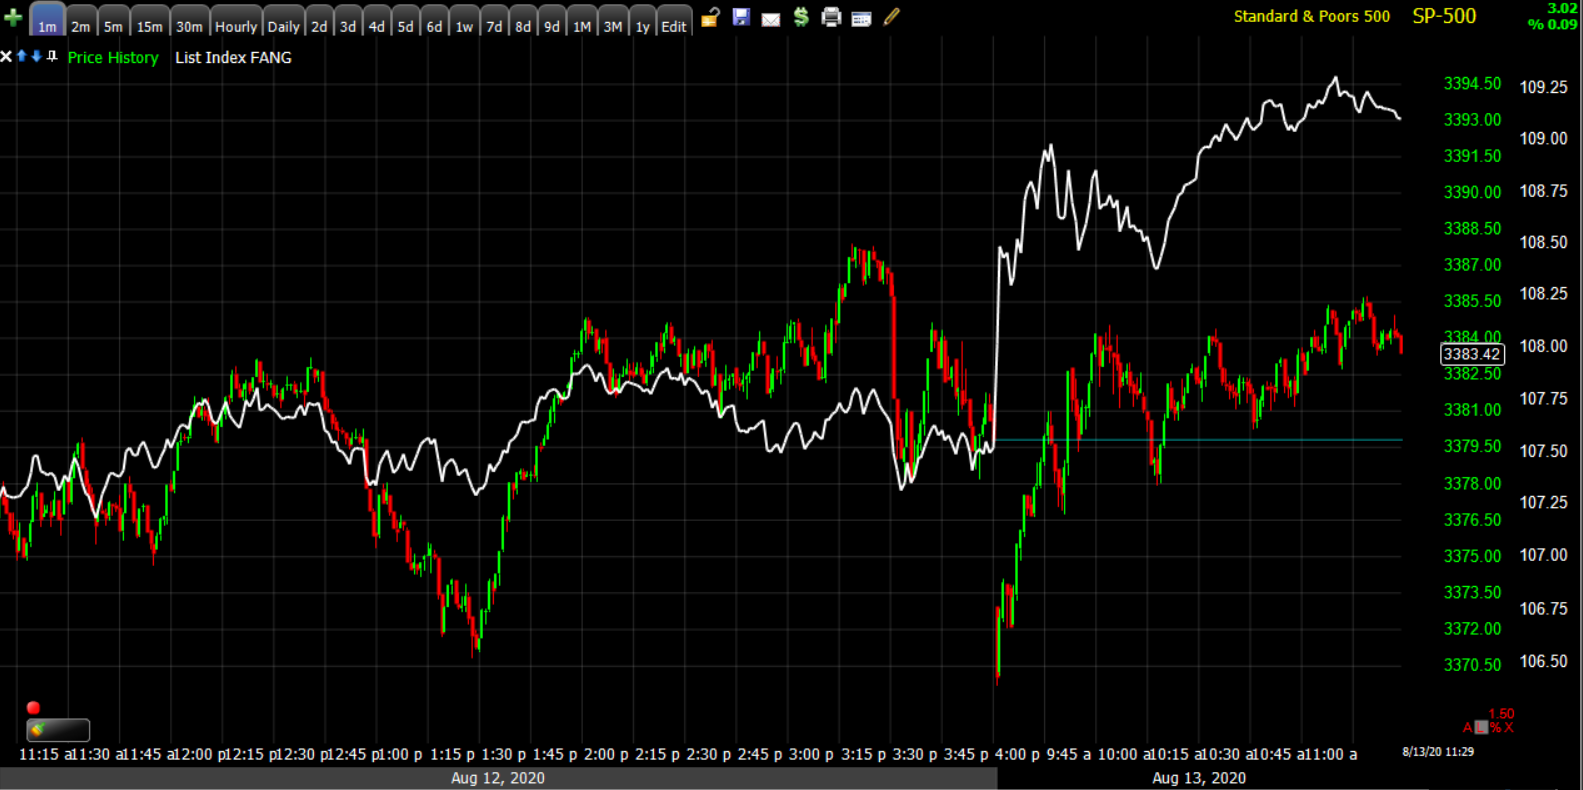 SP-500 (1m) and an equal weight index of the FANGs
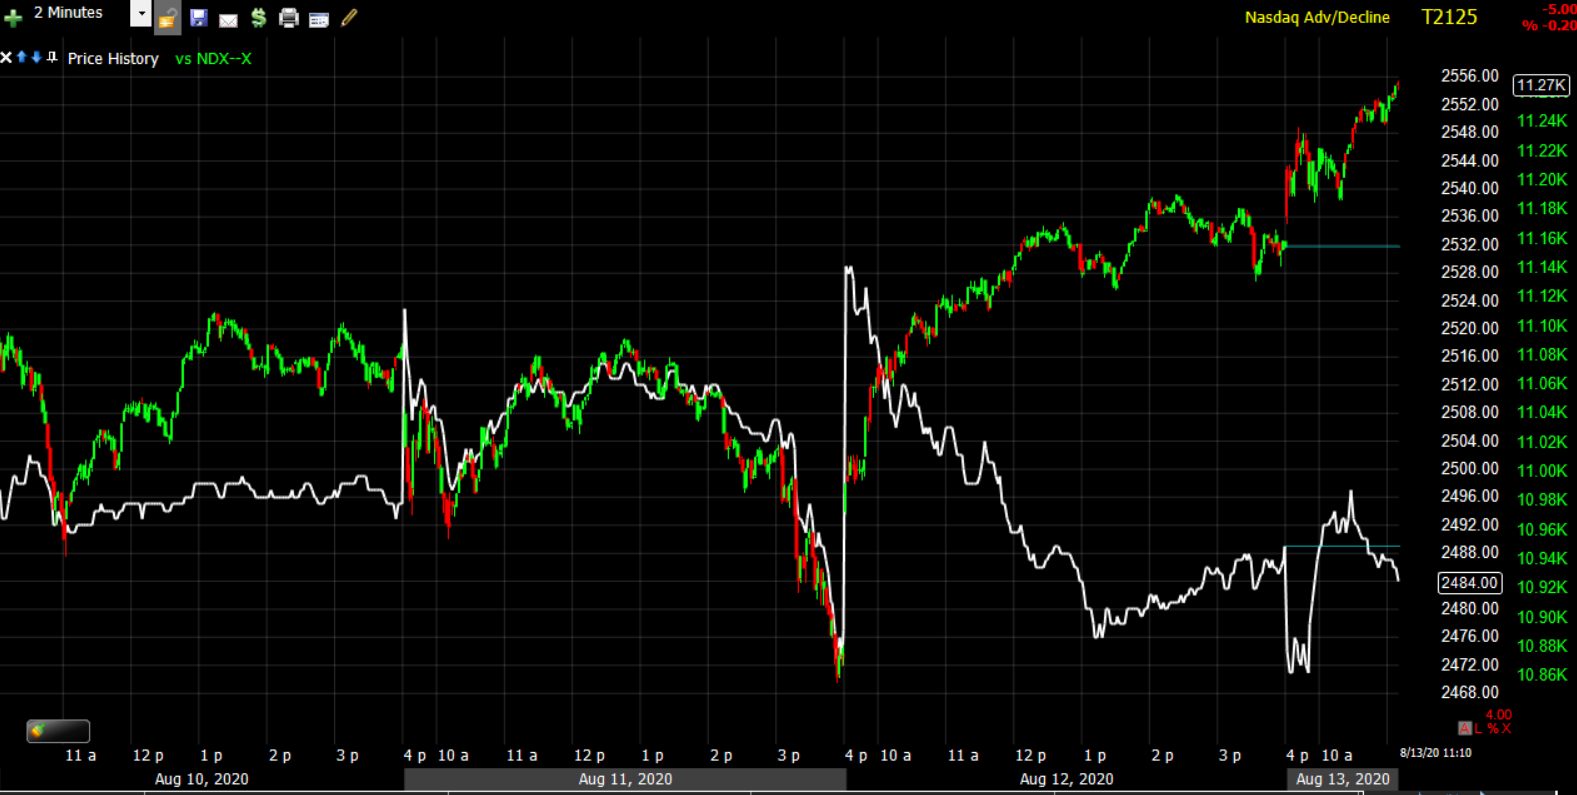 NASDAQ 100 (2m) led by the mega-caps, but the advance/decline line shows little participation elsewhere. The divergence here is similar to that of HY Credit.
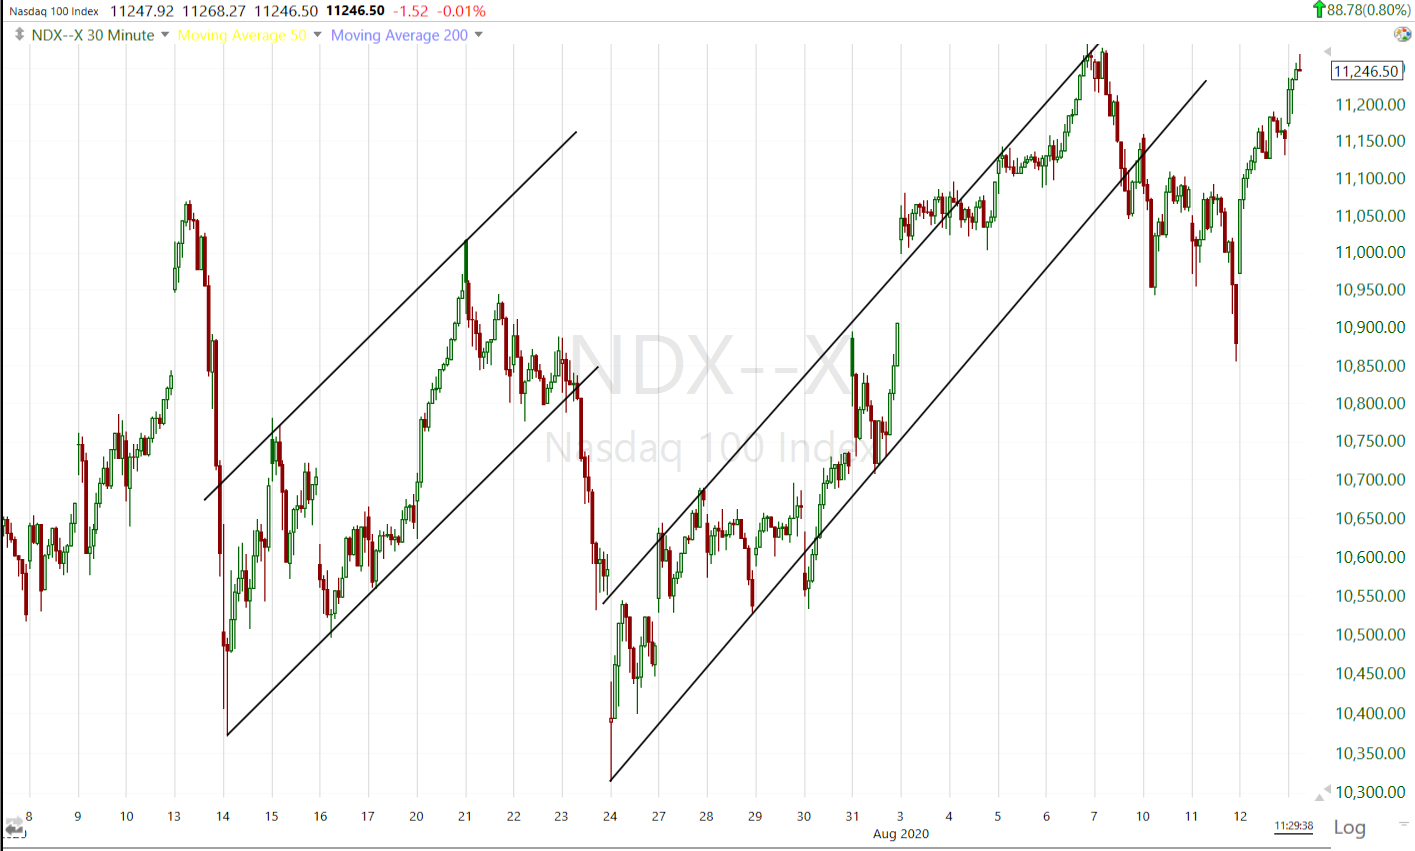 NASDAQ 100 (30m) the proposed distribution zone since NASDAQ's Key Reversal Day.