Tuesday, March 11, 2014

Accrual rather than Migration

A few minutes ago in an after market post I just said that the character of divergences this week is unique and that obviously means something.

You've seen it many times, a divergence starts on a 1 min chart as a new divergence and as it grows stronger migrates to longer timeframes, this is the healthy or standard strengthening of a divergence and tells us to some degree what we can expect in the near future. However this week has been different, we have had negatives and positives, but no migration. I don't think there';s a single divegrence that is stronger on the positive side today than it was on Friday when I put out my preliminary trend/price expectations for this week, that's odd.

Looking at the charts intraday I can see why there's no migration and thus we have no 5 min positives as we normally would 2 days in to a new cycle. What the charts show intraday are a series of positive and negative divergences, there are steering divergences that keep the market from moving too much in either direction, but the fact they are mixed and negatives are present has prevented the normal migration of a divegrence, but that isn't to say the market is just spinning its wheels.

I've seen this from time to time although not often, I would call it an accrual. Imagine you put $10 in a piggy bank and then take out $5, then replace it with $7 and take out $3, then replace that with $4. This concept is pretty easy as most of us live this way, we deposit a paycheck or earnings and we pay bills, maybe make some discretionary spending decisions and after a period of time we have either saved money, live paycheck to paycheck or live beyond our means and spend more than we make. 3C is no different in this manner, we are tracking the trend of divergences, money flow in to or out of a stock, this is why I say, "When you can't find a trend on the short term charts, move to the longer term charts, " which is like saving money in your account one month, maybe coming up short the next, but if you look at all of this over the period of a year you smooth out the fluctuations and understand the trend of your financial status, 3C is doing the same thing except we are trying to determine the trend of an asset's underlying money flows and follow that.

Most often Wall St. sets up these cycles in advance, whether it be a small one like now or the set up that took place from Jan 27th to February 6th that led to the massive february rally, the point being, "PRICE IS NOT AS RANDOM AS MOST BELIEVE, THERE ARE FLOWS THAT ARE INTENTIONAL AND/OR GROUP THINK".

We usually can tell if there's an accumulation or distribution cycle under way through migration or strengthening of a divergence whether positive or negative, but this week has been odd in that manner as the positive hasn't moved much further if any further than what we saw the last two hours of Friday.

However following my own advice I went to the longer charts and what I found wasn't migration, but accrual, a trend or flow accruing on a longer chart meaning a heavier flow.

 Here's the 1 min intraday SPY, note the positive relative divegrence toward the end of the day, it actually starts around 2:30 through the close, now you saw the AUD/JPY post...

 This is the Yen, I posted the chart earlier today as a negative divegrence set in as the Yen headed higher and the carry trades, especially AUD/JPY all got slammed, remember a higher yen means a lower carry trade (yen based) which means lower index futures, this is why the 15, 30 and 60 min Yen positives are so important to near term trend pivot to the downside.

However in the short term you know I've been looking for some market upside to allow for the VIX futures to give us a short term signal being the intermediate and long term are already in place, this is the market pivot signal with VXX being used as a proxy for the market.

Note the time of the negative divergence in the Yen, it's strongest around 2:30 through the close. Not only does this change the prospects for the AUD/JPY carry trade and the others such as USD/JPY, but near term prospects for the Index futures and thus the market itself.

 Looking at the $AUD futures alone we have a positive divergence in them that starts around, you guessed it, 2:30. A positive or upwardly mobile AUD and a downward move in the Yen sends the carry trades up and can lift the index futures, something that failed to happen last night as they were all flat.

 Here we see the SPY since Thursday, but today is my focus, there are at least 2 clear negative divergences, one a leading negative of some size for intraday and then a late day positive around 2:30.

The point is there's a mix, in the short term you might think of them as steering divergences, but I discovered something else in addition along the lines of accrual.

 The 3 min trend is not getting better, it's getting worse, but we still have to go out a bit further to eliminate noise and reach pure trend.

At the 10 min chart the chart has been in leading negative position about as long as you'd expect considering distribution starts in to higher prices, but it's today's action that is interesting which is in its own red box, note the 10 min chart in a full on negative leading divergence that just hit a new low on the chart for the entire month of March, February and the last 10 days of December, that is happening right now, even though there's no migration as it seems we need one thing to happen short term while something else has already set up and continues to do so longer term.

I found this on the 10 min chart which makes sense for 2-3 days, if it were a 60 min chart I wouldn't hold the same opinion, but it seems the process we are seeing is distributing more shares than accumulating over the longer period of 3 days while intraday charts have some recent positives, this tells us something we already suspected to be very high probability about the market, I think it also bolsters the case that we are near a transition or pivot moving us from a mature stage 3 top for the Feb. rally or cycle and moving to stage 4 decline as we originally envisioned days before the rally even started.

It Keeps Getting Better

I'll have to check the news and rumor flow today, but I've heard there may have been a second Chinese default, the first was Chaori, the first time the Chinese municipal government or some bank has not come to the rescue of a company that can't make their interest payments on their bonds and as a result, the taken for granted lack of perceived risk because China would not allow anyone to default has suddenly morphed in to an all out Credit Rout in China which depends on credit creation for growth, it's clear their exports are certainly no longer driving growth as the abysmal numbers came in at the start of the week.

This in turn (rumor of a second default) effected the carry trade with the Yen gaining and the other crosses falling, the reason you know it is something to do with China whether truth or rumor is because it's the AUD/JPY that got hit the hardest and the $AUD is the currency that is sensitive to the goings on in Asia and China most specifically.

In any case I showed you earlier the Yen gaining in to a negative divegrence (there was accumulation in size this morning and the 15, 30 and 60 min charts have huge positives which is a negative for the market), now I'm going to show you the actual AUD/JPY pair gaining with a rare (divergences in the pairs are more difficult to come by) positive divegrence, which means the market is likely to gain as we have been expecting and waiting for and that ultimately allows the VIX futures to put in the short term inflection point that will be so useful in entering positions at the best possible time and calling the pivot or move from stage 3 to stage 4 or market decline. The market is ready, for example taking the NASDAQ 100 and looking for changes in character, price ROC alone is very telling, the first week (8 days actually) gained 6.5%, the last nearly 3 trading weeks (2.5 actually) have gained +.76%and the last 2 trading weeks are down -.21%, that's a huge change in character and it's a clear reversal process, I'm using the short term VIX futures to pin point the actual turn, but we need a little market upside for the VXX to move down and allow for constructive accumulation and a reversal process, this is exactly the same concept as what I laid out Friday afternoon.

In any case, the good news in this... whatever spooked the carry trades and AUD/JPY specifically, there appears to be a change and this may have been a purposeful head fake move.

AUD/JPY showed no distribution so it is likely an event the market had not discounted (meaning the move down was likely not set up either)   whatever news or rumor that spooked it over China .

The AUD/JPY declines substantially, but before the close we already saw a negative divegrence in the Yen which would help this carry trade and the Index Futures.

In addition, the $AUD futures are positive as well so the $AUD/JPY along with other carry trades like the important USD/JPY should move up taking Index futures like SPX, NDX and R2K with them, which is EXACTLY what we need for the VXX divergence to mature and call the exact tipping point in the market.

That's where I'd add back BIDU puts or AAPL short or any number of trades.

Lets see what happens, lots of other good stuff has been occurring as well in a week that is as distinct in character as anything I've seen, obviously there's a reason for that.


BIDU FOLLOW UP

I just had to take the gain or at least a portion of it, which I took half off the table. This was a VERY small move and it is nothing like what BIDU should bring as both a put position (which half is still open) and as a core short position which is open for me as well.

BIDU April $185 puts were opened last Thursday as a trade idea which included BIDU as an equity short, here's the link, it was only because I have a full position in BIDU (and I don't want to violate maximum size risk management rules) that I chose a put instead...

From Thursday's Trade IDea...

"If I could add to my equity short in BIDU I would, but I have a rule about max position sizes, instead I'm going with about a 1/2 size BIDU April $185 Put which is discounted by about a third today.

I'm leaving a little room on the position because it's just above that resistance level, if it adds a bit more to clear it cleanly tomorrow, I'll add the rest of the full position."

This is why I had to take something off the table considering this trade is only 3.5 days old and I think I can get better positioning on the add to or replacement of the contracts closed today...


That's a +70% gain for a very short period and given the divergences in the Q's and IWM (no matter how insignificant) even BIDU holding a consolidation may result in time decay eating away at the gain. This way I have the best of both worlds, I've locked in some of the gains (hedged the rest) and still have a position in case the divergences get run over, otherwise I can likely add to BIDU on a small bounce as long as I get in place at the right time while the bounce is still moving up and the 3C divergences are screaming short term negative.

As for the charts... again nothing that is impressive, but it is enough to get the job we need the market to do, done.
 This is the 1 min intraday small positive in BIDU, I can't think of a better place to take gains than in to a downtrend.

There were some slight volume anomalies as well that would reinforce a very short term bottom, actually that's not a good visual, say a short term bounce area which is perfectly normal in any downtrend.

 Here you can see EXACTLY where we entered BIDU on Thursday the 6th at a -30% discount. There was a little better entry on the gap up Friday the 7th which was useful as an add to area (leaving a little room in risk management for an add-to or phased entry, not typical Dollar Cost Averaging which I despise), you may recall we had immediate market wide distribution of Friday's a.m. gap.

 On the 2 min chart there's some migration of the divergence as you can see Thursday/Friday's distribution event which made a great entry, these are difficult to enter emotionally as BIDU is at recent highs, but 3C's distribution signal is telling us that's a low risk entry at the best price.  

 Again distribution late last week on the 3 min chart, however we have more migration of the positive to the 3 min chart, this is about as far as we go which is in line with the market averages.

As far as BIDU's larger cycle, you can see stage 1 accumulation with a leading 3C divergence at the Cup/Handle formation (yellow arrows), despite the C&H formation, the main point is the actual reversal process for a stage 1 base, the size of the base and accumulation, stage 2 mark up and stage 3 distribution which is incredibly heavy as it leads negative to a new low on the chart which is 60 mins. So BIDU is still a VERY strong core position, it is on the list for entries for new or add to positions and you know what we are looking for, when we get there I can virtually guarantee BIDU will be showing short term distribution along with intermediate and long term already in place.

This is a great example of the reversal process on a fractal timeframe, we have been watching the same intraday, but here we have it on a 60 min chart so the concept is the same no matter the timeframe, which is great to be able to apply to your own personal trading.

TAKING HALF OF BIDU APRIL $185 PUT OFF THE TABLE

I'LL BE BACK, TOO MUCH GAIN TO LET GO

Market Update

Here are the divergences in the averages and the Index futures, you will notice they still have not become any stronger than they were when first spotted Friday and they don't even have the ability to have gathered strength through duration as they had no positives yesterday and have seen almost as much intraday distribution as accumulation, in other words the time factor of how large the accrual of a divergence is , is not even a concept in play here.

Even the Yen is showing late day distribution after a larger accumulation cycle, so this makes sense on this 1 min timeframe with the signals in the averages and most index futures.

Nothing has changed since Friday afternoon except maybe the timing which is something I said I didn't want to get in to other than to say "Early" this week".
Earlier Yen accumulation which send the carry pairs lower when the Yen reacts to the accumulation and moves up as it did on this 1 min chart, that sends the market averages down. The negative divergence right now is not a serious event as the 15, 30 and 60 min charts gain even more strength, but it does confirm the short term signals below and EVERYTHING we have been looking for and specifically called out for this week late Friday afternoon. You'll see that by the small positives and the much larger negatives.


Index futures.
 ES hasn't done much, but the SPY has.

1 min NQ or NASDAQ 100 has a 1 min positive intraday.

So does TF or Russell 2000 futures.

These will not hold overnight so if they don't fire off before the close they are a moot point, the same is not true of the averages below, trade will pick up where it left off on a 3C divegrence the next day most of the time.

The averages...
 A small SPY 2 min positive has formed here.

However as I have been saying in this rather odd mini cycle that shows NO MIGRATION of the positive, there's NOTHING ON THE 3 MIN CHART EXCEPT NEGATIVE SIGNALS.

This fits EXACTLY with Friday's late day analysis for this week.

The IWM 2 min has a "RELATIVE positive, this is the weakest form, but it's there.

The divergence that has always means the most for the averages is the IWM 3 min relative positive above.

However, at 5 mins. AGAIN NO MIGRATION AND IN FACT A LEADING NEGATIVE DIVERGENCE.

This is just more confirmation of how weak these signals are, they should still do their job, but they are exceedingly weak, to not be able to migrate to 3 or 5 min charts in almost 2 days at ALL is something I rarely see.

 QQQ 1 min is positive as you see in to late day washout, possible head fake low.

The QQQ 2 min is also positive in to recent lows...

However at 3 mins, other than seeing a possible stop run head fake move, EVERYTHING about this chart is negative.

AGAIN, WE ARE RIGHT ON TRACK AS FAR AS MARKET SIGNALS, THE WHOLE POINT IS THE TIMING, NOT THE MOVE.

Still Intraday Positive Divergences

I'l have charts out ASAP, but this move is scaring retail, they'll likely let go of their bullish positions right as it turns, then buy their longs back right as the market is about to turn again, that's the turn we are looking for as far as major pivot timing to the downside.

Important Market Update

OK, so I opened 2 call option hedges, I was going to go with weekly expiring this week because I don't think I need a hedge any longer than that, but with time decay and how dead the market was yesterday and even today, I don't want to break the rules that finally turned my option trading around from blowing up an options account to more than doubling it, so I went with next week's expiration (monthly) and as I said these are to hedge puts that have substantial double digit profits already, the positions are small in comparison because they are exceptionally speculative, I just didn't want to risk the Put gains and I don't want to close them and try to open them again at higher volatility (higher cost).

 The IWM Put position, these are the profits I want to protect rather than close the position because of my outlook for the market near term (a transition to the downside)...

 Here's the BIDU Put position and profits there I want to protect without closing the position...this is the function of a hedge.

And as you see, a MUCH smaller QQQ Call position, the hedge, but already at a gain even in this market action.


Truth be told, these are positions that I'm 100% willing to lose completely, that's why they are speculative size.

Now as to the main reason, even though we don't have much in the averages, the VXX needs a larger reversal process, this is what I've been waiting for since last week, I've been patient waiting for certain events to start, they have, now VXX is building as it was expected to do, but it's not the size I expect.

HYG was the final straw, even though this is in a larger trend of distribution and has fallen out, it is probably the #1 most used manipulation lever and despite some deterioration, it's still with a divergence that is more than enough to get algos chasing stocks based only on HYG's price action. This may have been the cheapest way to run this mini-cycle, instead of accumulating in all of the averages and market Industry groups to get a move off, just accumulate in one asset that the algos follow as a move higher in HYG (High Yield Corp. Credit), which is almost exclusively traded by smart money, is seen as a risk on smart money sentiment and algos chase that, thus it's part of the SPY arbitrage, a known lever of manipulation.

Meanwhile VXX is still doing what we need it to do although it just started today which is fine as well.

I'm also going to try to show you the run of charts in the SPY as a few people have asked to see them, this current mini cycle identified Friday afternoon is NOTHING like the positive divergences leading to the February rally which we knew about long ahead of time and predicted it perfectly right up to the start of the rally when everything else in the market was as bearish as you get, again THERE IS NO COMPARISON BETWEEN THEN AND NOW, NOT EVEN CLOSE (we have 1-3 min positives now, we had 30 min positives back then over a period of 2 weeks, not 2-days).

First VXX and HYG...

 VXX has begun accumulating, we look for this and call it a "Constructive pullback", it means it's the kind of pullback we want to buy because as prices pullback they are accumulated rather than in line which means prices are just dropping.

However, VXX is so much more important than the accumulation of a mini cycle as it already has huge accumulation, THIS IS MUCH MORE ABOUT TIMING THE MARKET THAN ANYTHING ELSE AND THAT'S WHAT WE CAME UP WITH FRIDAY AFTERNOON AS WELL.

5 MIN VXX leading positive so there never was any serious trouble here even in the very short term, you can see today it has added to the leading/flying divergence, but as I said earlier, the base or reversal process is too narrow, a few hours isn't enough, I expected at least a full day, so I drew in yellow arrows to give what I would expect to see as a minimum.

Remember though, VXX does not need the accumulation, it's already there, this is just short term timing for a longer term event.

For example...
 The 60 min VXX and UVXY charts have enormous leading positive divergences.

VXX 60 min...so again it's not about accumulation, it's about a timing signal.

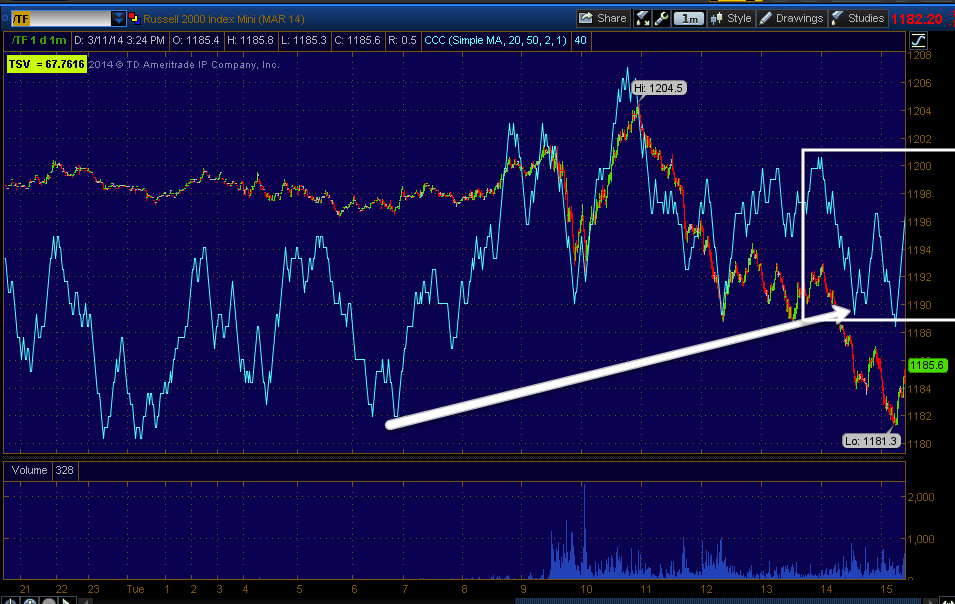
Even if you didn't have 3C, with the short squeeze on the market's Feb. rally, you should be able to tell if was a hollow move simply by comparing VXX to the market (SPY) as I have done below, remember that they usually trade almost mirror opposite of each other.

 The SPY is in blue and VXX green, note the SPY climbing higher after the start around Feb 6/7th , but by the 18th (even before then, but here it is clear), VXX WILL NOT MOVE LOWER, INSTEAD IT IS TRENDING UP, telling you that there's a huge bid in VIX futures as protection because there's real concern among the pros, they know the short squeeze rally was impressive because of a short squeeze, not because of actual accumulation, in fact you'll see on the SPY charts (if you haven't already), that this move was used for distribution which is something we predicted BEFORE the move started, it's a means to an end.

As far as HYG, this is why I took the risk with the calls in IWM and QQQ, I have significant profits in market puts as well as some assets like BIDU and didn't want to close them, but still protect them, the hedge using these calls works perfectly and even if they fail and are worth zero, the gains in the IWM puts and others will far exceed the losses on the smaller call/hedge positions.

 HYG 10 min which is about as far as the HYG positive goes, has a huge negative and by comparison, a smaller positive now, but it is still respectable, even if the averages themselves have no where near this kind of divergence.

Here on HYG's 1 min chart you see the concept of, "New divergences start on the earliest timeframes", the positive above is seeing deterioration and it is showing up on the earliest or fastest timeframe first. You can also see why this was part of Friday's analysis for this week as we could identify a positive forming as early as late Friday afternoon, also note the head fake move, you don't usually think of it as that, but that's a stop run.

As far as the best we have in market divergences, probably the Q's and IWM, although I'll show the SPY too, just in it's own group of multiple timeframes.


QQQ
 This 1 min positive is not big, this is today only, intraday!

 This QQQ 2 min positive is just about as big as it gets, but note the leading negative action that drew price lower earlier today, that should tell you something about how weak this market actually is.

IWM-probably the best divergences are here... (positive)
 Again the 1 min or intraday is not impressive at all.

 The 2 min IWM has been leading negative in 3C and price has been following, however, note that we can see a positive divegrence late Friday afternoon, this is why I was spending so much time looking for the divergence after the market options expiration max pain pin was over after 2 pm on Friday, to see where the market would pick up this week and what the most probable course was.

You can see the divegrence has built since then, it is a relative positive which is the weaker form and it is within a larger leading negative which is not only the stronger form, but also much bigger, however it is this exact dynamic and multiple timeframe analysis that creates bounces within a trend which is essential information to have for trading trends.


Now the IWM 5 min shows just HOW WEAK THE MARKET IS AND HOW SMALL THIS MINI-CYCLE IS, IT CAN'T EVEN REACH THE 5 MIN CHART AND THIS IS WHY HEDGING POSITIONS WERE SO SMALL.

As for the SPY's short term and multiple timeframe trends as I promised...
 Again the SPY 1 min at the time of capture about 30 mins ago, not impressive by any means.

The SPY 2 min, nothing positive at all anymore, it was the worst since Friday any way, in fact there's more of a negative/bearish short term case made if you look at the SPY alone, but we never look at 1 asset alone, we look at as many things as we can and find probabilities.

The SPY 3 min chart shows the accumulation that we saw the Monday BEFORE Putin's peace overtures that sent the market gapping higher, since then though, look at the 3C action and the fact it is in a flat range is important as we see divergences VERY often in flat ranges, I think it has to do with filling orders at an average price like VWAP.

 As you can see, there's NOTHING in the short term SPY that is positive or useful , HYG is much more useful.

There are however somethings in QQQ and especially IWM, which is why I opened the calls in those two assets.

 At 10 mins SPY is leading negative.

 15 min SPY, nothing resembling accumulation at all.

The 30 min SPY shows the Feb. rally to the right, look at the distribution in 3C, this is what I expected and posted BEFORE the rally even started, before anyone else knew a rally was coming and this is the confirmation I needed to see to validate my trend analysis, in other words that this rally wasn't an end, but the means to an end, setting up the next trend down which is larger and more important.

 The 60 min chart shows the accumulation that told us there was a rally coming, we even called the 2% drop or head fake move that comes right after the 1 week range of accumulation in the white box to the far left. Then we confirmed the head fake as price moved lower and we saw accumulation (the second white box or one to the right, this is how we were able to not only predict the rally in advance, but that it would be VERY strong, however the overall position of 3C told us that it was being used to facilitate the start of a larger downtrend just as the head fake move lower in early Feb. told us that it would be used to make the rally happen as it set a bear trap that caused panic and short covering.

 This is the ,multi-hour chart, this tells us the long term probabilities and that any rally higher that we expect is not going to be a bull trend, but part of a trap as this is the higher probability and a VERY clear one at that, leading negative 4 HOUR!!!

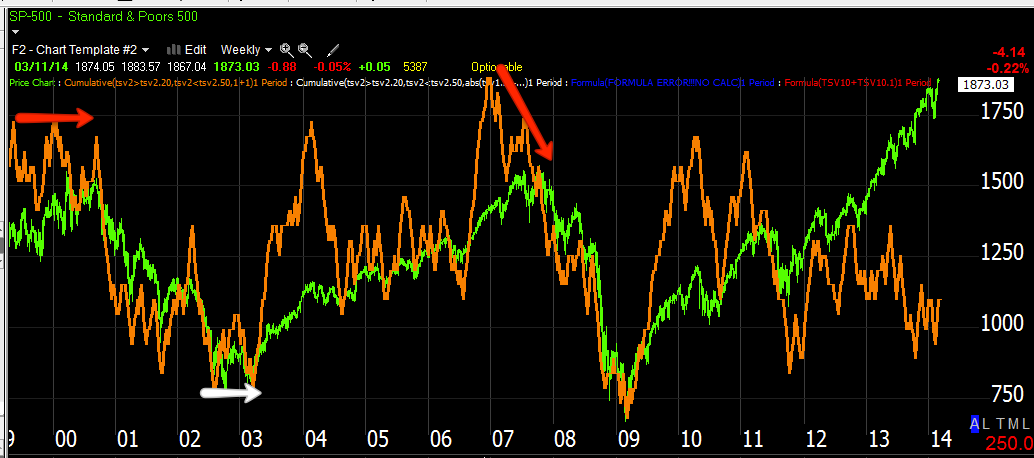
What's worse and tells us the most, the 5-day SPY chart, you can see the negative divegrence at the top of the 2000 Dot.com bubble, accumulation at the 2002/2003 lows, distribution at the 2007 top and the current distribution is worse than anything we have seen. no where else on this chart do you see price naked without 3C confirmation, the leading negative here is the most insane I've ever seen.

Do you remember my chart of the Dow now vs. 1929? It is FAR WORSE NOW.

Hedge Ideas....

I know there's a lot of back and forth, I'm looking at HYG which I'll post for you and I can't see how this move doesn't make a larger move to the upside, not anything larger than expected Friday, but it has been pathetic so far.

I have April IWM puts at a 30+% gain and April BIDU puts at a 40+% gain and I do NOT want to take those off the table considering where I think we are, but I do want to hedge them and the gains.

I'm going to do that with some QQQ/IWM calls ($90 and $118 respectively), I was going to go for this week (Friday expiration) and truthfully that would probably be fine, but I have always gone with at least 2x more time than I think I need and there's enough liquidity in the Monthly 21st to make sure I get a fill.

THESE ARE HIGHLY SPECULATIVE POSITIONS AND WILL BE 1/3RD THE SIZE OF A NROMAL OPTIONS POSITION, TOGETHER THEY'LL BE 2/3RDS THE SIZE OF 1 OPTIONS POSITION AND THEY ARE HEDGING ABOUT 5 OR 6.

I'll have some charts up in just a few minutes, HYG is the asset I can't ignore so instead of taking Put profits now in positions I think will do much better and then having to re-enter them on increased volatility, I'm just using these two (QQQ/IWM) calls to hedge the gains there.

Intraday Futures

I'm not sure if these are telling us we have more time as originally expected (and the reason for more time is a stronger VXX / UVXY positive divergence , a clearer picture of a market pivot/reversal point and time to allow new positions to form to get the best entry at the pivot with the least risk) or if this is maybe the "W" process in VXX being put together as mentioned just a few minutes ago, the market would need to bounce intraday to do that.

 ES futures (SPX) seeing highs distributed this morning, but we do have some positives at the lows, remember, these are only 1 min intraday charts.

 NQ/NASDAQ 100 futures are also seeing positive divergences in futures at the lows, again this is what would be needed for the VXX to form a wider "W" reversal process.

 And the same in TF or R2K Futures., the lows have a positive divergence that should send the market averages up off these lows allowing VXX to widen out that reversal process which is a much better scenario.

However, at the same time the VIX Futures (the real ones, not derivatives or spot) are seeing positive divergences like we wanted to see, like we started to see earlier in a natural process, it has just accelerated.

The point I'm making is that it is accumulating as we wanted to see regardless of what the market is doing as they usually have an inverse relationship so this is what we expected to see late Friday when looking at the charts and since then.