Monday, August 29, 2011

KCG Trade Management

KCG was a long trade entered on August 5th @ $11.45

This is an excellent example of why I invented and use my Trend Channel for stops. The trade is now up nearly 14% and even though it got a little volatile, the Trend Channel held the trade as it is coded to account for each stock' particular volatility.

 Here's the entry date...

And here's the entry with the Trend Channel, not once did KCG close under the bottom channel, which would be a stop out and it got a bit volatile there for awhile.

Even my custom crossover screen stayed long the trade and it was one of the man reasons behind the trade.
The moving averages of price stayed long, my custom indicator in the middle window stayed long and RSI stayed long.

I would leave this one in the Trend Channel and see what else it has in store for you.

VHC Long Trade Follow Up

VHC was a trade idea from Friday 8/26 @ $21.95 VHC is at an 8.3% profit in a day. Make sure you take a look at the trade idea if you took the trade or if you are considering it, once it breaks out of the flag, we'll watch for targets.

PMT Follow Up

PMT gave us a very good high probability/low risk entry on Friday, 8/26


Today PMT broke out.

 Trade date with good risk/reward characteristics.

 Another outstanding daily leading positive divergence

 Here's the pullback inside the triangle and accumulation that started up again bringing this trade to my attention.

This is a possible stop, but again, with that kind of daily chart, I want to give this trade as much room as possible to overcome any short term volatility.

SRS was also adressed in the same post, if you went short SRS Friday, congratulations, that's a nice 1 day gain.

MCRL LONG TRADE FOLLOW UP

MCRL was a long idea on August 23rd @ $9.62. I've also updated the idea since then.

Right now MCRL s at a gain of 6+%, but I think it has more to offer in the coming days and weeks.

 Here's the trade date with another trade late last week on a pullback intraday.

 The daily chart is showing very strong positive accumulation through a strong leading divergence, that's why I feel this trade is just getting started.

On initial new trades and in a market environment like this, I try to give these trades as much room as possible initially until they start to move up in a trend, then I'd use the Trend Channel and tighten the stop. There's nothing wrong with adding to a trade that is working for you.


VXX Short Swing Trade Follow Up

Here's the original idea posted last Wednesday, August 24 @ $41.29

Today the trade is up nearly 7%, but the premise of the trade was to use options so if anyone took this trade using options, let me know how you are doing.

 The premise of this trade is that the daily 3C chart has ht a negative divergence and the VXX should see a significant swing lower over the coming weeks. Remember the VXX trades inversely to the market or the S&P-500 so that gives you some idea of where I think the market s going, although you probably are pretty well aware of that by now.

 Here's the trade idea/entry

 The 60 min chart would imply that we have quite a bit more downside, however as an options trade, I would NOT hold this until expiration.

 I have said several times today that I feel the market may be down tomorrow, that would serve as a head fake as it would take the bullish triangle and make today's breakout look like a failed pattern and technical traders are taught to go short on a failed bullish pattern.

Here's the daily Trend Channel stop around $42.50, but even if it were to hit $42.50 on a close, I would consider leaving the position open so long as there's a 3C negative divergence, a head fake has to be convincing! Also I'd keep an eye on ADX to turn lower from the 54 level, that would be another strong indication that VXX's uptrend has run its course.

APKT Follow Up

APKT was a long idea on Friday August 26 at $44.36

Today the trade is up 8% in one day.

 Here's the trade date...

 The 60 min chart is in a positive leading divergence so I think over the days to come, there will be significantly more upside.

 Nice confirmation on the 1 min chart today.

 Here are some Trend Channel stops, this one is a bit tighter...

And this is a bit looser, but will still keep you in the green. Contact me anytime for updated stops.

Short Covering....

Remember this post? What to Expect

I think we are now getting what I thought we'd get back when I published this idea on August 17th.

 This white trend line was the hurdle to start short covering...

This looks somewhat like there's some short covering in the mix, no major intraday pullbacks... I think we've hit the target for short overing to start.

SLV Update

SLV has seen some accumulation today... I wouldn't be surprised to see some upside tomorrow in the a.m. and maybe beyond if the divergence keeps up.

Financials Closing Update

XLF 5 min, I wouldn't be surprised to see some pressure on financials tomorrow on the open, we'll have to see what 3C looks like at the close today.

Closing Energy Update

XLE 1 min

MARKET UPDATE

Even with the new changes n the FXE, they haven't been confirmed yet and are not on the 5 min chart yet. I still think we are going to see some selling pressure in to the close n the majors.

 DIA 1 min

 IWM 1 min

 QQQ 1 min

SPY 1 min

The Dollar

The movement of the dollar had a lot to do with our expectations n energy as well as equities, earlier it seemed pretty cemented that it was going to move higher, but there's been a development with the Euro you should be aware of.
Pretty much after my last update today on the dollar/Euro the Euro started showing 1 min accumulation, this may build in to the 5 min chart and then expectations will be very different. Remember, if the Euro moves up and we are seeing signs of accumulation, that accounts for 50% of the Dollar Index which would mean the dollar would move lower and all of the correlations like oil and equities would be in a different light. A VERY interesting move today.

HOV long Update

Last Wednesday, the 24th  posted Trade Idea HOV Part 2 (long) this was our second so far successful trade in HOV, thus far up 18.5% and well over 22% intraday today.

 Here's our second long trade entry in HOV.

 The 30 min chart which contributed to the long call, note the head fake in red and the negative divergence at the HF, then accumulation and our long on the 24th.

 The 15 min chart was part of the call too, as it went positive with accumulation.

 The 1 min chart is showing some profit taking here, since this is a 20% gain in 3 days, I would trail a stop behind it for at least partial profits.


Here's the 30 min trend channel and even though we have a 6.4% move today, I would still keep some trailing stop on this trade. Right now the TC is around $1.62, but it will move up with any additional gains, feel free to email me for stop updates.


RIMM Update

RIMM is doing exactly what has been expected for weeks now, here's one of the last updates that puts the RIMM expectations in a nutshell. This is an update from 8/24 that shows the big picture and even calls for a pullback which we saw the next day.

 RMM daily range, note the positive divergence on the head fake below the range in the yellow box- this is how predictable technical traders are and how predictable t makes Wall Street's response.

 We are now exactly where 3C has said RIMM would be for weeks now, I expect there to ultimately be more upside, see the link above for the full outlook.

 10 min chart in confirmation of the trend.

 So is the 5 min chart.

The 1 min chart even caught the gap up that pulled back and then look at the accumulation.

I think the RIMM trade is an example of 3C's predictive power as RIMM has done exactly what we have expected for weeks now!

SPY/Market Update

The last few weeks, since August 8th, have been some of the most stressful weeks of my trading career, at least on WOWS. There have been odds stacked as high as you can see against 3C's position that the market was going to see more upside. There were constant threats that the market would head lower. Everything in the media and analysis from Wall Street has said the FOMC meeting would send the market lower, the Jackson Hole speech would send the market lower and when it comes to emotions, I wanted to give in to these and just say, get short, the market is going lower, it was the obvious call, but it was not what 3C has been showing and I've answered a lot of emails from people feeling the same way, "How can 3C say this, look at Europe, look at the US, look at the Fed?". The only thing I can say and the only comfort I've had is trust and faith in 3C for this isn't the first time it's made a call that seemed way out of whack with the market, however it came through for me. So it's been a tough time.

However, look at these charts.... I and we can see underlying action, but we can't predict the future or how that underlying action will play out. Certainly 3C saved many of you money had you gone short or used PUTS. Even the barrage of bad news today hasn't sent the market lower and as I always say, "once Wall Street sets up the chessboard the way they want it and run a cycle, there's little that will stop them"

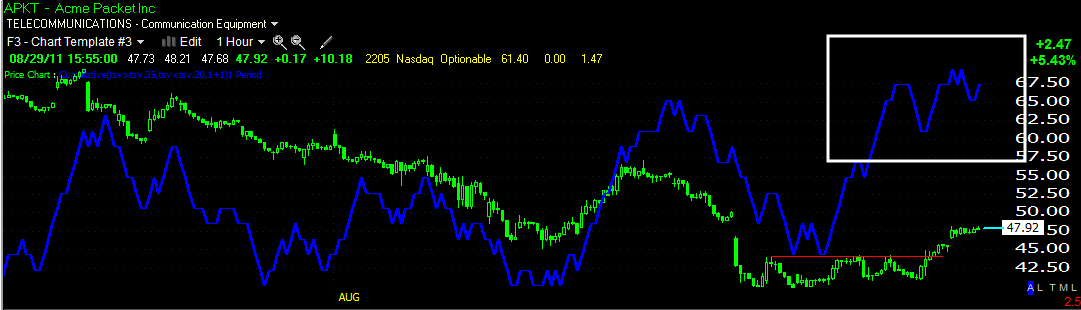
 Here's the triangle we saw last night, I thought we'd probably see a head fake down first before a move up, but we have sen a move up. There may still be a head fake, perhaps a move that throws the breakout in to question, but ultimately, this was the longer term action I've been saying 3C has been showing us for weeks now, and here we are.

 The hourly chart is better then in line, so I expect the intermediate move up, even if it sees a few days down and some doubt, will continue.

 The 30 min hart is catching up fast to in line status.

 This 15 min chart is still warning of a Wall Street head fake/game

 The 10 min hart is jumping in line

 As is the 5 min, although it' still lagging today

And the 1 min chart is lagging.

So head fake, perhaps it won't be to the downside, but what 3 has been telling us to expect, against all the odds, is playing out right here and now.

DUST Update

 DUST daily showing a relative positive divergence

 DUST hourly in a leading positive divergence

 DUST 30 mins shows some more of the trend's details, with two positive divergences recently.

 Here's the short term outlook, notice two head fakes both in red boxes with negative divergences-they are just that common, however even the 10 min chart is now turning up in to a leading positive divergence.

The 1 min chart shows the same...

Unfortunately I won't be able to update the trading system until after the close, but DUST does look like it is accumulating for a mov higher.