Monday, August 3, 2015

A.M. Update

Good Morning,

Again as a reminder, we will be transitioning to the new website at www.Wolf-on-WalStreet.com TODAY. This first post is just a reminder.

I hope everyone had a fantastic weekend.

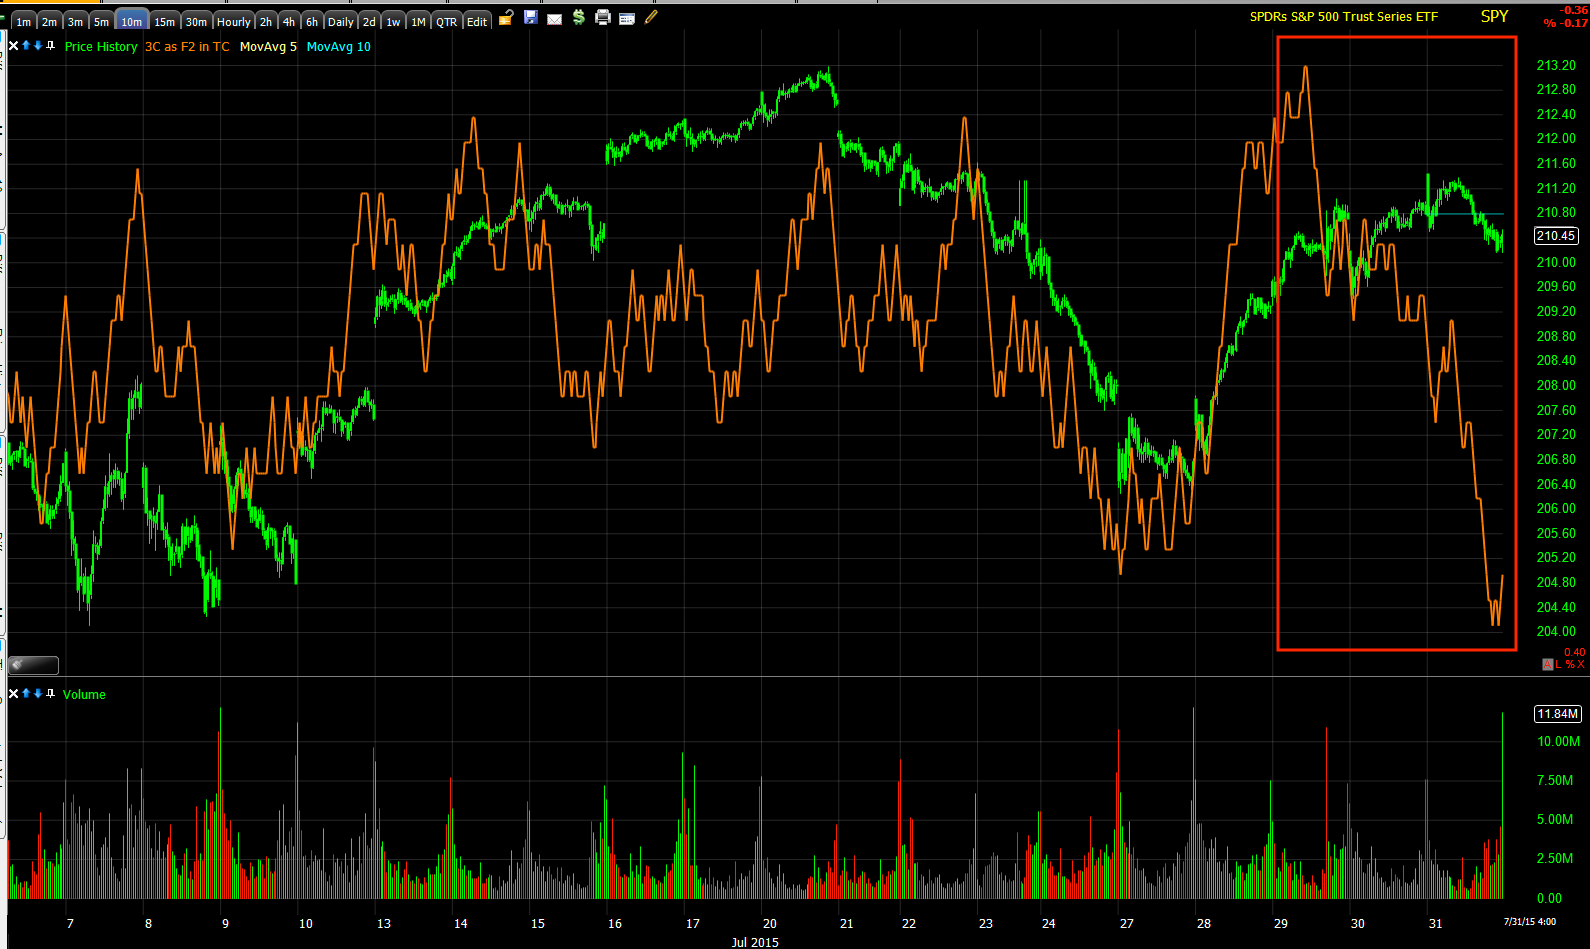
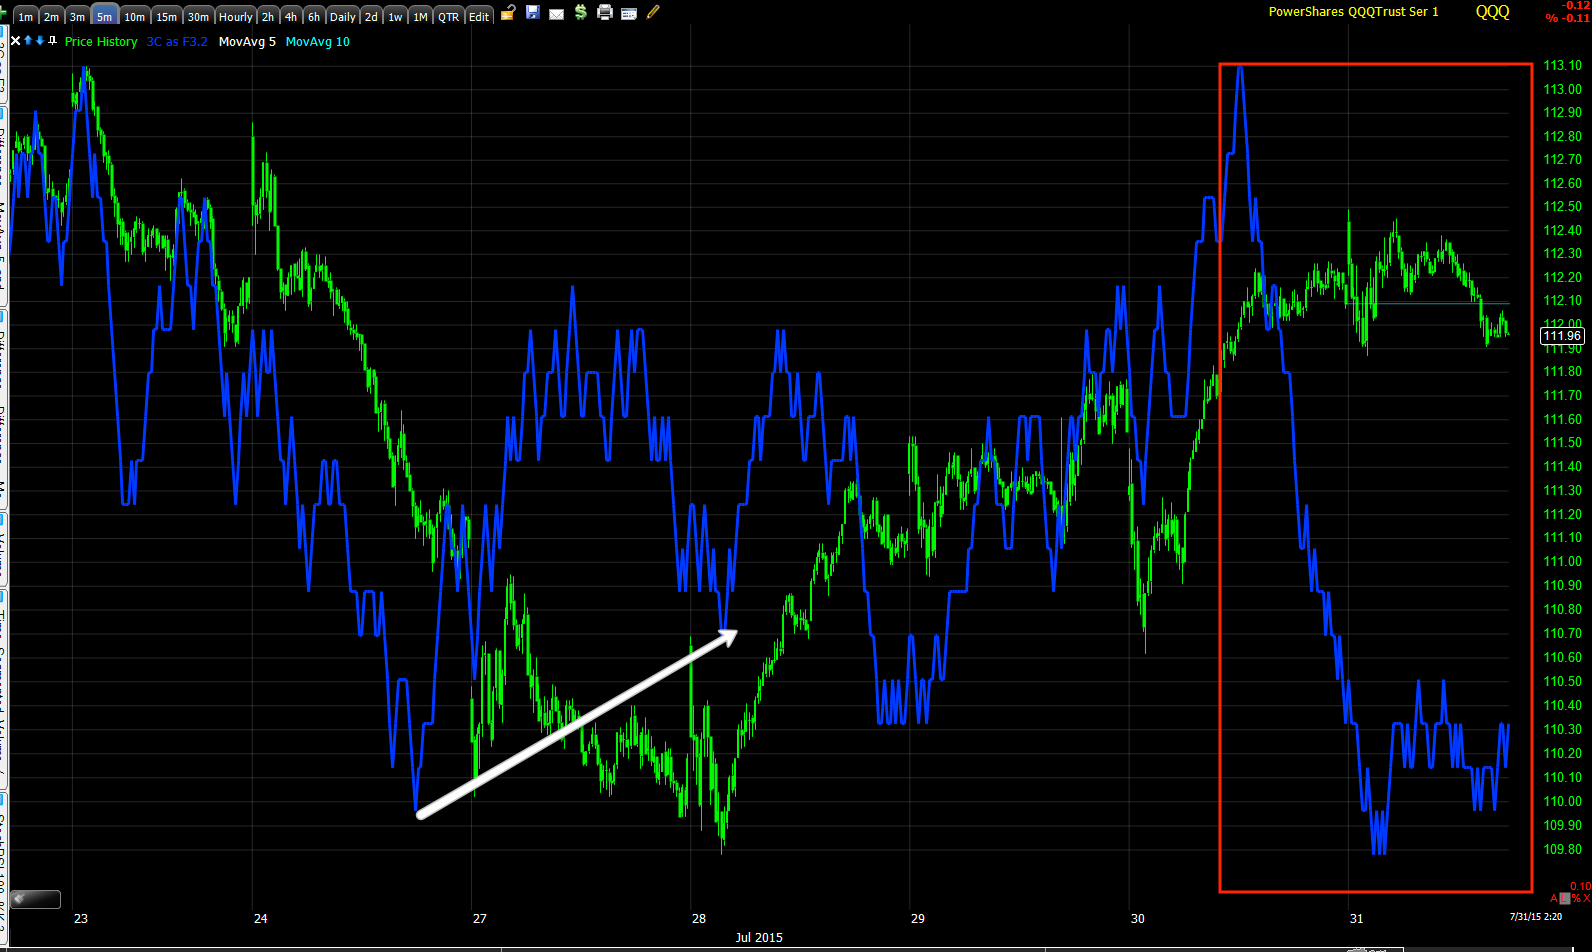
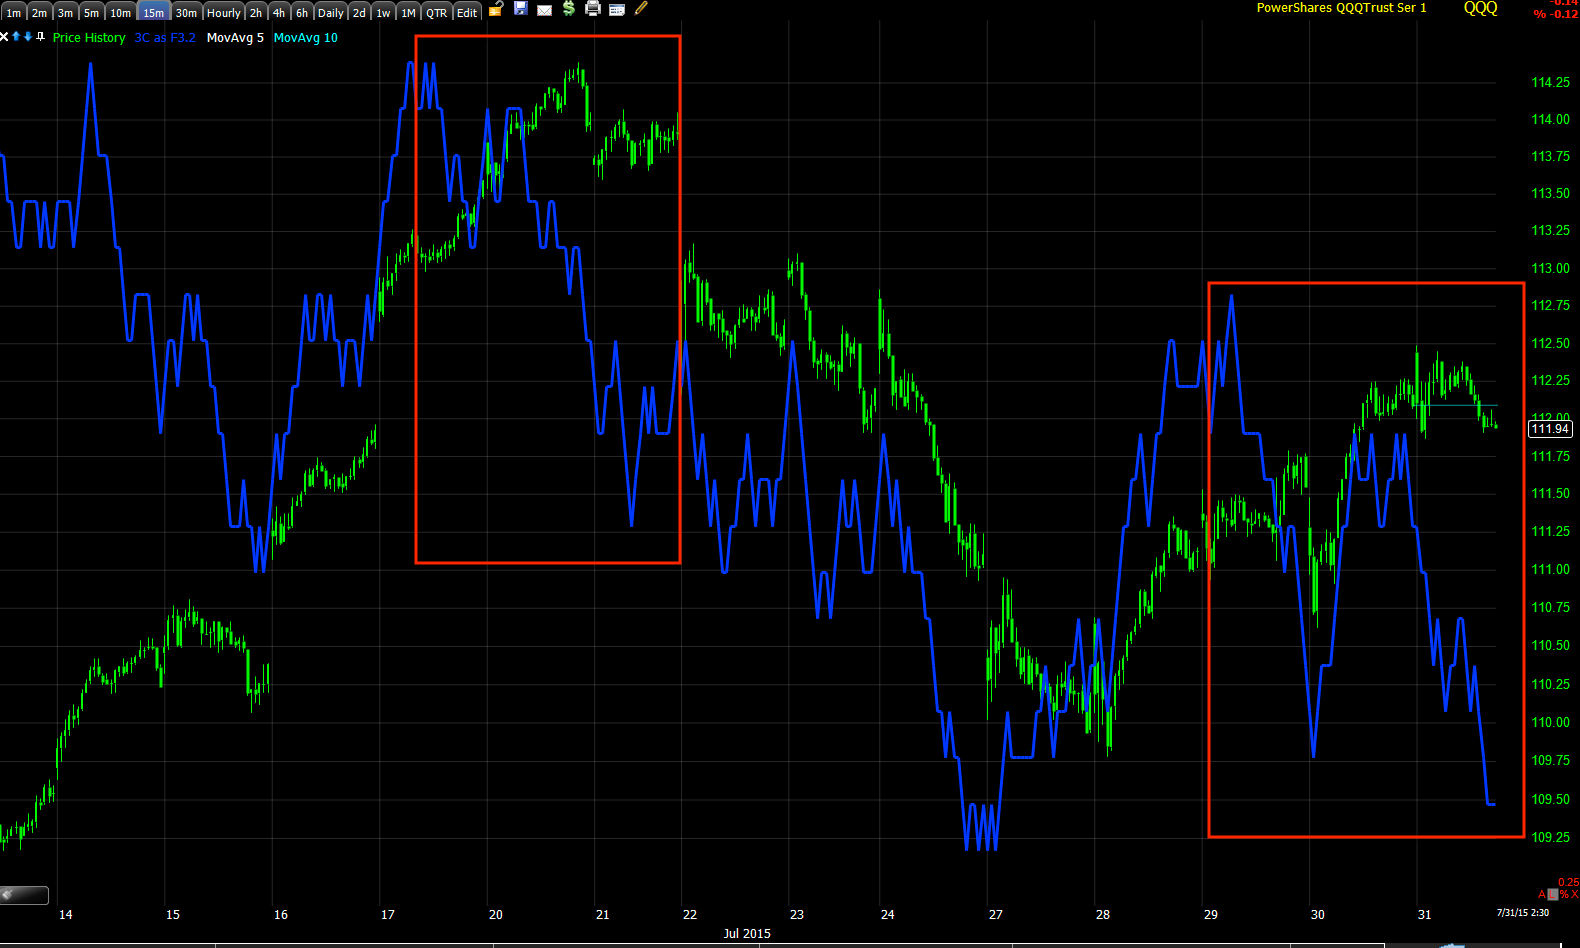
Last Friday in the "Week Ahead" post, the charts look horrible, what I'd call jumping off the screen or "screaming", the kind of divergences that I don't ignore. However I also said in the second sentence,

"My best guess would be that we see a head fake move early in the week, likely Monday, but this is almost exclusively based on concept, but a strong concept."

I'll get a bit more in to this below, but it's really about how obvious the market is at times , how many traders are leaning to one side of the boat and how Wall Street does all it can to make the most number of traders wrong at any one given time as a general rule of thumb.

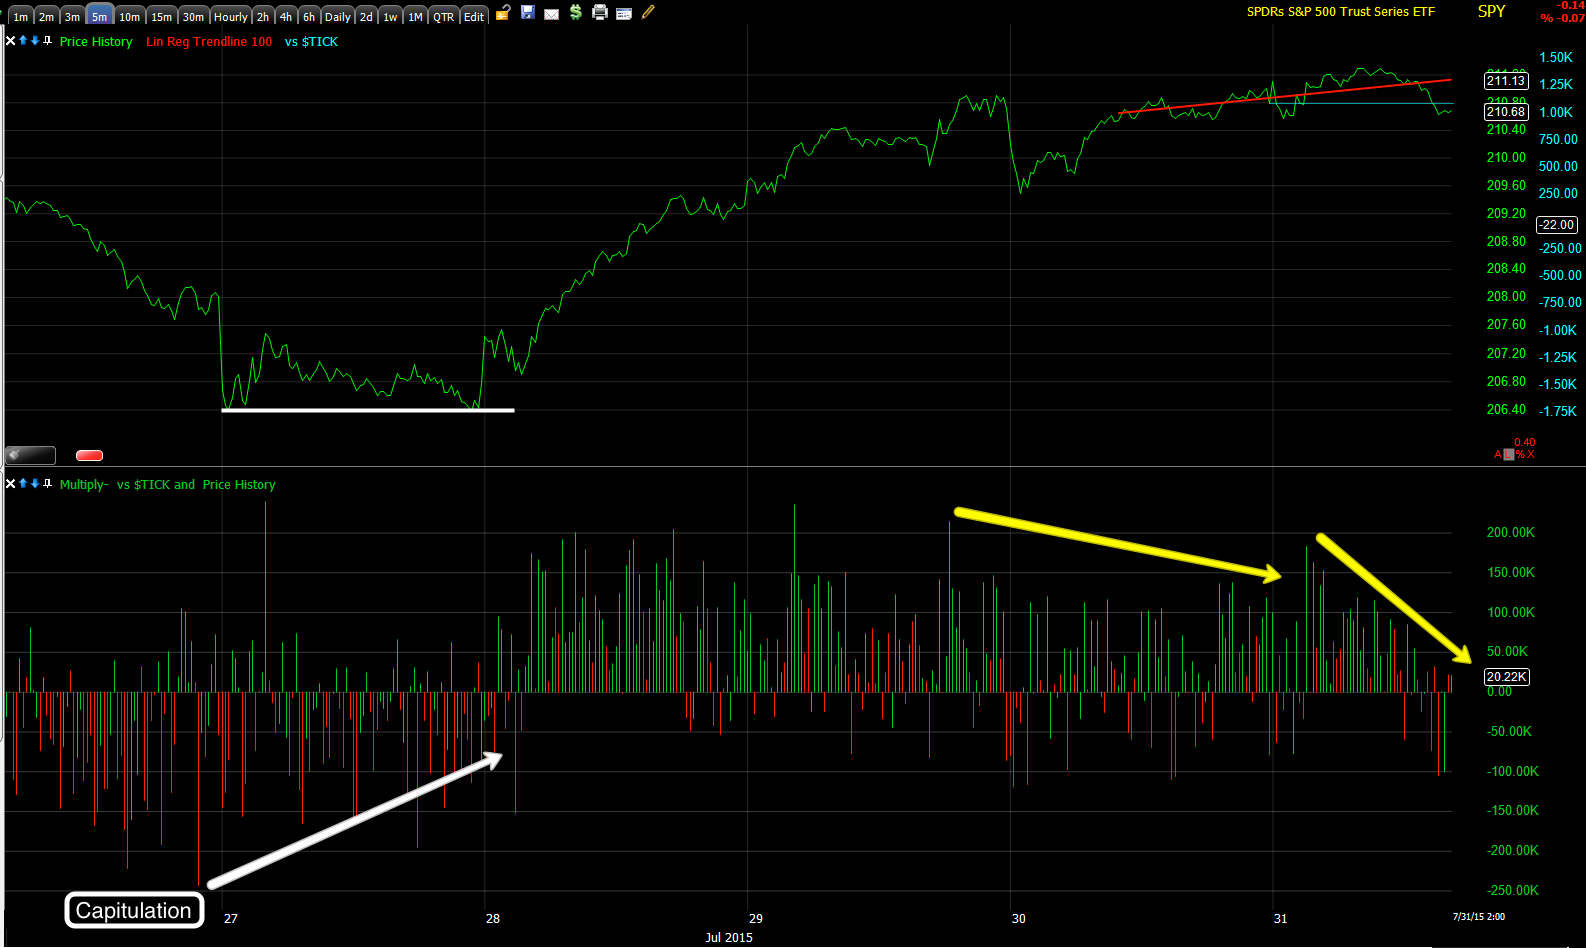
Honestly seeing this morning's Bank of America sentiment research that put the ratings of sell side analysts at a bullish factor of 52 for the 4th consecutive month reminds me of the contrarian bearish levels from the October lows when I had said something like a monster rally was coming.  A reading of 52, which is taken as a measure of sell side analysts opinion on the last trading day of the month is still overall bullish, but well below the long run 60-65% and acts as a contrarian indicator.

As I said on Friday about the Week ahead (excerpt above), the idea that we see some early price strength this week is almost entirely based on concept, not a contrarian indicator like that of BofA's above because I didn't even see that until this morning, but a similar contrarian concept that we've seen many times over in price patterns, the Igloo/Chimney top that finishes a cycle before transitioning to the final stage of a cycle, stage 4 decline.

It's a lot easier to see on charts...
 This is the 5 min S&P futures' (ES) 5 min chart which has seen the indicator diverge from price to the downside. This is a prerequisite for me to open any short position as not only price has lost upside momentum, but you can see why as the underlying trade has seen selling through the bounce.

 The 10 min chart which shows 3C in line with ES as it declined off the 7/10 bounce to the left side of the chart is price confirmation, but again to the right at last week's bounce, you can see the indicator clearly not following along and negatively diverging which is what I want to see.

However the entire concept behind the excerpt above from Friday's Week Ahead is based entirely on concept...what is easy to see is usually going to be turned on its side or the "Head Fake" a false move that isn't intended to hold, but throw traders off.

Looking at the same chart as above with some of my fantastic drawing, this is what I meant in saying,


"My best guess would be that we see a head fake move early in the week, likely Monday, but this is almost exclusively based on concept, but a strong concept."

The loss of momentum on last week's bounce as there was distribution in to it caused a rounding top that looks pretty obvious as to which direction it's heading, this is where we most often see a head fake and I generally estimate that to be about 80% of the time before a price reversal whether it's a reversal from a downtrend to up or here, a bounce to down.

That's why we have the concept, based on observation, of a price top called an "Igloo with a Chimney". The rounding portion you see above being the Igloo and a vertical pop in price that exceeds the highs of the Igloo forming a chimney, usually a quick move as the powers that be just need to get traders to move, to get shorts to cover or longs to chase price which gives them an opportunity to sell or short in to those higher prices/demand and then the reversal to the downside finishing the structure.

That's what I meant in last week's "Week Ahead" post.

As for the rest of the world, it's like "Second verse same as the first". China is still unable to close green, commodities all around have been hit pretty hard as a result of the Chinese economy, and Europe is just as broken as ever with the Greek stock market opening today after a 1-month closure to a bloodbath with a opening that dropped -22% right off the bat with bank stocks going limit down at -30%, the last I saw it had pared some losses and was down around -16%.

As for the market this week, the "Week Ahead" was strictly my "Gut" feeling based on concept, but as you know I like objective evidence before taking any action so we'll do as we always do and let the charts guide us, but I can't say I'd be upset with a pop higher early in the week as bad as the overall charts look, that's opportunity.

I'll see you in a few minutes. remember at the new website, www.Wolf-on-WallStreet.com

If you have any questions or issues, please send emails to Support@Wolf-on-WallStreet.com

Sunday, August 2, 2015

*NEW WEBSITE INFORMATION-Going Live Monday*

Hey everyone, Andrea and I just got back from celebrating her birthday this weekend and the first thing I did (other than a quick shower), was come here to say THANK YOU. She had so many birthday wishes from so many of you and those that were sent to me,  I forwarded them to her . She read everyone , but would never be able to respond to all of them, so one big thank you for helping me make this a very special birthday weekend as she's worked so hard for me and all of us to get the new website up and running and we'll be adding more feature as we move forward.

Speaking of the new website, as I mentioned Friday, so long as everything went ok with Friday's test (and we only had one issue which was pretty easy to clear up), we'd be transitioning to the new website at www.Wolf-on-WallStreet.com  on Monday. I realize we have members across the world so tomorrow the first several posts I'll also put on the Blogspot (former) website as a reminder and so you don't miss anything.

If you have any questions about the new website, changing your password, changing your email delivery content preferences or any other questions, concerns or suggestions, please feel free to email them to Support@Wolf-onWallStreet.com

I'll still be taking emails at my email as always, but for anything website related, please use the email above.

Thank you all for hanging in their with the testing, duplicate emails, transition process, etc. I really think this is a much better platform with much more ability to expand new services and if you have written in about ideas to better the site, don't worry, I haven't forgotten any of them and have them all in a folder so we can look at the feasibility and the best way to implement suggestion/ideas, etc.

So once again,  as of tomorrow morning we'll be at our new home linked above, you'll still have the same real time email delivery and the ability to choose specific categories of post types you may want emailed.

I'm going to recover a bit from a fantastic weekend and get ready for the new week I hope you all had the same.

Friday, July 31, 2015

Quick Daily Wrap

As I mentioned before, this weekend is Andrea's birthday and I have "things to do", you guys know what I mean!

Just so I don't feel rushed or leave any question marks, I wanted to be clear again on the Week Ahead and this week. Last Friday's Week Ahead had two options, both were a bounce starting early in the week, the correct one was that we'd see a little more base building early in the week and bounce from there.

I showed quite a few charts that I specifically called out this morning as being on my watch list, they were the timeframes and averages that needed to move, otherwise while we are still in distribution, the reversal process was not at the tail end and boy did they move today, just see the posts today and the The Week Ahead that touched on the 3 key charts. It wasn't just the averages, but Index futures too.

How can I honestly look at a chart like this and not be bearish on the market going in to next week?

 IWM 10m

QQQ 15m

SPY 10

A lot of those divergences are worse than the last top from the larger 7/10 bounce.

ES 30 min, again worse than the last bounce at the time of the top.

These have always been the charts I'd describe as "screaming" or jumping off the screen, the charts that I don't ignore.

After looking at a lot of charts and knowing the probabilities of certain concepts like a head fake move just before a change in trend (down), I felt pretty strongly that there is a good chance of a head fake move early next week which is where I'd want to add any option positions and/or additional shorts.

However as far as actual evidence beyond a gut feeling and the probability of our concepts, this is the best I have right now suggesting any kind of head fake which relies on the principle of 3C charts picking up where they left off.

 Only the intraday 1 min QQQ ended with such a chart.

The IWM did not.

The SPY did not.

So if we get that head fake move, I'll count it as a blessing, if not, then at least we picked up some additional exposure that should work very well for us. As I mentioned last night, I don't think many people appreciate how close we are to a very significant change in psychology.

If our 3C charts and breadth charts weren't enough, additionally toward the close Bullard, the St. Louis F_E_D President who always moves the market both up and down made it pretty clear today that September was still VERY much on the table, "In good shape for  September hike". All of those early gains on the Employment Cost Index were just nullified by Jim Bullard and I doubt it's an accident as every major divergence we have seen in advance over the last year, Jim Bullard has been the pin-point catalyst for the reversal to the day.

As for all of our 3C charts, breadth charts, futures charts... you may be wondering who is selling if equities are still largely above their 200 day in a big flat range. First I'd remind you that all of our concepts are fractal and just like the flat ranges of the last several bounces indicating stage 3, put the market in to context and expand the fractal...

 The flat range through 2015...Daily SPX

The stages of a cycle with 1 =Accumulation; 2= Mark-up, 2a= the peeling away from the trend line or the warning that a change in character has occurred that leads to a change in trend. "2b" a significant change in character and 3 -top/distribution . The 3C chart should confirm...

SPY 5 day with a large positive divergence at #1 in line. Around #2 and leading negative divergence in to the change of character and trend change to flat from up, no different than any of the bounce cycles.

Almost every night the past several weeks I've included breadth charts that prove beyond any doubt that more stocks are moving lower, now we have additional color on the charts above and breadth charts from ValueWalk:


"After a slow first quarter of 2015, the private equity industry experienced a revitalization in Q2-2015. Investment dipped by less than 1 percent to $112 billion, holding strong at the second highest Q2 level since 2007. Meanwhile, fundraising fell to $30 billion. Exit volume exploded last quarter to $125 billion—the highest level on record."

See the full article at the link above, but everything we have been documenting is right there, Private Equity, some of the "smartest" money in the room has left the market at record levels.

So am I okay with a head fake move if it comes next week? Darn right, I'd look forward to it, otherwise I think we've been putting together good positions that will see us well in the months and years ahead.

For now, I'm going to try to serve my significant other well on her birthday. Thank you so much for all the birthday wishes you sent to Andrea at the post she has been manning , the Support@Wolf-onWallStreet.com email to deal with any issues that might have come up with regard to the new website which she worked tirelessly to get online for us. By the way, her Birthday is Monday so if you'd like to send an email, feel free (no pressure).

I'll post our transition date for the new website at www.Wolf-onWallStreet.com , it should be Monday unless anyone had any significant problems over the last 2-days of testing, if so, please let us know at the Support@Wolf-onWallStreet.com email.

Again look for that email this weekend, but as of now we are looking at Monday for a transition date.

Have a Fantastic weekend....


The Week Ahead

I'll have to make this quick, but I think I pretty much elaborated on what my views were which were mostly based on real chart data, some gut feeling and some concept.

My best guess would be that we see a head fake move early in the week, likely Monday, but this is almost exclusively based on concept, but a strong concept.

The only chart that really backs it is also the concept of 3C charts picking up where they left off and as we get closer to the close, I don't even have any really great examples of that. The other issue nagging me is leading indicators.

However there's some very ugly charts and these are just the kind of charts that are "screaming", the kind I don't ignore and if we do get a head fake move early next week, I'll gladly add additional positions and the options positions then.

Otherwise, I want to have some more positions in place as these are just plain ugly.


 QQQ 15 min-one of the charts I was looking for movement in today and we certainly got it.

 SPY 10 min is another leading at a new negative low, so am I concerned with a head fake move if we get one early next week? You look at the chart and tell me.

And IWM 10 min is just a disaster. I can't ignore charts like this and we have good confirmation in index futures.

If we do get a bounce or a head fake early next week, I'd be looking to use the price strength to enter additional options positions at full size, otherwise most of today just wasn't a great set up for them.

We have a pretty decent set of core shorts and select longs in place, I added a couple late this week and I have no problem adding a few more. 

The bottom line is I don't see any way that we can go in to next week with charts like the ones above and not see the downside event that I've been expecting, remember what I said yesterday...we are not far off from a major psychological change and the market is more about perception than anything else.


More to follow after the close. Thanks you for all the kind birthday wishes you sent Andrea at Support@Wolf-on-WallStreet.com today, she's really excited to be part of the group!

Quick USO Update

I'm simply going to go back to exactly what I said on Tuesday in USO/Oil quick Update and the reiteration of that yesterday in USO Update and that was,

"This doesn't look like a wide enough base for a true upside trend reversal, but it may be the first rally/bounce in forming a larger "W" type base area."

The gist of the charts after a quick look supports that same view I had Tuesday today. I'll try to cover USO charts in more depth, this wouldn't be my add to area as of yet as we have a reversal process and confirmation we must make sure are in place, but that's the gist of what was expected and basically what we have today. We're even seeing volume increase today on the stop run which should be a confirmed head fake early next week.

Trade Idea: SPY Short (SPXU Long)

I've kind of been leaning toward the SPY today as one of my favorite positions so I don't have any out there. I like the way the ES charts look:
 5 min ES which is the prerequisite for any trade (my own rule) which has developed nicely this week.

 ES 10 min with a nice leading negative divergence. Honestly I'm thinking bigger picture here so if we were to get a more defined head fake move like the yellow box/green arrow, I really don't think that it's going to change the 3C chart for the better, actually for the worse so I'm prepared to sit and wait that out, I'd be looking at establishing put positions in to any such move, but if I'm wrong and this "too obvious" looking price pattern just fails early next week, I want to have the exposure, otherwise, I can survive a head fake move so I'll likely leave just a little room to act as a wider stop buffer and/or an add to buffer.

 ES 30 min with a negative divergence that is just as bad as the previous one.

And the 60 min negatives as each bounce is sold in to as seen in breadth charts declining to worse and worse readings.

 The SPY 10 min chart I was looking to today to make some moves certainly moved. I've looked at charts like this a hundred times and said, "THIS IS THE KIND OF DIVERGENCE I DON'T IGNORE", why start now?

As for SPXU
 The 1 min intraday chart is flying which is typically a good timing signal.

Contrasting it's inverse, 10 min UPRO (3x long SPY), there's a lot of damage on that chart.

And SPXU leading positive.

I just can't ignore these divergences, head fake or not, it's just worth it to me.

Leading Indicators Update

This will be brief. There are a lot of leading indicators that are close to in line, for instance one example would be HYG which is clearly seeing distribution and I doubt it's going to be of much use to the market next week as it was this week (if you saw the last post, then you saw the early warning HYG's 3C charts give).

HYG in blue vs SPX in green. The turn to the downside and red on the day is a good development for the market ending this bounce, but look at the overall price pattern and top area reversal, it just looks to clean to me, too obvious and rather than HYG leading the market to the downside, it's confirming it, and that's not why we call it a Leading Indicator.

My feeling at the moment is that there has been plenty of damage done, enough to take the market lower, but as I was saying yesterday, as I always say at a pivot/reversal point, a head fake move is typically an 80+% probability and this doesn't look like one, it looks too clean.

If I had to guess, I'd say Monday we get the head fake move, HYG leads to the downside as it should and that's where the best entries should be, but I'll be looking at charts and possible trades in to the close and may open some partial positions or full positions depending on the charts. However that nagging feeling has been telling me since yesterday, "Hold on, let this really make itself obvious to you", in which case it wouldn't be very obvious to anyone else who's not running our indicators. This looks too obvious.

That's all subject to change if the charts really move in the 45 minutes.

Broad Market Update

So it's been challenging to sit still today if you saw some of the charts I've seen and I don't think I'd blame anyone for going ahead with some positions here (market short), I'll try to give you an overview of what they (the charts) are looking like.

Something is bugging me though and it's not something I can easily describe. When you look at several hundred charts (futures, watch lists, averages, etc.) you get a feel for things and while it's almost impossible to point to a very specific example, something has kept me with the few positions opened as well as the core shorts left open , but not adding too aggressively in to some very ugly charts. I can't quite put my finger on it and maybe it's just me having grown very cautious over the years rather than "Well, lets play this and see how it goes".

In any case, here's a sampling of the major market averages. There are a lot of charts here, but I had a feeling I'd have time to collect them.
 SPY 2 min today

 SPY 5 min with a nasty leading neg. div. , possible head fake, but not very convincing.


Either way, there's little doubt about the deterioration, just a little about where the best timing/entry is.

 SPY 10 min at new lower lows today so that's resolving well.

 IWM 1 min intraday distribution of price gains as we have seen most of the bounce.

 IWM 5 min bounce trend leading neg.

 IWM 10 min, close, but not quite what I was hoping for by the time we should be at a transition point.

 QQQ intraday

 QQQ 2 min trend of the bounce area


 QQQ 5 min nasty divergence from yesterday.

 And it looks like it's finally migrating to the QQQ 10 min chart,

 QQQ 15 min at the previous bounce top and now. Overall this looks pretty good for a downside move.

As for the levers, the main one HYG...
 Intraday charts turned although there was early support.


2 min chart leading big time

 5 min with the early warning before the low as usual and a leading negative divergence. I just wish HYG was leading the market a bit more to the downside and not moving with it.

 HYG's longer term downtrend.

VXX looks like it might be finding some intraday resistance which would make the caution thus far well founded, although I have no problem with the UVXY long position.

UVXY 2 min, with what should be a head fake, volume was only showing 1 spike earlier, I'd like to see 3C at a new leading high as a move below support should accumulate stops. This isn't a bad chart by any means, just a slight annoyance.

VXX, et. al.
 XIV 3 min I think should be showing a worse leading divergence.

 The 5 min chart looks pretty darn good for a VXX long.UVXY long.

And the intraday TICK. I had a feeling earlier before I started the post that the ROC in TICK would be putting in a possible intraday support toe-hold which is why I took the time to put together all of these charts.

 The Custom TICK Histogram shows today and the most recent little intraday improvement.

Here's the base for the bounce with capitulation first, then the base forms and then breadth deteriorates as it should.

Vs. the last/bigger bounce we have the same concepts of a downside capitulation event, a base, mark up and decline, but note the intraday breadth has been a bit stronger on this smaller bounce so I kind of expect a bit more form it

I'm going to check leading indicators, I may just get some additional partial positions or longer term positions that can ride out some volatility because these charts don't look god, there's just something nagging me still.

Charts Are Getting Ugly Quick

I'll have an update for you, but some of what I've been looking for around the 10-15 min timeframe has been occurring, the intraday charts from 1-5 mins are very ugly and very quick.

HYG also looks to be losing support.

I am leaning more toward the SPX/SPY short at this time than IWM believe it or not. I'll have some updates with charts out soon, but this is starting to look very ugly.

TLT Update

Taking a look at TLT's charts today it looks set for a pullback. The conventional thought would be TBT (the 2x inverse of TLT) would be an obvious play for a TLT pullback and I looked at the idea myself, however looking at TBT alone despite any TLT charts, this isn't a trade I would touch right now, it simply doesn't have the signals for a long position that I'd feel comfortable holding over the weekend much less any longer. That's the scenario of probabilities vs. a high probability/low risk trade.

As for TLT...

 This is the longer term trendily that TLT broke after doubling the performance of equities in 2014, can you guess why?

Bonds are typically a purchase made with carry trade assets and they were bidding them through 2014 until we started to get non-confirmation signals that we had previously seen almost all year. Shortly after that TLT topped. I'd like to see and I believe we can see a counter trend move in TLT above the long term trend line which with the bond liquidity would cause a massive squeeze, on the other hand if they are dumped in this liquidity, the opposite could happen.

This is why Yields which use to always be a Leading Indicator worked part of the year, then stopped altogether, and have been working recently. The variable seems to be whether or not the FX carry trades are being covered/closed or not, if they are then bonds are sold not as a risk off/flight so safety indication, but to close the asset that was funded with carry proceeds that are being closed as well.

It's an interesting market, that's for sure.

 This closer view of TLT's daily chart shows a small Doji Star bearish reversal candle on a gap so you could call it an evening star. Higher volume today than yesterday would make this reversal candle much more probable as a downside/pullback reversal,

 This is the intraday 1 min TLT chart not confirming the upside move in TLT.

 And the longer 3 min trend with the initial accumulation at the lows seen on the daily chart , confirmation and a negative divergence with today acting like the Chimney in a Igloo/Chimney head fake.

 However I suspect this is a pullback and if it is a constructive pullback, meaning we see accumulation in to a pullback, it would be worth considering as a buy or add to long position.

One of the main reasons I suspect a pullback and probably a constructive one is this 30 min TLT chart with a large positive divergence through the rectangle base area you can see on the daily charts above.

I'll set some price alerts for any downside move and keep an eye on the charts to see if it is a constructive pullback and when/where the best entry would be.

As TLT sits right now, it looks like a pretty high probability pullback. Strangely however the TBT charts are not giving the kind of confirmation I'd expect with positive divergences and if the asset (TBT) isn't giving signals on its own two feet, I don't consider that high probability/low risk.