As Index futures opened for the new week tonight, SPX futures opened 4.5 points down and moved lower. While MANY markets that make up the CONTEXT model are not open (thus the model tends to have some whacky readings Sunday night until other asset markets open, I was a little confused with ES, NQ and TF all opening like this...

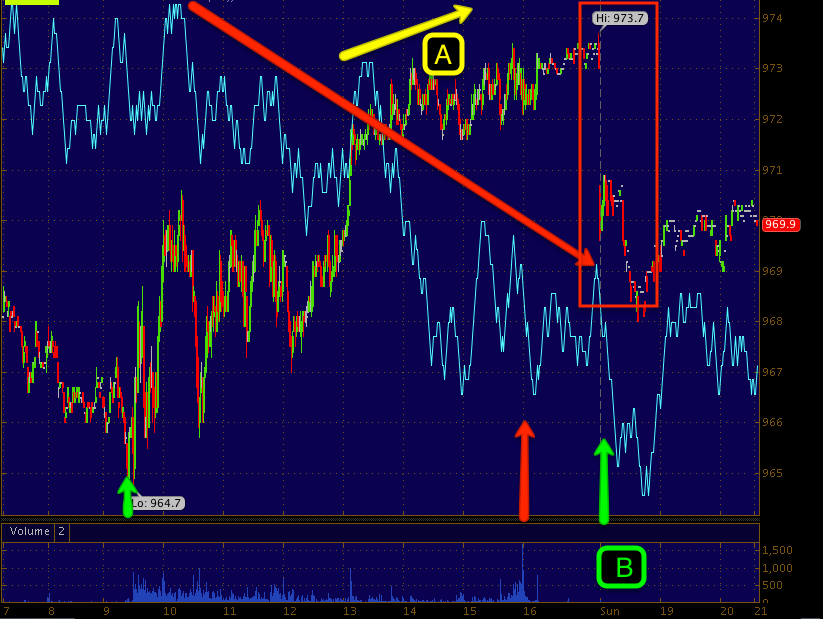
ES shows Friday's 9:30 open (green), 4 p.m. close (red), Friday's opening level @ "A" (green trendline) @ $1625.25, the closing ramp at "B" with a 3C negative divergence in to the close as we saw Friday after the close in my wrap.
For the new week we see ES below Friday's open!

So CONTEXT was a bit confusing @ a positive 14 point differential, even though not all markets are open.

So I did some poking around and even though they almost always move opposite each other (normally) unless something is being manipulated for one reason or another, it was surprising to see 10 and 30 year Treasuries also down on the open of new trade for the week.


Looking at currencies quickly, the single currency futures look like this, the Euro opened lower tonight, 3C 1 min shows late Friday's distribution in to the closing ramp and is close to in line, this is interesting to see, especially at the closing ramp as even this risk asset was sold off on the move higher in equities as I pointed out in Friday's Wrap, no risk assets moved higher with stocks, obvious manipulation.
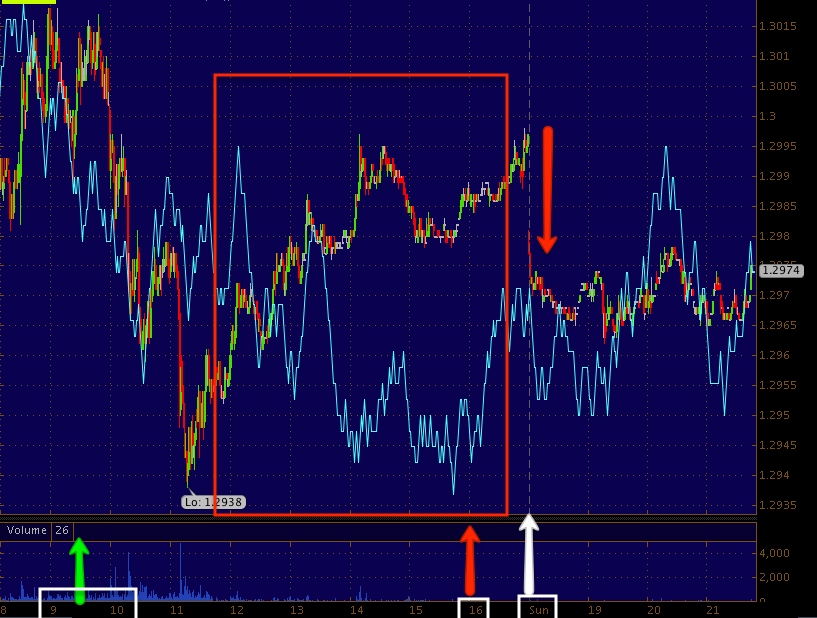
Looking at the 5 min trend, which is cleaner, easier to see..

As for the other risk currencies... The $AUD gapped down tonight, but has a 1 min positive 3C divergence, the Yen gapped lower (which is market supportive) and 3C is in line on the 1 min chart, but has a very large positive divergence on the 5 min chart, suggesting the Yen moves higher pretty soon-this is a market negative. Finally the $USDX1 min gapped up tonight which is a market negative correlation, initially in line it is moving more toward a 1 min positive divergence on the 1 min chart so again for the third time in as many days (less actually), we have something not looking right between the risk currencies and the market negative currencies, the last 2 times I said that last week (which is rare for me to say or even see, I was correct in saying something wasn't right as the markets moves in the direction of the divergence and then quickly failed (market negative in most cases). Again it looks like the herd on Wall Street has fractured, closing out carry trades, trading legacy arbitrage correlations-basically everyone doing whatever benefits them right now, which is not like their usual herding behavior. You might remember I said we saw this in AAPL right before it lost 45%.
As to the FX pairs, also interesting...
The EUR/USD (moving up is typically market positive) has a short term 1 min positive divergence even though it opened lower for the new week, these are the same small positive divergences that responded last week and were suddenly cut short as sellers came in on any sign of strength-it happened Thursday night and Friday, both times I said at least an hour and on Thursday night, 4 hours before hand, "Something doesn't look right".
As for the other risk/carry trades...
EUR/JPY opened this week higher, but already has a 3C negative divergence.


With Treasuries opening down and FX Carry pairs opening up, this would explain why CONTEXT is in the positive tonight, with the distribution in both carry pairs and them moving lower, this also explains why CONTEXT is moving lower since the early opening highs near +20 (now around +14)-very interesting.
Once again, something doesn't look right and any strength in risk assets such as the carry pairs is again for the third time, being sold in to-like the herd has broken apart and it's every person for themselves.
I went back and looked at the Index futures 5 min charts as well as the Treasuries, I found something interesting...I will add a caveat that overnight trade sees a lot of action with different asset markets coming on line and different regions/markets around the world, so a lot can happen overnight, but as of now...
*** As I type this, the Index futures are trying to bounce, they do have some single currency futures on their side, but it will be interesting and enlightening if the move of some strength (they are still well below Friday's close) sees distribution in to any strength as has been the recent trend... The 5 min charts may help answer that. *Interestingly, while not as strong, Treasuries are moving up as well?!?!?
The 5 min charts...


If this isn't clicking or making sense, just read Friday's wrap.
So far since I noticed the move in Index futures as I was writing this, there appears to be 3C distribution just as I suspected, meanwhile the 30 year futures that were also moving higher are seeing 3C confirmation!


Meanwhile Gold is down, 3C is confirming on the opening for the new week, I suspect we will see more volatility (bear market rally), but I also suspect Gold is moving in to a solid bear market. People buy gold when they anticipate price inflation, not once it has arrived and they buy on F_E_D policy accommodation, the fact gold looks like it topped in 2011 and it looks like we called that top right then and there, tells me something that fits with what I have been saying about the F_E_D ever since September 13th of 2012 when they launched QE3, while many members were warning me not to fight the F_E_D, while our 3C signals were negative and correct as the SPX lost 8% from when QE3 was launched-it saw no rally and then fell 8% in to the November 16th lows.
The 5-day chart of gold looks obviously like gold has already entered a bear market.
I have shown how serious the trouble in this market looks, I have shown with EVERY F_O_M_C meeting since September 13th that the F_E_D is slowly acclimating the market to the idea that they will back out of accommodative policy and unwind it, I have been unwavering in this opinion since September.
The F_E_D's unofficial mouthpiece, John Hilsenrath of the WSJ wrote this article released Friday after the close,
F_E_D Maps Exit From Stimulus...
Timing of Wind-Down Is Uncertain, but Focus Is on Managing Unpredictable Market Expectations
Not only have we been showing objective information suggesting this has been their course for 8 months and have been unwaivering, everything suggests this is true from the depth of the dislocations in Leading Indicators to the depth of 3C negative divegrences to just about EVERY other metric we follow, as I said Friday, this isn't about a 20% decline, we are looking at one of the biggest opportunities we wioll probably see as traders. It's hard to take it in when you are concentrated on the gtrees and not the forsest, but...
PLEASE READ THE SECOND LINE OF THE ARTICLE, IS THIS NOT EXACTLY WHAT I SAID ABOUT THURSDAY'S MARKET ACTION?
From Thursday's Daily Wrap...
(From an email question-my answer in the article linked above from last Thursday and Thursday's action as well as the PPT)...
"I don't think that is or was the issue today, with the Yen so low and the SPY not being able to do anything with it, the true nature of risk was revealed, they'd rather flock to protection than take on risk with a Very cheap carry trade today. With TLT Breaking out as the SPY was topping and with few shorts in the market to provide eventual buying support, today could have been a circuit breaker downside move. Look at how much the SPY lost even with that huge and very fast move to bring TLT down. Now imagine they didn't do that and TLT gained even more upside momentum, the SPX could have been down 2-3% today with circuit breakers tripped in the a.m.
It's not so much about holding it up as it is about managing the destruction, today could have got out of control. Notice even with TLT falling, the SPY still couldn't gain any ground, it went (the SPY) from the high of the day to the low in 1 move"
It's all there right in front of you, gold's action alone or the huge base in the $USD, not only were the F_E_D statements and minutes telling us clearly, the market has been doing so too if you listen to the message of the market and not follow the CNBC "DOW 15k" Propaganda.
If anything happens in futures while I'm awake, I'll update, but if you haven't already-open your eyes. We didn't need the WSJ to tell us Friday when we've known for months, it's just a matter of positioning in the right places.
Volatility should remain high if not increase, everything else we are looking for should continue to develop, allowing us many more short and longer term trading opportunities this week.


