Wednesday, July 10, 2013

Now that AH is Closed...

Just to have these on record with the appropriate scaling at the time in case I want to show it later...

 ES 1 min @ 8:20 p.m.


NQ (NASDAQ 100 futures) same time

Considering the SPY closed at 0.02%, the SPY arbitrage (or what we call "Pulling the lever" of intraday manipulation) had to see a lot of work (a $1.15 SPY differential) just to keep the SPY closing flat.

CONTEXT continues to widen, I'll be interested to see if they adjust the model to reflect the craziness in currencies, but I'm not sure that they will, it's not like a carry trade closed.


Currency Wars?

Wow, I've just been so shocked at the disparity between the minutes from the June meeting and Bernie's after hours comments.  I've heard some "possible" explanations like the whole "Accommodative is appropriate" (or words to that effect) simply meant that even after a taper or even the end of QE, that rates wouldn't be jacked up until late 2014 or even 2015 and as such, "accommodative policy" is still in place so Bernie didn't really contradict the minutes. That's really parsing words in my opinion, but I think it shows the lengths people are willing to entertain to explain away the disconnect.


What I have seen a lot of as I watch the futures and currencies is absolute $USD destruction, as a result oil, gold, equities, all of the usual suspects have popped higher (and I'll just throw this out there preliminarily, there are some signs emerging that this after hours move is just as likely to be a trap - not an intentional one unless the locals knew what Bernie was going to say, if evidence continues to build to the point I think it's credible, I'll post it).

However in the world of exports, GDP, etc (as China was slammed last night), a devalued currency is great for your country's exports.  On July 4th both the BOE's (Bank of England) chair, Carney and the ECB's (European Central Bank) Mario Draghi both set the tone to devalue their currency and both currencies fell vs the $USD.

 EUR/USD

GBP/USD

So far I count a 349 pip move (from Bernie's comments to the EUR/USD high), on March 18, 2009 when QE1 was expanded to include Treasuries (it had been MBS alone before that) which was also the market bottom, the EUR/USD moved 370 pips, I just counted a move or nearly 350 pips.

So far this is the best explanation I've seen... "Was this Bernie's revenge?"
 Closer look at the EUR/USD

The Euro Single Currency (Germany WILL NOT be happy about this- especially Merkel)

 The $USDX

A wider look at the $USDX...

Staying competitive? Revenge...?

We all know currency devaluation is the name of the game, that's why the G7 couldn't call Japan to task too hard because their all doing the same thing.


Head Spinning

First, thank you for the emails, I think there's a lot of people that believe "Helicopter Ben" is starting to mean more than just the picture of cash flying out of the helicopter, it seems like many of you feel like his comments make you feel like your head is one of the rotors.

For the moment I'm going to be watching futures like a hawk, there's clearly a disparity in the ES model  where as some smart money assets don't seem to be buying the NEBR Q&A from Bernie after-hours.
This isn't a smoking gun to me, it's a curiosity for the moment.

What is more of what I'd call a real issue is credibility and that is typically found in the credit and bond markets.

I expected Bernie to say something to take the edge off the minutes, I mean "Some participants wanted to end all asset purchases right there at the June meeting"!?!

Bernie is the chairman, but he's not a dictator, there are 12 voting members. What strikes me is how Bernie's tone in tonight's Q&A is so far removed from almost anything said at the meeting 3 weeks ago, half the members indicated it would be appropriate to end asset purchases THIS YEAR, not slow them in to mid-2014. Although I make no argument that the minutes were highly ambiguous,  I would say Bernie's comments tonight seem so far removed from the minutes that it seems like they'd have to be psychopaths to have changed sentiment so quickly.

In other words, something doesn't pass the smell test.

For now I'm going to watch the futures, currencies, treasury futures, etc. and see what the market really thinks of all of this.

The Most Psychotic Episode the F_E_D Has Ever Had?

This is the third version of this post as we seem to be having one of the most insane F_E_D days that would make Alan Greenspan's head spin.

In the June F_O_M_C meeting minutes released today we went from: 


  •  About half of these participants indicated that it likely would be appropriate to end asset purchases late this year.
  • SEVERAL ON FOMC SAW QE TAPERING LIKELY WARRANTED SOON
  • MANY ON FOMC SAID LABOR GAINS NEEDED BEFORE QE TAPER
  • FOMC SAW FISCAL POLICY RESTRAINING ECONOMIC GROWTH
  • HALF OF THE FED INDICATED IT LIKELY WOULD BE APPROPRIATE TO END ASSET PURCHASES LATE THIS YEAR
  • A FEW PARTICIPANTS INDICATED THAT THE COMMITTEE SHOULD SLOW OR STOP ITS PURCHASES AT THE JUNE MEETING 
Then at the Q&A portion of the NBER Conference, Bernie had a much different tone....
Just because the Fed may begin tapering soon, interest rates will still be pinned at current ultra-low levels for a long time.
Bernanke said that the unemployment rate – a key indicator that will determine the future path of Fed monetary policy – probably understates the weakness in the U.S. labor market.
The onset of tapering should not be taken as a sign of an imminent rate hike

Two other points that Bernanke really drove home hard:
  1. The 6.5% unemployment threshold is not a trigger for rate hikes, and the Fed could still keep rates at basically zero for quite some time after the economy hits that level
  2. The rise in rates that have come about lately represent a tightening of financial conditions, and  to the extent that this rate rise threatens the economy, it will be addressed.


Bernie to talk in 3 minutes

Considering the pundit's reaction to the F_O_M_C minutes, I think the speech Bernie is giving on the history of Federal Reserve policy to NBER Summer Institute in Boston at 4:10 p.m. is probably going to be closely watched and read in to in ways it probably wasn't meant to be. In any case futures could get exciting over the next hour.

Now I'll Get Some Charts Up

Opening Normal Spec size UVXY August $50 Call

I am going with the Aug. UVXY Calls, $50. I like the equity long just as much, even more for a trending position.

Of course I think VXX or UVXY on their own as equity longs have enough beta to make them worthwhile positions without the option leverage.

AAPL

I see a lot of AAPL in my mailbox, for me this doesn't change anything, but AAPL is one of the charts that has the kind of intraday signal I'm looking for, it looks like it's coming down/ pullback.


Update

Basically the intraday charts have been perfectly right on, I like when all of the timeframes line up, we have great signals/entries and it seems to me that arbitrage is holding the market in place more than anything, but my thoughts are there is so much confirmation that the important charts for a reversal are going to hold up just as well as the intraday charts have been.

A few quick examples...

 VXX 15 min leading positive

IWM 15 min leading negative

SPY 15 min leading negative

All 3 of those confirm each other, the "process" is about proportionate and we have what would be our larger or longer chart head fake move as well as intraday.

I just want to try to get the best timing signal I can.

I'm seriously considering UVXY Aug $50 calls.

However as I have done in the past and as I think is the best approach, "Let the trade come to you, let everything be in line or wait and if you miss it there's always another,"

I'll keep you up to date

Waiting...

I'm actually waiting for the arbitrage assets to fade and specifically HYG.

"Credit leads and stocks follow"

It looks to me like intraday they are trying to keep HYG elevated because TLT was set to pullback any way, between the two they  create a positive SPY environment.

However, JNK or Junk Credit which trades almost EXACTLY like HYG I just noticed has huge negative leading divergences in it, so I'm thinking HYG gives up soon.

SQQQ Long

Although I won't be adding this, a few of you have asked about it, this is the QQQ/NASDAQ 100 3x leveraged short ETF.

At these levels decent stops aren't far away, but I would never put a stop right at an obvious level like resistance/support, a whole number, near a 50, 100 or 200 day moving average or any other obvious price level or price pattern.

I prefer taking on fewer shares in order to have a wider stop on initial positions, you can always add once the trade is working for you.


Adding Second Half of SRTY Long

This is the Russell 2000 3x leveraged short ETF.


Adding to Profitable IYT August $113 Put

Yesterday I opened a spec. position, I'll add 50% to that position now.

This will be Sticky FOMC Minutes

Sorry for the direct lift, but I can't read that fast.

Doesn't sound market friendly, but as always, the F_E_D knee-jerk

FOMC Minutes: Half The Fed Said It Would Be Appropriate To End QE "Late This Year"


  • FED SAYS SEVERAL ON FOMC SAW QE TAPERING LIKELY WARRANTED SOON
  • FED SAYS MANY ON FOMC SAID LABOR GAINS NEEDED BEFORE QE TAPER
  • FED SAYS FOMC SAW FISCAL POLICY RESTRAINING ECONOMIC GROWTH
  • HALF OF THE FED INDICATED IT LIKELY WOULD BE APPROPRIATE TO END ASSET PURCHASES LATE THIS YEAR - NOT SLOW END
  • A FEW PARTICIPANTS INDICATED THAT THE COMMITTEE SHOULD SLOW OR STOP ITS PURCHASES AT THE JUNE MEETING - "OR STOP"

Now's the Time to Pay Attention

I talked about this in broad strokes last night and very specifically this afternoon. Take a look, it's really quite amazing as one thing moves the other and they all work together to "Pull the lever".

Remember the SPX last night, 1 PENNY from where the limit orders would be...

 The SPY 1 min, so far no confirmation, but definitely hit those limit orders.

Take a look at the SPY volume on the move.

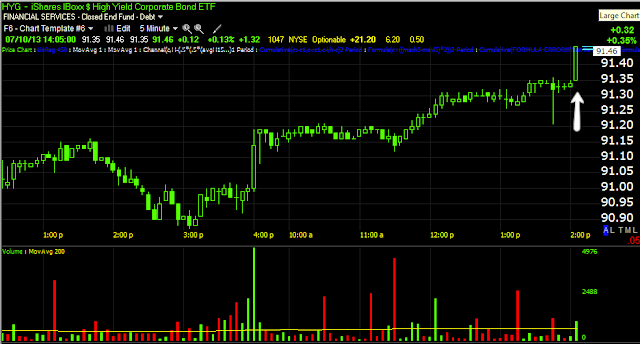
 Again the SPY arbitrage pulling the lever even harder, as I mentioned last night, HYG was an obvious culprit as it was closing red until the last candle of the day nearly as large as the day's entire range to close a +0.05%, but the point was the arbitrage value as HYG, TLT and VXX are the 3 assets used.

HYG I suspect made the actual move that lifted the SPY/market, unless it's clear on a minute chart, you'd probably need NANEX to confirm, but again, Credit leads.

The VIX Futures are part of the arbitrage, this is the range I sid would almost certainly (I said 80%) be broken to the downside before an upside reversal, the thing is it trades opposite the market so it would almost be forced to help in the arbitrage move, again probably only NANEX would have the data as to which was fired first, but with the SPY arbitrage being pushed all day, and expecting it last night based on HYG's last bar of the day, I'm pretty sure we know the answer.

This is the time to watch for a lot, the proof of the head fake, that will likely be seen in HYG distribution, VXX accumulation and market distribution and then the assets that are likely trades, again UVXY, FAZ, other stocks and ETFS. 

I need to get to it, good thing I posted that email post as this happened just after. There
's a good chance there will be some very fast moving action and I may not be able to get all the charts I'd like to, out to you.

Emails

Feel free to send emails as usual if you like, I just have to tell you that I have so many today and it's such an important moment in the market, I likely won't catch up with any more until the close.

I will take a look at them so if there's something you think is interesting or want to get across, try to fit the gist in the subject line or if it's urgent, put "URGENT" in the subject field.

Thanks

IYT

If you had any interest in IYT, Transports which was opened as a Put position yesterday and at a decent profit today, I believe it's starting to run out of steam. I took on a speculative position size so I may add to it, I'd like to see it break above yesterday's close, but in any case, the intraday charts are starting to make it look like a nice entry again.

I'm not entering right now, but I'm bringing it up in case you want to take a look as I feel it is close.

SLV Calls P/L

Before I clear my captures, I forgot to get this up from the position being closed earlier, this was opened I believe Friday.


The fill was at $.50 so the gain was 19.05%.

I also have to look up the SPY and QQQ call positions that were closed yesterday, they were closed at a loss, but I waited a bit until I thought I would get the best price possible and I believe cut the SPY call loss by 40% or so.

I'll find those probably after the close a I'll have to do some digging.

Market Update

In last night's "Daily Wrap" I showed you the Dow-30, the NDX-100, the SPX-500 and how close they were to a very obvious range, I think the SPX was 1 PENNY from breaking above that range where limit orders would be stacked up most likely, the Dow wasn't far at all, the NASDAQ wasn't far, but had the furthest to go.

" In the SP-500's case, resistance at the arrow to the left is at $1654.19, today's HIGH was $1654.18, EXACTLY 1 PENNY AWAY FROM A TECHNICAL BREAKOUT.

What market maker or specialist wouldn't push for that, it's worth it just for the volume rebates or the spread."

There's also a zone of overhead resistance in that area that gets a lot more sticky for the market considering all the gains have come from overnight, low volume futures, during the day the market hasn't been able to do much so I was kind of expecting those levels would be hit and the easiest way would be to move the market to gap up through the overnight futures, that obviously didn't happen.

We still have quite a bit of time today as far as "Things that can happen" and I don't mean just one. I also showed you in the last post (VIX Futures) the very flat range in VXX, UVXY and XIV, I'd say 80% of the time before a reversal there's some kind of head fake move, for VXX and UVXY it would be a run on stops below the range, for XIV a false breakout of the range, but they are just that common.

In any case when I first looked at the market update I put together the SPY looked a lot more like it would try to hit that range I talked about last night and above, it doesn't look as great now, but things change fast. I want to show you the short, intraday 1 min or so and what's right behind it in the context of any head fake moves on an intraday basis either at the ranges I talked about last night or even the ones mentioned in the VIX Futures post.

 This is the weakest chart, but also the fastest to move so we use it for intraday moves, it's the 1 min IWM, it looks here like there's some strengthening and possibly the IWM moves up intraday, that doesn't mean that's where it ends today...like I said, we are very close to these ranges and we still have a lot of time in the day as far as moves are concerned.

 The very next chart , IWM 2 min shows no strength at all, so the point being, any short term move would almost absolutely be that as there's no strength behind it even at the next timeframe of 2 min., it's actually quite weak, which makes sense when looking at the VXX/UVXY charts or a number of other assets/charts and indicators.

 The QQQ 1 min has made more of a move, but as I said, it had the furthest to go, but it looks like its seeing distribution in to this move and the TICK chart at the end is also interesting in the context of this particular chart.

 QQQ 3 min is obviously not showing any strength to support any kind of move that is much more than an intraday move and I think at this point they'd need to pull the levers of Arbitrage (HYG, VXX and TLT). HYG is already up a bit , although seeing distribution, a head fake move in VXX would accomplish the same as far as pulling the arbitrage lever and TLT has pulled back today which is another subject entirely as a trade. The point being, even a very quick head fake move that would normally be seen with such a tight / Flat range like VXX's would also accomplish pulling the SPY arbitrage lever.

Now I didn't even look until I typed that last sentence, but take a look at the SPY Arbitrage model I just captured.
They are pulling the lever because the market isn't strong enough to do it on its own, it was that obvious that when I checked this chart, it was exactly what I thought would happen, except already well under way.

 This is the SPY 2 min intraday, it's not strong, that's not a positive divergence, but it's improvement to try and help out here.

The very next timeframe (the concept of migration of a divergence) there's nothing positive or even helpful, in fact the leading negative has only added more downside to the divergence today, so once again, very weak here.

And the TICK chart which has been weak all week, barely able to pass +100, has been in a tight, flat range of -750 to +600, this is exceptionally week or a standstill, very few stocks are moving up vs down, in fact the bias is toward more moving down with the -750 lower range.

Just something to watch for because I think if it gets pulled off as I thought yesterday, that will be an excellent entry place for assets like VXX, FAZ, etc.


Short Term VIX Futures....

I've talked about and illustrated this 3C concept before, but this is another chance to show you a good example of it and we'll come back and take a look and have an "After action report".

First VXX and UVXY (the VIX short term futures), these move opposite the market, UVXY has 2x leverage.

 VXX 3 min, the negative and then leading negative divergence at the top at the same price area is a somewhat interesting event, just showing the difference between price at the exact same level but the second time there had been significantly more distribution.

There are two areas of positive divergence here, this is a concept that is a bit more rare and we don't get to see that often, but in just about every case over years of using 3C, wherever the first divergence starts, price almost always significantly passes that area which I marked roughly with a green hash mark by price of where the first started. The reason this is interesting is because it takes institutional money a while to put together a position, if it's a large position for a large bull market trend, it can take up to a year. The point is in this case the with accumulation continuing in to lower prices (the same as they sell in to higher prices) there's an average position cost somewhere in the middle, typically as we see stronger divergences toward the end I'd presume most of the position is at the lower cost, but in my experience even though they wouldn't need to pass the area where the divergence first started to have a profitable trade, they almost always do and usually by a pretty significant margin.

 5 min UVXY shows the same two areas, also notice how flat the range of the last two days has been despite price and the fact VIX futures trade nearly mirror opposite market averages' price.

The flat range also opens up the higher probability of a head fake move right before a reversal, however I'm not sure that this behavior is as prominent in something like VIX futures vs a stock controlled by 1 market maker or specialist. In any case the other concept would be that distribution and accumulation are most often seen or at their strongest at these flat areas, this is why I always say, "Quiet markets are like the kids in the room next door being a little too quiet, you know they are up to something" and a flat range like that is about as quiet as you get.


VXX 15 min also shows the two same areas at the exact same place/level with a stronger leading positive now.

XIV is the opposite of VXX, it trades with the market, for confirmation VXX and UVXY should have the same signals and XIV should be the opposite signals.

This 5 min chart is clearly opposite, it also features the very flat range seen as underlying trade is prominent.

XIV 10 min is pretty much the mirror opposite with the start of the move being almost exactly the same , but mirror opposite, the same price level 2x with a stronger leading positive at the second test of the low.

We also see the same two negative divegrences like VXX has the two positives, I didn't look at the exact date, but I'd bet they are the same date.

XIV 15 min leading negative and much stronger on  a long term timeframe that usually takes some time to move, it is quite a move in a short period and right where price is in a tight/flat range.

Obviously I like VXX and UVXY long and as I said, they trade opposite the market.

AAPL Update

What to do with AAPL, Short? No, Long. You may recall how long we watched a process in AAPL and knew something was going on, right now the AAPL equity long is at a 6% gain, that's nearly catching it right at the bottom. I chose AAPL equity long (although we did have some option trades when it first moved) for a reason, I believe AAPL is going for a bear market rally or counter trend rally, there's no doubt after being down 45%, AAPL is in a bear market.

In any case, the non-leveraged position was chosen to be able to ride out a choppy trend that should see a nice, sharp rally as we have seen begin, I love bear market rallies. I do not think this is AAPL regaining its former glory, but a good bear market rally is a strong move so for now based on the charts which were beautiful, I'm sticking with it as this was the original plan, the expectation that there would be chop and draw down.

 If I were in an options trade (call), I'd feel differently, but this is why I didn't chose leverage for this position.

2 min chart

3 min chart- These don't look horrible, but AAPL looked really nice so it's a step down from where it was.

This 10 min chart is probably the most significant in the near term to keep an eye on, I have no illusions that AAPL will pullback during a market leg down, this 10 min chart can give us an idea of how much, right now it's just like a thread hanging out of a sweater, but things can move quickly.

Longer term charts and really what the position is based on look fine, like this 15 min leading positive.

You can go back and look at the psychological process of creating volume or supply and how and where it was accumulated, it's actually interesting, out entry was darn close to perfect, about 1% or so off from the bottom. The point being is this 2 hour chart shows the longer term potential and I think AAPL will end up quite a bit above the large triangle.

This is the trend in AAPL, from a 45% loss to a small capitulation moment and a basing process, again this base is no where near big enough for AAPL to reclaim its former glory, but to see a sharp counter trend , bear market rally, it's just the right size. I'll stick with AAPL.

FAZ Update

FAZ (3x short Financials) was one of the ETFs that really shaped up late yesterday, it's made a run this a.m., but it looks like it will pullback, I'm going to set some price alerts for that pullback.

Typically I might be looking more at an XLF put, but in situations where I think there's a better chance of a trending position or a position that has some legs rather than a quick pop, I prefer to use less leverage, there's SKF as well which is 2x leveraged bear financials.

Here are the charts and the XLF 1 min chart seems to confirm the idea of a pullback in FAZ.

 FAZ intraday very strong the last several days and especially yesterday, the small intraday negative looks like a pullback is probable so I'll be setting alerts for that.


 Migration is obviously apparent on the 2 min chart, the move under the yellow trendline looks like a stop run both from volume and the strength of the 3C signals in the area.

 Again migration of the divergence is what we want to see in a stronger, healthier divergence and this is leading beautifully.

 The 5 min chart

The 10 min chart.

I'm going to try to look specifically through the Financial Industry group and banking/investment banking sub-sector.

Closing last week's SLV $19 Calls

Quick Market Update

The SPX and Dow have this more traditional look and it looks right, there's a lot more to look at as a.m. trade burns off, but here's a basic example using the SPY.

 Yesterday we had a late day "in line" reading that was an improvement from earlier in the day, it's very early in the day of course, but there's been some damage done there.

The progression through charts looks right, the process of the reversal to the upside to the left looks proportionate to the move and to the process on the top side (which isn't well drawn) as the bottom reversals tend to be a bit tighter than the top reversals, but the other thing that stands out is the 3C chart looking worse and worse and now down to the area where the upside reversal started.

The 3 min chart's progression looks just about perfect considering where price is and the shape, the series of charts above looks more like a textbook 3C reversal than any I've seen in a while.