Thursday, May 1, 2014

VXX Comments

You may recall a period of maybe about 6 weeks or so in which there were no VXX trades, I just kept waiting for the right set up and it just didn't come, VXX looked like this at the time...

 VXX was moving up in this trend, but these are not the explosive trends I'm looking for. You may recall I mentioned numerous times that there's a certain "Flying" leading divergence that VXX gets when it's ready to go and it seems only VXX, UVXY, SVXY (or other VIX futures related assets) see this kind of divergence, it's not something I see in equities very often if ever and I suspect the reason is because the VIX, which is also called "The Fear Index", really sees strong underlying movement (3C signals) when there's real concern/fear as fear is one of the two emotions that move the market, Fear and Greed with Fear being the stronger of the two; if you don't believe me just look at any bull market followed by a bear market and see how long it takes for the bull market to run its course and how quickly a bear market erases all of the gains and then some.

Here's an example...
The bull market starting from the 10/10/02 lows that ran to the 10/120/07 highs is roughly 5 years, all of that was retraced and then some in a mere 18 months, most of the damage was done from 5/21/08 to the 2009 lows which is about 11 months.

The point is FEAR IS STRONGER THAN GREED and the proof is right above.

This is why I think we sometimes get these unbelievably vertical VXX divergences that I don't see in any other asset. The fact that we didn't have anything like that for so long during the period above I showed you is why there were no VXX trades during that period, luckily things have changed.


 This is a 1 min chart which we normally use for intraday trade signals, but 3C is a cumulative indicator so the trend of the 1 min chart is full of information as well and that's a very vertical signal at what looks like a textbook reversal process/rounding bottom. Of course we often see a head fake move just before the asset takes off, but if there's 1 asset in which we don't need to see it as often, it's VXX and again, I think that's because of fear, who needs to play games for a little better position when they're in a panic?


 This is an intraday look at the 1 min chart, there's a chance that this was a head fake move earlier today in the a.m. session, whatever it was, it generated a very positive divergence.

Now, this 5 min chart (which is where I really take signals very seriously), is a good example of a "Flying divergence", I don't see these in any other assets and given the Index futures charts Revisiting Targets Again & Market Deterioration Moving Fast, that might explain the signal-especially the momentum today.

Here's the 10 min chart and the reversal process I almost always look for as reversals are almost always a process rather than an event (which would be more "V" shaped"). The fact that this chart pushed to a new leading positive high as well on very strong intraday momentum (just look at today's move) makes me feel pretty good that I added to this position earlier today, Trade Idea: Adding to VXX May 17th $43 Call Position

I'm not sure what tonight's Index futures hold in store for us or what the 8:30 Non-Farm Payrolls is going to do, but there's already deterioration in the intraday 3C signals for the futures after hours, just as it started last night.

TBT Charts

Keeping in mind the choppiness of the market, rather than short TLT, TBT gives you a bit of leverage and you can place a stop pretty close to the entry.

There are a couple of charts that "may" allow for more than a short term trade and that's why I said bounce to possible swing, but I'd take the bounce in this environment with a little leverage.

 TBT 1 min, it's not just the larger divergence , but today's as well.

Here's the 2 min chart, a stop can be placed below the area marked with a white trendline so the risk is very low, however that's a pretty obvious area for a stop, I'd give it a little more room if you can, that's part of the reason I prefer a partial rather than a full size trade.

 This 3 min chart grabbed my attention, especially with that rounding reversal process looking like its nearly complete.

This 10 min chart "could" lead to something more than a bounce, there's a head fake move or stop run and a leading positive divegrence at the area.

And this is the 60 min chart, I doubt it comes in to play, but it doesn't hurt either.


Trade Idea: TBT Long

I wouldn't count on too much more than a bounce/swing trade here, TBT is the 2x leveraged inverse of TLT.

I think I'll open a half size trading position for this one.


UNG / DGAZ/ NG Futures Update coming

I have the charts captured, but there's so little time I'd rather post it after the close.

There are some negative signals in Nat. Gas and there's likely an opportunity there, for now you might want to just place some UNG price alerts between here ($26.11) to about $27 or so, that would be the area I'd prefer an entry. As for open DGAZ positions I don't think you have to do anything, just check out the update.

Market Update: Holding Pattern..

It seems like we are in a holding pattern right now, it's a bit volatile, but still feels like a holding pattern and there are plenty of negative indications, the Index futures though moving so fast surprised me as I wouldn't normally look out that far because they don't usually move that fast. Perhaps the holding pattern has to do with tomorrow morning's Non-Farm Payrolls, perhaps closing trade, I'm not sure, but it's a tough market at this particular moment because of the chop that has dominated, which is like a meat grinder for those who are over-trading, this is why I've really been staying on the cautious side, but there's something definitely going on here.

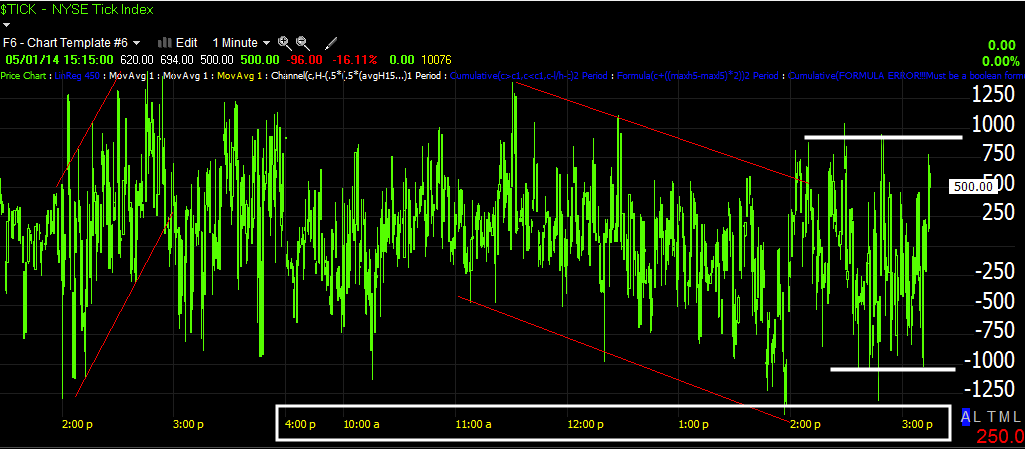
As for the holding pattern and volatility (remember volatility increases right before transitions from one stage to another), the intraday NYSE TICK is a perfect way to view it.
In white is today's regular hours, note the initial pump and then decline and now this wide lateral trend at +/-1000 which is pretty volatile.


Take a look at several charts.
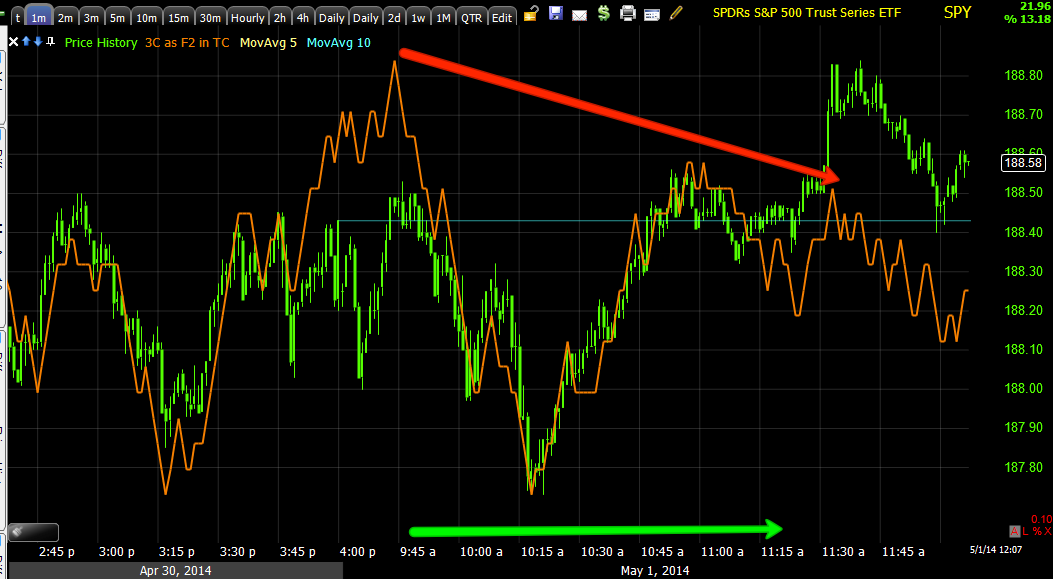
 The SPY 1 min trend has been telling us something has been going on, that something seemed to make its presence known more clearly right after the close in Index futures and on a day like today (May Day) with light volume, the machines should be able to move this market anywhere they want.

This 2 min chart in the SPY shows fairly dramatic deterioration

This 10 min chart shows the start of the volatility shakeout we expected as of April 11th as I posted earlier today, you can see the accumulation for it and it's clearly fading off as the timeframe is leading negative nearly in a vertical drop.

This is the entire February cycle that is causing a lot of the moves, volatility shakeouts, transitions from stages (3 to 4) , etc, but the underlying trend here on a 60 min chart is pretty darn clear.

I put the stage 3 area in yellow (there's a break to 4 below it) and just want to point out the meat grinder this market has been, this is the reason I've been cautious about trades, if you're not careful, this will chew up a portfolio faster than anything and it's not that wide of a range so it's hard to get much of a move beyond a few days in most assets.

I suspect that's getting ready to change though as we saw in last night's update, the HYG update, the futures update and intraday action today.

 QQQ 1 min intraday from negative to a small positive, but this is only 1 min, it's more or less just steering intraday trade and that's what looks like a holding pattern for the moment.

There's no negative on the QQQ 2 min chart, that means the 1 min negative has about a 50/50 chance of either producing an intraday bounce or holding a lateral consolidation as the TICK data shows, if the 2 and /or 3 min charts joined the 1 min, the probabilities soar to an intraday bounce.

QQQ 3 min deterioration has been evident, I'm not sure if I posted it last night in the Daily Wrap, I meant to and may have.

And the 5 and 10 min charts are very similar, the fact that there's migration from these 3 timeframes is also an important feature.

The 10 min which largely shows the QQQ downtrend that retraced almost all of the February rally unlike any of the other averages shows that it was in line of price/3C trend confirmation on the way down which is bearish for the Q's and even the April 11th/15th bounce we expected (the one I posted the targets from April 11th earlier today) has run its course and is leading negative once again.

The IWM trend on an intraday chart is also showing confirmation of the downtrend, the very recent activity has remained in a leading negative position.

Here's a close up of the IWM intraday 1 min with that same intraday positive or holding pattern. The 2 min is nearly exactly in line so there's no positive there like the Q's.


The larger 15 min trend also shows nearly perfect downside trend confirmation in 3C.

Note the lack of any positive divgerence.

And this is the 60 min IWM with the 4 stages of the April rally from #1/accumulation/base to #2 mark up or rally to #3 top/distribution and a break to stage 4, almost the entire trend from mid to late stage 2 has been in a leading negative divegrence, this is where the probabilities for movement are and with Index futures moving so quickly, it seems like they are acting as a timing mechanism.

Quick Market Update

The deterioration in intraday prices is not the only thing deteriorating, the 3C signals are falling at a much faster pace, in fact likely so fast that trying to capture them is futile, but with ES charts negative to 60 mins this fast, someone is clearly worried about something, perhaps there has been a leak of tomorrow morning's Non-Farm Payrolls or perhaps we just hit the targets, but I have a lot of assets to look at.

I was hoping to see some set up in GDX that was moving the 10 min charts toward a more neutral or positive position, the charts below 10 mins are improving, but the 10 min charts aren't there.

There is a strong correlation between gold and GDX and as I said yesterday, with the $USDX positive divegrence and tapering of QE, the legacy arbitrage may finally come back after 5 years of being MIA, we'll have to see if any $USD upside moves Gold down to know for sure.

Revisiting Targets Again & Market Deterioration Moving Fast

***Don't miss the ES charts at the bottom of this post!!!***

On April 22nd I posted Revisiting Market Targets... which was a look back at the April 11th Market Update in which we not only knew there would be a move to the upside and we were at the very lows before it began, but some targets for the move which are all based on market psychology as well as some charts that helped to confirm the market psychology.

These are two of the charts I posted in the April 11th Market Update that showed a "Guestimate" of the targets and I'll tell you why...

 The QQQ at the April 11th lows as that was the day this was posted with a range in yellow of the upside target. The market psychology of the targets were that the Q's had already broken to stage 4 and nearly retraced the entire February rally, but the first thing that we see happen more often than not is a volatility shakeout which is a shakeout of new shorts entering on the break of resistance, that was already completed for the Q's.

The psychological aspect of the targets were two fold and that's why the range is a bit larger, #1 was the market would have to AT LEAST break above the downtrend channel to turn retail traders bullish as a downtrend was clearly in place in the Q's. The second higher target was to break the lower lows/lower highs by breaking above a significant pivot high which is where the small red trendline is just under $90.

These targets weren't based on anything other than, "What will it take to convince retail that the downtrend is broken?" and these were my two answers.

The IWM chart below was also posted and had the exact same reasoning for the targets...
#1 to break the downtrend channel and #2 to break above a former pivot high, the one around $115 would have broken the trend of lower highs/lower lows, but the market always tends to move in extremes, that's why I placed the upper range at the next higher pivot high.

I didn't post the SPX and DOW because they had JUST broken to stage 4 on April 11th, but this is what I expected and have posted several times for their targets (these are current charts)...

 If you look at the IWM/QQQ charts posted on April 11th above, they had already broken to stage 4, they had already completed their Volatility Shakeouts, I think the move off the April 11th lows had a lot less to do with the QQQ/IWM than it did about the SPX/DIA completing their volatility shakeouts as they were last to break to stage 4.

The SPY broke to stage 4 on April 10th after a head fake move (these are used to create momentum and this is why we often see them just before a reversal) on 4/4 in the form of a failed of false breakout, you can see the SPY went straight to the break of stage 3 support to stage 4. I believe the volatility shakeout waited 1 more day for the April 11th lows because the Dow had not moved to stage 4 on the 10th, but the 11th (see below).

As is the norm (just look at the IWM and QQQ charts above, one of the first things that happens after a break of major support from stage 3 to stage 4 (and I talk about this a lot with regard to the 3 places I'll short a H&S top with the Volatility shakeout being the 3rd and last place I'll short a top pattern), both the SPX (SPY) and DOW (DIA) made that VT shakeout which we saw coming April 11th, that's when the upside targets were posted before the upside move even began.


This is the DIA, it broke the stage 3 support, technically at stage 4 on April 11th. The Volatility shakeout could have just taken out the last pivot high at the white trendline, but again, the market moves in extremes and you have the QQQ and IWM to consider, whether just breaking the downtrend channel would be enough or whether the series of lower lows and lower highs would have to be broken convincingly.

I would say that all of the major averages have moved far enough to hit their target zones and that is probably why we are seeing the deterioration build so quickly now, for instance take the ES/SPX E-mini Futures that quickly built from intraday negative to 5 min negative which is a pretty serious move in the amount of time it took.

 This is the ES 5 min chart, the negative divegrence that formed here from the after hours 1 min negatives last night was very fast.

*SURPRISE*

I didn't even see this until just now and I did look last night when I was putting up the Futures Updates, it wasn't there...
 The ES 15 min chart has gone to a leading negative divegrence, this is very fast and strong migration of this divergence.

Just as I was putting these charts together I thought, "well let me see what the longer timeframes are doing" and more surprises...

 The ES 30 min has started going LEADING NEGATIVE AND...

The 60 min ES chart is doing the same, this wasn't something I expected to see when I started this post.

This looks to be very bad market deterioration in amazingly fast time. I'd guess the targets on the upside are pretty much taken care of.

Trade Idea: Adding to VXX May 17th $43 Call Position

I'm finally liking the way VXX is looking, I have liked the way it has looked, I mean more specifically for an add to. The May 2nd expiration is just too close for me to consider adding to, I'll keep it open as it's a very speculative (small) position, but I think the 17th is a better choice for an add to for the position already in place.

Market Update

Finally getting some movement! All this morning has been in line, nothing to speak of of any interest, which is odd considering the way the 5 min Index futures look as posted earlier today.

Here's what we are starting to see now, I will be looking at VXX closely for a May 17th call add to, I have not made that decision, but am considering it. Of course VXX long or UVXY long should be decent trades as well if the call position add-to sets up.

 The SPY 1 min intraday has been in line most of the morning (green arrow), it just put in a neg. divegrence.

The trend view of the same SPY 1 min chart has been leading negative for a couple of days now so it has been strongly hinting at a decline to come.

There's also migration which I'm thankful to see, this is the SPY 2 min leading negative.

The (2 min) IWM intraday this morning has also been nearly perfectly in line and just went leading negative with the SPY.

 It's pretty early in the process of intraday migration, but there's a relative negative on a 3 min IWM chart so it does seem this momentum should pick up (negative divergences).

The Q's intraday (1 min) were in line all of this morning too until a recent small leading negative formed

And here's the 2 min view.

With some migration starting to move to the 3 min chart, migration of a divergence indicated it is getting stronger.

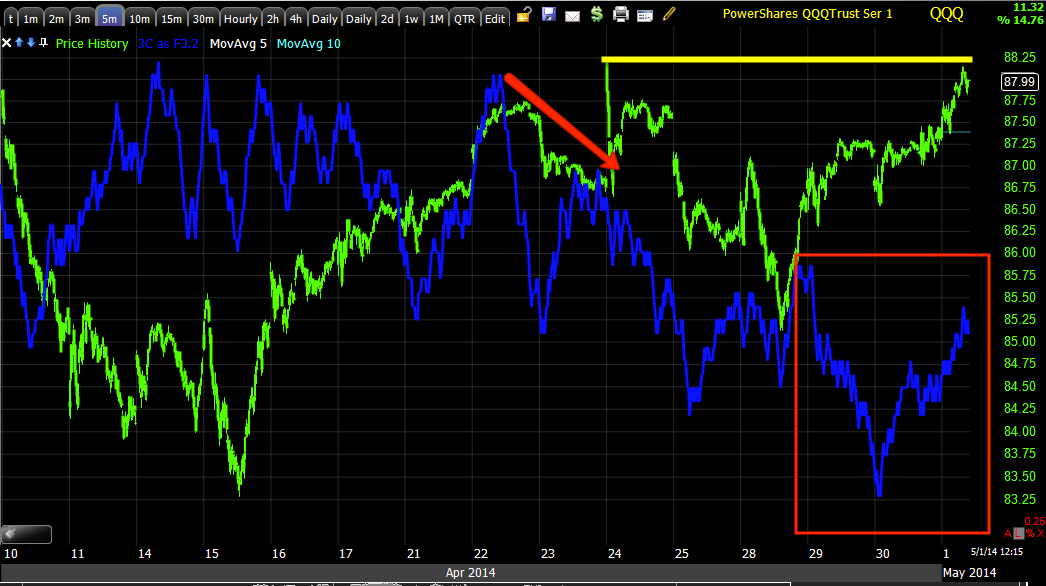
The QQQ 5 min has been looking pretty ugly and suggesting a move down to come, I have been wondering if it would go for a move above the yellow trendline, local high.

 This is the ES 1 min chart and it's confirming the averages.

This negative action is what I'd expect given the look of the Index futures on a 5 min chart...
ES 5 min leading negative and very quickly.


GDX Update

On Tuesday I posted some 10 and 15 min charts that were confirmed in GDX, NUGT and DUST (inversely) GDX / NUGT / DUST Update .

Those 10/15 min charts, along with the clear rectangle range in GDX for over a week suggested a very high probability of GDX slipping below the rectangle as it has this morning...This is the chart from the post linked above from Tuesday.

15 min (and 10 min ) negatives in GDX/NUGT and 10/15 min positives in DUST all suggested (as well as the obvious range) that we see a slip below support.

GDX this morning...
GDX just under the support area of the rectangle...

However, GDX remains a very strong trending long candidate, I personally would not try to trade GDX short here because of the break under support, I don't see a great set up in DUST any way.

I'm already seeing some interesting signals in NUGT and GDX on this morning's break, but I'm still cautious, here are the signals and why I'm still cautious.

 This is a 5 min NUGT chart with the same divergence I was talking about Tuesday in the same area, but this 5 min chart this morning is already leading positive in a pretty big way which is impressive so quickly this early.

Here's why I'm still cautious (and remember the $USD positive divegrence and how the legacy arbitrage works, typically sends gold down on a stronger dollar, although QE has flipped that since 2009, but as QE keeps getting tapered I suspect the legacy arbitrage that has dominated for decades will eventually make its way back to "normal".

This 10 min chart is still in a "in line" mode, the good news is it's no longer negative as the break lower fulfilled that signal although we could still see lower prices under resistance (which was support yesterday).

I'd prefer to wait for this 10 min chart to start showing positive signals and if the 5 min keeps moving like it is, then it shouldn't be long. We do still have 15 min charts to deal with, but if there's enough migration to turn a 10 min chart positive, it's only a matter of time before the 15 min follows.

The larger picture above (30 min chart's positive) is the direction I want to trade in so I'll be watching for the 10 min to show signs of going positive.

This may be a decent candidate to phase in to, (GDX or NUGT long).

Futures Update

Happy May Day.

The futures started acting up yesterday after the close in a noticeable way and they migrated to longer timeframes very quickly last night, so fast in fact I could watch it hour to hour which is not something I'm use to seeing that fast in futures (Index).

In any case, this is what the 1 and 5 min Index futures look like which for now is about the timeframe we are dealing in until we see how the market behaves on a pullback, whether it accumulated lower prices and makes a small bounce or whether it sets up a new leg lower from the initial stage 4 breaks in all of the averages.

 NQ 1 min negative, it's little wonder the market started to move lower on the 9:30 open

NQ 5 min

ES 5 min...

When we have 5 min negatives like this in the Index futures, the kind of pullback we are looking for is usually right around the corner and I think we may be at the corner right now.

TF 1 min

TF 5 min.

In other words, the market is ripe for some downside here, not the small choppy moves, but something with a little more teeth. I want to see what Opening Indications look like and if the divergences follow from after hours negatives in futures from yesterday in to the market averages (some are already pretty much there).

We'll also see if there are some reasonable set ups, I see GDX is just about making that move we were looking for under its range.