Thursday, March 1, 2012

GLD's Close

 I'm happy with the call yesterday to close out the GLD puts for a great profit, I'm also happy to see members being patient for the next potential entry. I still think a falling 3 methods (it could be more then 3 candles up) is the most probable outcome.

 The 30 min chart does suggest that GLD will see another leg down and I look forward to finding the right day to enter. It will be interesting to see if the COMEX adjusts margins in light of yesterday's move.

 The 5 min chart isn't VERY strong, but it looks strong enough to support a pattern like a falling 3 methods (3-5 days up within yesterday's candle body.

As for intraday trade today, early trade showed trend confirmation, at the white box we had a positive divergence and GLD added to the intraday gain. A brief test of intraday resistance was met with a negative divergence sending GLD lower in to the close. This isn't surprising after yesterday, traders will be a little gun shy and quick to take profits on a failed test of intraday resistance.

AAPL Close

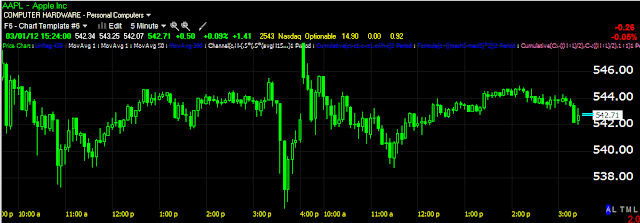
 We didn't get the bearish engulfing candle today, but it wasn't a strong day for AAPL either. Over the last 26 days (generally 22 days in a trading month) we've only seen 5 days in which AAPL closed lower then it opened and only 3 on any kind of volume. Over that same period, the average daily gain has been 1.04% with today's at .24%

 The 2 min chart was uncharacteristically weak yesterday and  today.

 A closer view of the 2 min today, also note the 1-2 p.m. area in which 3C weakened like we saw in most of the market.

 The 5 min chart is also hinting that we are near/at some kind of top in AAPL.

 The 15 min chart is already leading negative, it added to that today.

The 30 min chart added quite a bit to its leading divergence today as well.

However as I mentioned earlier today, we can often see a series of dojis/stars before a confirmation candle.

FOSL put in 5 before it reversed -39%

USO Update

As you know, we were expecting a bounce in USO today to start with, the news of a Saudi pipeline on fire sent crude up quickly, but in the article from The Arab Digest  the article said,


"the Saudi government sources were quick to claim that the fire is one kilometer away from the pipeline. "

This seems to have effected USO as the initial story would certainly send it up, but it sound like the actual pipeline is still functioning...

 I would think when volume first started picking up, that was on a rumor, when it really increased that was on the story that the pipeline was burning and the move down on subsequent release from the government that the actual pipeline is not burning.

There was a relative negative divergence, but I think it is not connected to the story.

It will be interesting to see what USO does tomorrow, as you may remember earlier today I said typically on a channel buster the retracement is to the bottom of the channel "Kissing the channel good bye" which as you can see, prices moved in to the channel and found resistance there with the long upper wick on the last candle on the 60 min chart.

Financials...

 XLF intraday went negative around 2 p.m.

 XLF intraday 2 min is leading negative.

 The 5 min is leading negative at a new low (sell / short in to strength)

 On the longer charts, pay attention to where they went negative and the subsequent action. Here around the 2/3 is where the divergence culminated and XLF has been leading negative since.

 The same can be seen on the 30 min chart, again around 2/3/12

 It is especially sharp on the 60 min chart, again, remember 2/3/2012.

 Here is the momentum in XLF from the lows that started the most recent leg up on12/19 through 2/3 for  return of 20%

From 2/3 until present, the return is 1.22%, this is 19 trading days (remember we had a holiday) so that equals 4 trading weeks, right at the same time the divergence grew very sharp and since 2/3 3C has been leading negative.

Market Update

Although the decline lower started around 1:40, news also broke that a Saudi pipeline was destroyed in an explosion sending crude higher and explaining the commodity chart in the last post.

From The Arab Digest


Saudi Arabia's Eastern Revolution hits the oil sector: pipeline under fire

 DIA under $13k

 DIA negative divergence

 DIA 2 min negative

 ES negative all day

 IWM

 IWM 2 min negative

 QQQ seems to have hung in better because of AAPL

 AAPL

 QQQ 2 min negative

 SPY

 SPY and the 50 bar 5 min.

 SPY 1 min negative

RISK Assets/ Credit vs the SPX

Make that 2 restarts and a complete shut down of two operating systems (Mac/Windows).

Commodities are outperforming the SPX, a bit strangely as well

Here are commodities in green vs the Euro, they usually track the Euro because of the $USD correlation, but it seems they have almost been running inverse today, I'll have to take a look at some major currency pairs and see what's going on in a bit.


 Yields again, intraday were leading and topped before the market.

 SPX- vs the Euro, as you can see the correlation is totally off today making the move in equities a little suspicious.

 High Yield Corporate credit is selling off pretty well today.

And financials also were leading the market, topping before the SPX. I'll be updating the market and financials then commodities.

Technology...

This isn't the post you think, just as the market starts to get interesting, my computer freezes. I'm running 4-5 streaming programs at any one time and that seemed to be enough to shut me down.

I'm back up after 2 re-starts and updates are coming.

ES Update

 DIA intraday

QQQ intraday...

Just like late yesterday when we had signals, but they were mushy compared to ES, ES is sending a stronger signal today as well...

 Yesterday late in the day in a market update I said this,


"The only thing that is sticking out is a 1 min positive divergence in ES"


And that signal proved to be very accurate. Today with mushy or mixed signals (as mentioned earlier), ES stands out.


AAPL Update

AAPL is now bigger then several sub-Industry groups combined, take semi-conductors for example, that makes AAPL the ultimate bellwether for the market. After seeing signs of increased 3C deterioration, early yesterday I said to watch for AAPL to post a small bodied closing candle on heavy volume as this would be the first step in a reversal. Last night I covered AAPL and Technology in detail in this post so I won't be reposting a lot of charts.

Here are the key charts.

 As suspected early yesterday, AAPL did post a closing star candle, you could almost call it a bearish reversal evening star. The volume was increased, but not as big as I had hoped for, but with the heavy volume and AAPL's inability to add much from the open, the concept of the conditions were in place. The last sentence of  last night's analysis of AAPL/Tech was,

"We'll have to see if AAPL now puts in a confirmation candle for the reversal set up (sometimes there are 2 or 3 dojis stars in a row before a confirmation candle)." 


Thus far today, we have the start of such a candle in a gap up and so far some decline. We need a gap up to have any chance of a strong confirmation candle which would be a bearish Engulfing Candle, so the first step is there. The close would need to be lower then yesterday's open and the lower the close, the stronger the confirmation candle for a reversal.


 Intraday, here's AAPL's Gap up and subsequent decline, it is somewhat detached from the market.

AAPL in green/SPY in red, AAPL did see some heavy volume within a downtrend suggesting an intraday reversal up which we have seen, although relatively, it is under-performing the SPY intraday.

 These charts and the increased downside momentum were the hint to be looking for an AAPL reversal-1 min

 2 min

5 min

So now we'll see if the weakness continues and bleeds in to longer term charts, but the most important thing is how AAPL closes. Volume is not needed for a bearish engulfing pattern, but I would suspect volume would be high if one appeared.