Monday, January 5, 2015

Daily Wrap- Important

You may recall that part of our December 12th (Friday) forecast was not only for the Russell 2000 to break above its 6 week trading range which it did, but that this would be a false breakout that would not hold and that the Santa Claus rally that traders assume as a birth right would be part of the trap that locks bulls in.

More specifically, the pop above the range in to the Santa Claus rally season would just bring more bulls in to the market as they assume like most years, they'll get the seasonal rally, our take from the charts and mass psychology was that this assumption that is widely held would be used against traders and the Santa rally would FAIL.

This is one of numerous depictions of what we expected in to the Santa Claus rally, from the December 26th A.M. UPDATE

" Today is the first day of the "Traditional" Santa Claus rally. You may remember that part of my theory with regard to this recent move up that was posted a week ago last Friday was that it coincide with the Santa Rally which is the week of Christmas (day after) through New Years, and the possibility if not probability that traders would be lulled in to the rally as they believe it's a near God-given right that MUST occur, with any sudden drop during this period likely to cause some intense downside action/pain. so it will be an interesting time moving forward through New Year's."


Taking the broadest definition of the Santa Claus rally (as there are at least 3 generally accepted periods with a little variation), the day before X-mas to the second trading day of January, this year's Santa Claus rally was the worst in 15 years or since 1999. It would seem that our forecast that not only would the breakout above the IWM range not hold (rather act as a means to an end in which the market moves lower), but that once again, Wall St. would use the predictability of traders and turn it on them.

The Santa Claus Rally... (SPX/Dow-30/NDX/Russell 2000/Transports)

FAIL

For the SPX, 7-days of gains, about +3.6% were almost entirely erased over the last 4 days (-3.34%).

As we also expected, I don't think it will take long before we take back all of the December 17th F_O_M_C knee-jerk gains, of course there's a much deeper downside target for all of this.

Europe was an absolute mess today, the amped up Greek Euro-area exit rhetoric was flying at new levels over the weekend, taken with the strongest country in the Euo-zone, Germany in an apparent deflationary spiral along with the rest of Europe. When the market reacted to Draghi last week on news that the ECB is in complete agreement that they need to act on deflation, with Reuters' help, the market took that as imminent QE, Germany then put the slap down on Draghi directly and we know from the near mutiny Draghi has on his hands, despite what Reuters may want to try to spin, the governing ECB council is FAR from agreement on QE as we saw with Merkel's economic advisor warning last week in a direct Draghi smack-down.

I stopped covering the details of the consequences of a Greek exit a while ago because it's very complicated and more academic, but it would have huge consequences for banks across Europe and perhaps most importantly consequences for ECB funding which in many ways is channelled through Greece in the form of bailouts which aren't actually bailouts, but payments of existing debt, interest and ECB funding via the IMF and the Troika so this is more than just whether or not Greece survives in the Eurozone as things heated up when there were 3 failed presidential elections causing snap elections rto be held soon in which the anti-austerity party, Syriza looks to garner control over Greece and give the EU a very hard time if not an exit.

Here's how European markets closed earlier today, Euro-Stoxx 50 -3.70%, FTSE 100 -2%, CAC-40 -3.31%, DAX -2.99%, IBEX -3.45%, FTSE MIB -4.92%.

For our part, not a whole lot better than some of the larger European markets, SPX- 1,83%, Dow Indu -1.86%, Dow Transports -2.66%, NDX 100 -1.64% and the Russell 2000 -1.46% AND THAT TO CAP OFF THE SANTA RALLY!

As for the close, we are so use to the late day ramp or attempt, some call this a failure of a late day ramp.

I'm not convinced that is what this was, in fact I don't see any evidence of it specifically like disproportionate VXX/TLT distribution, HYG accumulation or USD/JPY being ramped. All of the normal tell-tale signs of a ramp using levers are absent. I suspect "if" anything, this was just part of a more lateral basing operation that started late last week. although the post EU close bounce is a bit harder to discredit even though it was inconsequential.

I showed some charts today with some popular moving averages and where each major average was in relationship. The SPX closed below the 22 and 50 day today, the Dow took out the same with the break of the 50-day being the first time since just before the F_O_M_C. The NDX took out its 50-day and the RUT took out its 22-day, but held the 50-day. These are important levels for technical traders and I notice it's not uncommon to see price linger in the area after an initial break or cross back and forth a few times. However the break of the IWM and hitting stops at $117.50, even though it closed off its lows and used the 50-day for support, is really where I have expected a downside trigger to engage sending the market sharply lower.

The 10 and 30 year yields are now below the level from the F_O_M_C with the 10 year closing at 2.039% and the 30-year at 2.605%. I do believe that it won't take long for stocks to catch down as I had mentioned late last week that ES/SPX futures was catching down to USD/JPY, today it finished the job.

 The exuberance in SPX futures was pared as it caught down to the USD/JPY correlation today (60 min chart).

Intraday the USD/JPY (Candlesticks ) and Es (purple) were pretty tightly correlated which may tell us something about a potential bounce which I'll get to in a moment.

To give you the quickest, easiest view of the market, I'll just use the averages which suggest either a bounce starting tomorrow or a wider base continuing and a bounce, I lean toward a bounce starting tomorrow.

 5 min SPY positive from last week and today suggests a near term bounce, it does not suggest a very long bounce, although every bounce has a job to do and that's to be convincing.

There's no doubt which way probabilities lay as the 30 min SPY is deeply leading negative at new lows.

The 5 min QQQ also shows a bounce off a positive divegrence started last week, as does the IWM, but again...

The 10 and 15 min charts (IWM 15 min above) are very negative, thus capping any upside and putting probabilities firmly to the downside.

While this may seem unconnected to near term market action, I don't think it is, check out the charts, I'll explain at the end.

Currency Futures
 The 1 min $USDX shows a slight positive divgerence, I think it is probable that this grows overnight.

 However the 5 min $USDX is actually quite negative.

As is the 7 min $USDX.

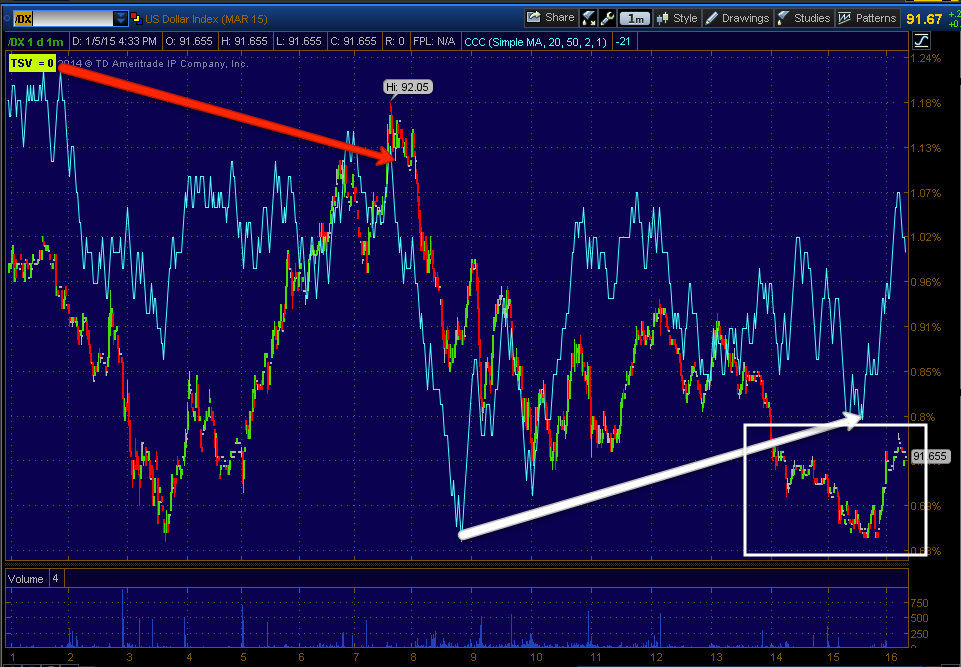
A rising $USDX short term would lift index futures/the market as you saw the ES vs. USD/JPY correlation above, however I don't see this as a very long bounce right now because of the 5 and 7 min negative divergences, in fact it looks to be quite short term (possibly day or so).

The 15-30 min $USDX are both negative, from 5-30 min the $USDX is negative suggesting a deeper pullback, likely taking USD/JPY lower with it which would fit nicely with out market expectations, a short term bounce and continued move lower, this is why I have no interest in trying to play a bounce, it makes no sense to me.

 The longer term 60 min $USDX looks like it very well could head higher, but not before a mid-term pullback which the 60 min chart seems to be indicating as well as the 5 min- 30 min $USDX charts, again, that would likely mean USD/JPY lower and Index futures/market lower as we have expected.

 The 1 min Yen is pretty noisy, but the 5 min suggests a near term Yen pullback which would be the short term boost to the USD/JPY that Index futures could use for their short term bounce, however, at the 5, 7 and 15 min Yen charts, they are all positive, almost a perfect fit for the USDX charts and the idea of a very short term bounce in USD/JPY and the market followed by deeper downside.

 Here's the 30 min Yen positive which would mean a lower USD/JPY pout to longer term charts, again right in line with market expectations of a lower low below the October lows.

The 60 min Yen is also positive, just remember, the Yen moving up is negative for the USD/JPY and the market if it is still correlated to it as it usually is, thus the $USDX and Yen charts both suggest a near term, short bounce followed by renewed downside and I suspect much heavier downside as the IWM cleanly takes out all of the longs in the trap.

Even the 4 hour Yen looks very strong here,  this has been one of my macro themes, a stronger Yen/weaker market.

As for the EUR/USD or the Euro in particular as you can apply the $USD charts, a weaker Euro typically means a stronger $USD and vice versa which has an effect of course on the USD/JPY pair outside the Yen and $USD by themselves. Looking at the Euro...

 The 1 min Euro (futures) is negative, this would give the $USD some near term strength as we have already demonstrated with both the USD short term and Yen short term charts, both arguing for a near term move higher in USD/JPY and thus the market, the Euro looking like this only helps NEAR TERM.

However at 5 min the Euro is leading positive, this would have the opposite effect and weaken the $USD which we already see on the $USDX 5 min chart, again suggesting any USD/JPY led bounce is very brief, also suggesting some near term EUR/USD upside AFTER a market/USD/JPY bounce in the VERY near term.

The Euro's 15 min chart is also building positive so it may lend even more strength to a EUR/USD bounce and sap more from the $USD and thus the $USD/JPY and the market again, after a very near term, very short term bounce.

I don't see anything very exciting in the traditional levers, we know that VIX short term futures and spot VIX underperformed their correlation vs the SPX today and the VXX has some negative divergences in it, TLT near term does nit, mid term it does, but that's another subject. I was surprised not to see stronger positive divergences in the main ramping lever, HYG.

 VXX near term 3 min chart with a negative divegrence suggests a near term pullback and a bounce in the market, but note the size of the current negative next to the larger positive, there's more gas in the tank on that positive so I view this as a near term/short term event (VXX pullback/market bounce).

The 60 min VXX chart is about as strong as ever, clearly hinting at the big picture market movement being to the downside/

As for HYG, it couldn't even hold together a 1 min positive today. There is a 3 min positive, but only through the last half of today, unless they intend on strengthening the base, which doesn't seem likely based on the currencies above, I suspect there was little appetite to take on HYG risk even as a ramping lever short term.

I did however find some HY Credit leading the market today, as I said earlier, about half to 2/3rds of the HY assets I watch, so that makes me think a bounce is very probable, but with everything else, not long lasting and I mean perhaps a day (I'll know more when I see if they continue to build it tomorrow or just bounce it tomorrow, the latter would point to a shorter term move, I'd still use it to sell in to as I demonstrated today with Biotechs...Letting the Trade Come to You- NASDAQ Biotechs

In most other cases, Leading indicators added nothing today beyond what they added late last week, leaving many still in a short term positive position for the market, but not much else.

Finally, I would expect breadth to signal a severely oversold market (near term- as in 1-2 day oversold)... And that's what I found.

The Dominant Price/Volume Relationship was extremely dominant with 27 of the Dow 30, 93 of the NDX 100, 1042 of the R2K and 412 of the SPX-500, the relationship was close down / volume up, this is a strong 1-day oversold condition and typically the market closes green the next day on the oversold condition. This is one of the strongest Dominant P/V relationships we have seen in some time.

Of the 9 S&P sectors, 9 of 9 were red with Energy lagging at -4.14 and Healthcare leading at -.51%.

Of the 238 Morningstar groups, only 44 of 238 closed green. ALL 3 OF THESE SHOW A MASSIVELY SHORT TERM OVERSOLD MARKET PRIMED FOR AN OVERSOLD BOUNCE.

Taken with the currencies and 3C charts, I'd say is pretty much inevitable unless some fundamental news blows things out of the water, however I still WOULD NOT chase this, but let the trades come to you and trade with the probabilities (short).

That's the take-away which has been the same all day, the additional currency information gives some more color. I'll check on futures later and post anything out of the norm, but I think we are on course for some trades to come to us and I know a lot of you are hoping to get that opportunity, just remember that bounces are made to look credible so while you may feel that way now, you may not feel the same way after seeing the bounce, just remember the highest probability charts and all of the pieces of the puzzle we've gathered. I'll be looking for specific opportunities in to any bounce and will post them as I find them. Other than that, have a great night!


Closing Update

After looking at as much as I can, as things change fast in to the close, I still think that a bounce is a strong probability , but again an oversold bounce, a relief valve which is actually good for the market, otherwise oversold tensions result in massive, surprising moves like big short squeezes. This at least we can see coming and know how we want to deal with it.

I see under-performance on a relative basis in VIX short term futures and spot VIX vs SPX, TLT is in line or better, HYG is in line (price only- not 3C divergences). I see our pro sentiment indicators haven't taken on any additional risk today, but they are still positive from late last week, also indicating a bounce. Yields are in line with price action so they aren't telling us much, I'll look closer at the bonds that drive yields for additional clues.

HY Credit is showing positive divergences, not all of assets in HY Credit I watch, but at least half to 2/3rds so that tells me something near term.

MY SPX:RUT Ratio indicator isn't confirming the downside so it also is pointing toward a bounce.

Index futures are coming around on 1 min charts, but they haven't done much beyond that, 5 min charts are not positive or not enough that I'd even bother to capture them.

The averages have positive divergences in them, all of them have positives that were formed late last week and their 1 min charts (timing) are coming around.

I suspect the breadth/internals will confirm a massively short term oversold market and at least a 1-day oversold bounce.


Letting the Trade Come to You- NASDAQ Biotechs

Assuming we can pull off a bounce from here and I mean, "Assuming" since the IWM is back inside the range and has closed the door on the bull-trap that the Crazy Ivan shakeout was to set up, keeping in mind that failed moves create fast reversals;  such as the 15th and 16th of December below the range and the almost instant pop the next day nearly above in a single day (what the IWM couldn't do in 6 weeks). Or the recent move above the range of approximately +2.4% in 7 days and a -3.20% drop in only 4 days.

This is what I'm talking about in using short term price strength when you have big picture divergences that contradict that short term price strength. Thus on a bounce, NASDAQ Biotechs look like an interesting short or add-to position in to any upside price strength giving you a better entry and lower risk.
 First the daily chart of IBB, NASDAQ Biotechs didn't perform that bad today on a relative basis. More importantly, note the week long range and clear resistance, that's an attention getter, the same concept as the macro IWM 6 week range that we are working our way through. That clear resistance range should pull in new buyers on a breakout above defined resistance, thus this looks like it could be an interesting short on some price strength.

Again, this is a smaller micro version of the 6 week IWM range and resulting bull trap and downside reversal.

We need to know what the probabilities of a breakout are and how supported such a move might be and what the probabilities of distribution in to such a move might be so I'm looking at multiple time frames and multiple assets, IBB, the NASDAQ Biotech ETF, BIB the 2x long NASDAQ biotech ETF and BIS, the 2x short NASDAQ biotech ETF.

The 1 min IBB has a recent 1 min positive divergence, it looks like it's going to go for an upside breakout through the clear defined resistance area.

As confirmation, the 3 min BIB (2x long bios) is also showing a positive divergence. I doubt this would happen without NASDAQ 100 and broad market support, a bounce.

Even the 5 min BIB (2x long) has a positive divergence so it looks like the intention is there, thus giving us a better short entry level with less risk, but would it likely be a head fake move and fail as the signals showed us in advance for the IWM and broad market?

 This 10 min BIB trumps all other timeframes above, it doesn't negate what they are showing, but it essentially says, when the near term stuff is done, this is the direction of highest probability and with a leading negative divergence that is down.

The 2x short bios, BIS is one you might be interested in buying long for short exposure at 2x leverage rather than shorting IBB, it's 10 min chart is leading positive, thus confirming the BIB 10 min chart's negative divergence above and probabilities.

 The 30 min BIS (2x short bios) has a huge leading positive divergence through it, this is higher probability than anything above and agrees with the 10 min chart. Thus far this tells us near term probabilities for a bounce above resistance are good, but the chances of that bounce holding are very poor, thus making entering on strength an advantage.

Confirming with the original IBB 60 min chart, it too is leading negative, again more confirmation that a short term move above resistance would fail and thus offer you an advantage in entering a short on such short term price strength.

The 2x leveraged BIB long's 2 hour chart shows the entire cycle from stage 1 base/accumulation to stage 2 mark up to stage 3 top/distribution and this is the strongest chart at 2 hours, again confirming every chart since the 10 min.

This is what I mean by using short term price strength to your advantage and let the trade come to you, I'd either short IBB on a move above or enter the 2x short, BIS on a move below its range or above the range of IBB/BIB.


Market Update

It looks like the IWM has hit the initial stop level, right at a psychological number, $117.50 which is right about at the lows of the first breakout day of 12/18 at $117.47.

 IWM daily chart has now completed the Crazy Ivan shakeout, both sides of the range have been shaken out with head fake moves.

More importantly, the initial stops for the bull trap have been hit at $117.50.

This is the IWM intraday, note the large volume spike at the white arrow, that's the stops being taken out at the $117.50 level. This essentially completes the first and second half of the forecast and moves us in to the 3rd.

Intraday breadth has shown a lot of selling with numerous pokes below -1250 and one near -1600, which is extreme.

However, the chances of an oversold corrective bounce , like a vent valve letting out excess pressure, is becoming more likely and we are getting much better evidence of this than what was available this morning which was virtually nothing. Again, I can go either way, we haven't even scratched the surface of projected near term downside to say nothing of a bear market and my personal account is up +3.25% today so if we don't bounce, letting the shorts that are in position continue to work, works for me. If we do bounce, that's added opportunity which also works for me.

As an example, 

 For the SPY, the 2-5 min charts (2 min above) have intraday positive divergences in them, this is the near term bounce scenario built from late last week and today on a short term  oversold basis.

However the probabilities remain with the 10+ minute charts, I don't think I need to point out the negative divergence or the fact that these are much stronger divergences. This is why I have said, if we get a bounce, it's an opportunity we can use to our advantage and I'll show you one particular asset that is primed for a great entry on a bounce. If no bounce, then no harm, no foul and the shorts continue working.


I had captured this 15 min SPY by accident, but figured I'd add it as well so you can see the highest probability despite any near term moves, thus those near term moves if they materialize, like a bounce, are a great opportunity for short entries, add to positions or exiting longs.

 The QQQ (1 min) shows the same thing as SPY in the intraday 1-5 min charts and...

The same thing in the 10+ min charts, clearly negative, this is and has been the direction of highest probability (DOWN).


The IWM 3 min also shows a positive divergence being created, but yet again...

The much stronger probabilities are to the downside (15 min negative).

So any short term strength in price on an oversold bounce would make for an excellent entry, letting the trade come to you, rather than chasing . I suppose if you have the risk tolerance and the ability to keep your eye on the market all day, an upside bounce could be traded, but I prefer just letting things sit as they are, sticking with probabilities and if we get the bounce the intraday charts are suggesting, use that to our benefit as the stronger/big picture probabilities are firmly stacked against the market and in this way the trade comes to us with very little risk and we stay on the side of probabilities.

As I said, in the next post I'll show you a group that is primed for just such an entry.


UNG / UGAZ /NG Update

The last UNG update was 12/24, forgive the spelling, UNG Updateu .

From the linked update above (sorry it's so long, these are excerpts though and I think I need at least this much to get the gist of the update across):

"As to the recent slide in Natural gas, I wasn't able to cover it last week as it happened, but I believe it to be a short term event, one that was not easily predicted unless I am able to deploy the same analytical tools to forecast weather as accurately as the stock market, I'm sorry, but I'm not a weather forecaster and it's these types of fundamental events that are not reflected in the charts because they are not known, they are surprises that are only discounted after the fact which is exactly what happened after last Thursday's EIA Natural Gas report at 10:30 a.m. as usual...

 I still have about a half size position I can add to UGAZ long as I was looking for lower prices to fill out the position. The most recent range in yellow to the far right looked like it would be a suitable entry on a head fake move below the range (of 1 -3 days) and a swift move up-following all of the same concepts that preceded this range, just in smaller scale.

However, at last week's EIA Natural Gas Inventories a few things happened....This is last Thursday's Nat Gas inventories knee jerk reaction, initially higher at the 10:30 release and then lower, not unusual and we didn't have any strong 3C signals that would suggest anything specifically was going on, it turns out we would not have had those signals because the reaction to the EIA report was a fundamental news reaction, meaning it was new information that the market had not discounted and thus the rapid decline as the market sought to discount the new information.This is not something we can predict, it's like trying to predict a 9/11 type event, it just happens, there's no advance notice any chart can give you, yet the market will act swiftly to discount the new information.


November of this year began a strong cold snap, some of you may recall the 7 feet of snow in parts of New York, but since then it has become uncommonly warm, right now as I write this Buffalo, NY which saw 7 feet of snow in November is unseasonably warm at 57 degrees. Boston at 45 degrees, even Chicago is above the freezing mark at 39 degrees- so much for a white Christmas. In Anchorage, Alaska some residents are wearing shorts and t-Shorts as the total snow-fall is some 2 feet below the average for this time of year.

Again, I'm no weatherman, but I do know that Winter didn't officially start until December 21st and runs through March, the possibility or even probability of colder weather remains. While this has little to do with the macro theme, it has a lot to do with a potential new position or in my case an add-to to fill out the partial UGAZ long position that' at about 50% of a full position.

This however is not what caused the volatility to the downside starting on the EIA report at 10:30 last Thursday. EIA reports for Nat Gas inventories have been positive for nat gas prices most of the last year,  however something changed with last week's EIA report,  a draw of 64 billion cubic feet from stocks , however for the first time they reported that inventories stood +0.2% higher than inventories a year ago at this time, this of two major events is what traders chose to latch on to, the first time inventories were higher than a year ago even though they remain -7.3% below their 5 year average for this time of year.

Inventories have remained higher than usual the last few weeks due to unseasonably warm weather, if the trend continues, the 7.3% below the 5 year average we currently see will start to be chipped away at.

However, traders may have missed the forest for the trees or they may have intentionally done so because they did in fact see the forest and used short term events to allow them to accumulate based on longer term realities and the longer term reality is this...

The day before inventories were released, Governor Cuomo of New York banned Hydraulic Fracking in the state. New York has large Natural gas reserves in the Marcellus Shale that runs through the state, making the actions taken by the governor the most significant region to ban Fracking over health and pollution concerns. It doesn't take much to realize that the unseasonably warm snap pales in comparison longer term to the actions NY state has taken that ban the process by which Natural Gas is obtained and in the largest region thus far effected by such a ban.

While the shale region runs from Virginia to the Canadian border, New York's decision may be an important precedent that lowers the volume of natural gas, then this becomes a simple supply/demand issue favoring higher Natural gas prices, irrespective of longer term geo-political developments and US Energy independence. It "seems" traders focussed on the forest of the .2% higher inventories rather than the news the day before of the NY state ban, although it may be that they actually are taking the long view and using the short term .2% issue to create lower prices to accumulate ahead of anticipated higher prices starting with the NY ban and perhaps others to follow not to mention the geo-political events, although Thursday and Friday saw 300k contracts traded so maybe not, but the overall news, which is why I almost added to the UGAZ long today as the EIA released nat gas inventories at 12 p.m. looks bullish for Nat Gas prices, I just figured we are low enough that a few more hours of 3C data can't hurt, and I'd rather have probabilities in hand which I can't get in an hour than to just jump in, although longer term I think this is very positive."


NOW FOR THE CHARTS...
First I want to look at the larger trend as this has always been a longer term idea, not a trade so much although we have traded in and out of it. Looking at the longer charts tends to reduce noise and give us a feel of the overall underlying trend.

 This is the intermediate 15 min chart.

This is the longer and stronger 60 min chart.

 And for a long term trend perspective, the 2 hour UNG chart.

However I also looked at Natural Gas futures as well, NG.
 Starting from the longest timeframe, 1 day

The 30 min chart has seen some sharp 3C moves to the upside recently.

As has this 7 min chart. Note the small negative to the far right and the pullback area at the white has mark, that area is the chart below ...

This is the intraday 1 min NG chart.

I was close over a week ago to filling out UGAZ long, but wanted some additional data as I only had about 2 hours at that point and waiting for that data seemed well worth it.

Overall, I think this is a pretty decent area to fill out the UGAZ position or UNG long, or start a new position.

I like what I see above so I decided to take action now. I would remind though that I see this as a more secular move in Energy, one toward US energy independence based on the many reasons listed in the last update linked above as well as the market "seemingly" not having discounted the New York decision on fracking.

Trade Idea: (Longer Term) UGAZ Long

I'm going to go ahead and fill out the UGAZ (3x long natural gas) here. I've held a partial (50%) size UGAZ position for a while looking for the right time and place to fill it out. I did post a recent update for UNG and will post charts just after this.

Leading Indicators Mixed Bag...

As Europe is closing very ugly, I thought I'd peak at Leading Indicators quickly. I usually don't like looking at Leading Indicators this early in the day, but there's an exception based on what they started to do last week.

As far as VIX short term futures, VIX, HYG (the price vs SPX, not the 3C 1 min divegrence), and TLT, they are all in line nearly perfectly with the SPX intraday, no leading strength, no leading weakness.

TLT/bonds being generally in line has resulted in yields which are a great leading indicator, also in line today, for example the 5 year and 30 year vs the SPX...
 5 year yields nearly perfectly in line with the SPX which doesn't give us any hint of an advantage one way or the other just like the VIX/VXX/TLT/HYG relative price performance vs SPX.

The same is true of the 30 year yields/

My custom SPX:RUT Ratio is positive and not confirming price at these levels.

Also as noted last week, pro sentiment has been running to the upside near term as an additional indication of late last week's apparent base formation attempt for an oversold (1-day) bounce.


Credit (HY) is also showing some interesting things as well.
 HY Credit vs the SPX first leading it lower, but now in a small positive dislocation/divergence vs SPX (green).

HY Junk Credit is doing the same

as is PIMCO's HY Fund.

Again, if we bounce it's an opportunity, if we don't then shorts keep working, although they haven't even scratched the surface of the move to the downside envisioned in the 12/12 forecast as they haven't moved below the bull trap trigger area yet, at least not in SPX. Despite Europe's ugly close, I suspect there's still a good chance of a small bounce in the market which again, I'd use as an opportunity, but I would not (personally) try to trade any such bounce as the probabilities are just stacked way too high in the other direction.