Saturday, September 29, 2012

COT Data for Commercial Traders is in, can we confirm?


USD:

COT report shows that commercial traders have been more urgently moving to the long
side, as if they are in a hurry to get into position for an up move.


Also the report showed British pound futures, where the commercial traders are net short the pound (long the dollar) in a big way.

Oil:

Strong correlation between crude oil prices and the exchange rate between the Canadian and US dollars. Using the COT data for the Canadian dollar futures as a surrogate sentiment indicator for crude oil, the past week shows a fairly urgent move toward a bigger net short position in the Canadian dollar, even as oil prices have already been pulling back. Note in May 2012 the same thing happened and it resulted in a drop of more than $20/barrel. Are currency traders betting on a pre-election release of oil from the strategic petroleum reserve, in hopes of skewing the election results?

Gold:
COT data also indicates a big drop coming for precious metals prices. Gold futures, where the commercials have jumped up to the biggest net short position since just before the big top in 2011.  They were a bit early of the final price top, but they did get proven right when gold prices declined almost $300/oz drop.

The bottom line, an urgency to go long the $USD after the $USD or US Dollar Index already had a significant move this week. Remember, the $USD trades primarily inversely to most risk assets, a strengthening $USD typically means lower oil, equity and historically before Central Bank Intervention, the precious metals. 

There also seems to be a round-a-bout move to get short oil in front of the US elections on thoughts there will be a release from the Strategic Petroleum Reserve, which is kind of crazy as oil is near the top end of its historical storage range, gas prices are not nearly as correlated to oil stocks as common sense would have it, so whether a SPR release will have an actual effect, no effect or a placebo effect, Commercial Traders are betting on a SPR release-perhaps the October Surprise of election year politics?

Yesterday I said the market is trading as if QE3 was never announced, in a pullback scenario I expected to see or at least I was looking for large accumulation as pros aren't going to chase prices higher, they'll bring them down and accumulate and then send them higher, but a noted yesterday, there just isn't any consistent sign of large scale accumulation in to price weakness.

Gold has to be one of the strangest assets as there's little arguing with the wisdom of owning gold during a deflationary dollar cycle, however in the same report, traders are betting on a stronger dollar and thus far that's what we have seen, it seems almost as if QE3 was never announced or it was so front run and priced in that there seems to be little viable upside. I don't now what the reasoning is, I'm just floating ideas, but the charts and data are what I want to follow as I have for years even if I don't understand the reasons at the time, many times we have been rewarded for going where few go and common sense doesn't seem to apply, but in the end, the signals are usually correct and eventually we find out why, but if you wait for the reasons, you missed the trade.

So can we confirm any of this data?

* None of these charts are meant to be trading signals, they are too broad for that, we are looking at the longer term trends to see if we can verify the COT data which would give us a distict understanding of how QE3 is being viewed and acted on at least initially, they may change, but as I said the first day it was announced, my emotional side wanted to close all shorts and go full long just because that's the Pavlovian-like conditioning we've had toward QE, I resisted that urge and said we'd look at the data first and not make emotional decisions and good thing we didn't at least so far as the market has certainly not acted like it's in a mood for risk appetite as the broad averages move lower since.

Again, we can look for opportunities on a trade by trade basis, this is just to look at the Commitment of Commercial traders and see if what the data is saying can be confirmed with 3C.

First the $USD and Canadian Dollar, the COT data suggests a long $USD and short Canadian Dollar which will tie in to oil.

Remember, these aren't trading signals as they are too broad for that and this doesn't suggest a straight line move, there will be bounces and volatility, but if we get the big picture correct, we can use the smaller moves (bounces and volatility) to position ourselves with the least risk, the best entries and probabilities.

US Dollar Index -I can only look at day+ long data here so we'll also have to use UUP for intraday data.
 The Dollar Index-DXY0 on a daily chart shows the negative in 2010 leading it lower, then confirmation on the move lower, then in the summer of 201 a positive divergence sending the $USD higher and confirmation of that trend, in fact while 3C continues to confirm the trend, there's a large leading positive divergence as price is lower than the 2010 top, but 3C daily is significantly higher. This isn't what conventional wisdom would suggest in a dollar debasement environment.
UUP for intraday
 4 hour shows several negative divergences and recently around the QE3 announcement, the start of a leading positive position in 3C.

 The 60 min chart shows the same leading positive position as the COT data would suggest.

 The 10 min chart also shows the same leading positive divergence.

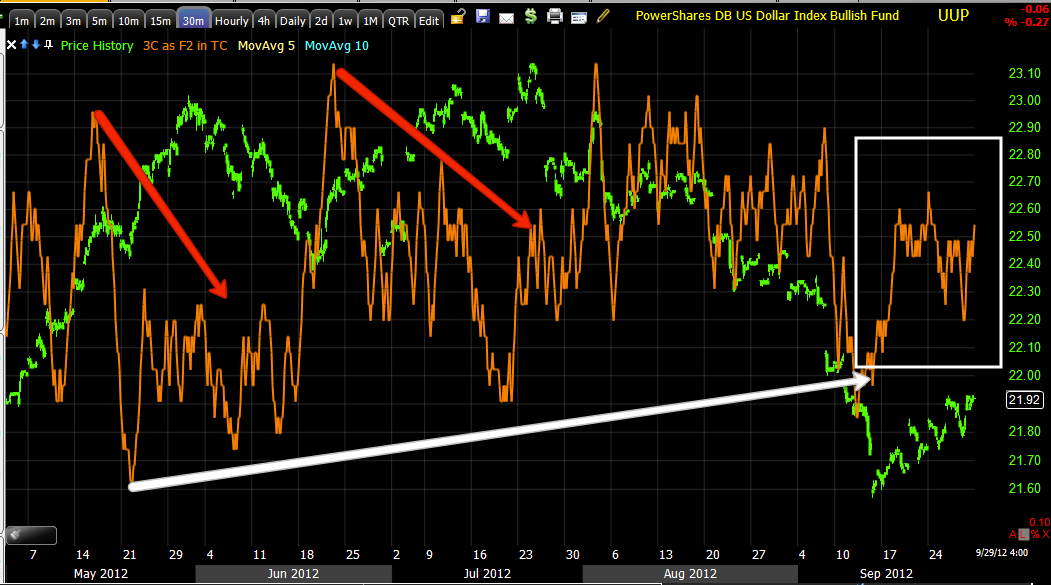
Canadian Dollar-COT data suggests the dollar long, the Canadian Dollar short.

 4 hour CAD with a distinct change in character as of the 13th or thereabouts, why was this in full uptrend confirmation and then suddenly go negative on the QE3 announcement, that's a big change.

 Same with the 60 min CAD, a positive divergence sending CAD higher and then a distinct 60 min 3C change to the negative.

 30 min CAD shows a relative negative at the area of the 13th, but more importantly the leading negative divergence after hitting new lows on the chart in 3C.

The 5 min chart shows the very distinct distribution after QE3 announcement and a new leading negative low in 3C.


 Even the 2 min chart shows the abrupt change at Qe3.


USO-Oil
 4 hour chart from positive to confirmation to a large relative negative to an even stronger leading negative-this doesn't mean short term USO can't bounce, but the trend here seems clear.

 60 min USO negative at the QE3 area,

 15 min USO negative at a head fake upside breakout right after QE3 was announced and downside confirmation since.

GLD/Gold
 4 Hour chart shows accumulation, confirmation of the move up and a distinct, clear negative divergence after QE3, a leading negative divergence that is very sharp.

 60 min GLD also goes from confirmation to leading negative right at the move up the day of QE3 and the 14th- new lows for the chart.

 30 min GLD negative at QE3 on relative negative divergences and a head fake breakout with distribution.

 I noted yesterday the 15 min leading negative divergence that formed the last few days, very strong and clear.

 10 min GLD leading negative position in the range.

 5 min looks like the 15 with a recent leading negative the last 2 days and the distribution at the head fake breakout on the 21st.


Even the 1 min chart shows the head fake move on the 21st as distribution, a move up short term on a positive intraday divergence on the 26th and again that same leading negative on the 5 and 15 min charts.

I can't explain to you why the market is acting the way it is, for me it's little more than a curiosity, I just want to be in the right place. With 3C confirming the COT data, it seems the underlying trade i much different than the conventional QE wisdom, at least for now.

It's one thing for 3C to be saying and showing us these things, but when the actual commitment of traders (Commercial) is telling us the exact same thing, I think it warrants a little more weight.


Friday, September 28, 2012

This Week

Pretty dull...

-High Yield Credit closed at the lows of the day, but held up slightly better than the SPX on the day.

-High Yield Junk Credit only lost about half of the SPX on the day, it traded much like the SPX intraday.

There are several notable features on JNK's chart, first a negative MACD divergence between July and present, I never use traditional indicators in traditional ways as there's no edge is seeing what everyone else sees, so the settings are longer (24/52/9). Wilder's RSI (short setting of 6) is negatively divergence as well when comparing the yellow trnedline on the indicator and price, RSI should be higher.

I often point out the reversal candlestick on volume concept that works so well on virtually any timeframe. At the green arrow we have a "Hammer" bullish reversal candlestick on increased volume, the next day a reversal (remember I always point out that there's no way to judge how long the reversal will last, it's just a reversal of at least a day). At the red arrow today we have a bearish "Shooting Star" candlestick on rising volume. To remember these candlesticks and their meaning, the hammer looks like  hammer and should be found after a trend down, "The market is hammering out a bottom". The "Shooting star" should come after  move up and as the Japanese say, 'A shooting star portends trouble overhead". Finally the body of the Shooting star is within yesterday's body which also makes it a bearish reversal "Harami" or what we call in the west, "an inside day", the Japanese call it, "Mother with child".

As for the EUR/USD...

 The Euro declined since 12 pm today, one way to get a feel for intraday trade would have ben to look at the Euro vs the SPX in which the SPX topped at 1:43 p.m. while the Euro remained in decline, without the support of the Euro or a weaker dollar, further upside in the market was not probable.

 On the week the Euro lost ground and closed just a few pips off the week's lows, in green is the initial knee jerk reaction to the Spanish 2013 budget, short lived.

As pointed out in last week's wrap, the Euro was just above resistance and not looking like it would hold, it closed back under resistance this week as $1.30 remains a key technical and psychological level.

Overall since the announcement of QE3, the Euro remains closely correlated with the SPX.

Yields which have been an excellent leading indicator topped out today about 30 mins. before the SPX topped out. Yields have also been closely correlated with the SPX since QE3, but they are significantly dislocated between August 16 and Sept. 14 (a month) with 5 year yields down -12.4% vs the SPX up +3.55%, this traditionally has been a strong reversal signal for the market.

Of the 3 most important industry groups, Tech, Energy and Financials, Tech had the worst week since last Friday, down -2.22% vs the SPX at -1.35%. AAPL closed near the lows of the day, and lost more in After-hours in the $666 area.


The defensive Utilities group was the only of the 10 major industry groups to close green on the week at +1%, you'd hardly believe QE3 was announced the way the market is trading.

Transports continue to suffer and diverge from the market, IYT closed within $0.15 of making a new closing low for the year.
Transport are the end of the line for manufacturing and thus paint a portrait, although not much can be as bad as the actual manufacturing data hitting 3+ year lows across the board.I know airlines are also facing trouble, Lufthansa had bad news today as their savings efforts have been thwarted by higher fuel costs and a weak economy (I actually like their airline, although the passengers are unruly in my experience).  Closer to home here in South Florida, American Airlines, the 4th largest private employer in South Florida has plans to lay-off about 1500 employees here.

We've heard from the world' largest shipper this week, Maersk and the news wasn't good as mentioned yesterday. The Baltic Dry Index, a daily index of the cost to ship dry goods is near 3 year lows.

There was a slight uptick on September 17th, but tht' fading already and I'm pretty sure we'll see new lows shortly.

The US Dollar index gained +0.75% on the week, with oil seeing a -0.90% decline as the two have an inverse relationship,the PM's, gold and silver actually closed the week just about unchanged, but there still appears to be some trouble coming for GLD.

The 15 min chart for GLD has worked very well, calling a negative divergence on the breakout above resistance that now looks like a head fake move on the 21st, it lost ground from that negative divergence and saw a deeper leading negative divergence the next two days and gave up ,ore ground on the 25th on a gap down. From there a relative positive that sent it higher, but in to higher prices, we now see one of the worst leading negative divergences.

It's a very strange market, it doesn't trade at all like QE3 had just been announced. I thought after the QE3 announcement one theme we might see is lower prices so institutional money can accumulate , preparing for a QE ramp, but we just haven't seen that anywhere consistently.

I'll be adding any new information I dig up over the weekend, in the meantime, enjoy your weekend!


Glad I closed the majority of URTY when I did

That was a nasty little close. In any case, on a day when not much happened in the market, it was nice to make a few percent.

As a few asked today what I'd be doing with URTY, my answer was, "If there's not a strong enough signal to entice me to buy it, I have no reason to hold it".

Market Update-The Averages-Unimpressed

If these charts look rather dull and uninspiring, that's because that is what they are, perhaps the holiday week, perhaps Friday, perhaps hesitation to take on risk over a weekend. One thing I try to tell members using 3C is, "Don't torture the charts looking for a signal", it's either there or it isn't, you can always find some little jiggle and call it a signal, but a real signal, a high probability signal is the one that jumps off the chart, for example...

FB This is the same 60 min chart, just a wider view and a closer view.
 With the long positive divergence on a strong 60 min timeframe, FB accumulation was a strong signal worth taking, FB ran up  and then gave another signal last week.

A closer look at the same 60 min chart reveals a negative divergence in to higher prices on an important timframe-60 mins, this was impossible to ignore, it's why I posted last week that FB would pullback even before it started and as it was making higher highs in price, that's a hard signal for some to take as they are making money, but it was the correct call and there was no searching the chart for the signals, they were clear as day.

Perhaps in addition to the other things I mentioned above about weak signals today (as already seen in futures), QE3 may be causing confusion among traders as for the first time in QE history, the F_E_D was front run, the market priced in QE months before it was ever announced, at ;east 3 months which never happened before.

Now that we have two QE's under the belt, we know that it can push asset prices up, but it has little effect on the economy. The banks that will be selling the MBS to the F_E_D may not be in the best shape and "may" not act like they did in QE1/QE2, they may retain capital. Lastly as we saw with QE1, the effect on the market is dynamic, QE1 started out as a failure as far as asset prices were concerned, it was only months later when the F_E_D upped the ante and added more MBS purchases and for the first time Treasuries that QE1 started to move asset prices. QE 2 started with a bang before it even started as Bernie told the world it was coming at Jackson Hole months before it came, but before the program ended, the market already was selling off so the QE effect is not a constant and there are many ideas as to the effectiveness of giving up al your surprises, going all in and many other issues like dividends being lower now, P/E ratios being much higher (stocks are more expensive), earnings disappointing , a manufacturing recession and likely a GDP recession soon. Stocks aren't cheap, one could say they are in a bubble.

If the market and economy were very healthy in 2004-2005 supported by huge consumer spending which came from the value of rising homes and employment was at the F_E_D's mandate, then consider the economy now vs then and asset prices between a healthy, humming along economy and one that is on the edge worldwide.

Does anyone really think we can compare the economy back in 2004 to the economy now and reasonably expect asset prices in the SPX to be 34% higher?

To be clear I'm not advocating selling the market on common sense principle, that's not how things work. If the market wants to give, then we should take no matter how unreasonable it may seem, the market  long ago ceased to be a discounting mechanism of value. However, when a bubble forms, you are well advised to take advantage of it, but to be cautious and to never try to convince yourself, "This time it's different" as centuries of bubbles, all the way back to the 1600's Dutch Tulip Bubble have shown us time and time again.

In any case, I've ventured off the path.

Here's the market update.

 The DIA believe it or not is one of the better looking charts intraday, but that's not saying much. There's a leading positive position on the 1 min above yesterday's readings.

 A closer look reveals an early positive and that leading positive we saw form quickly before noon time and pretty much in line since then. There are several short term signals that look like a rally in to the close to fill today's gap looks likely. Still, this isn't the positive divergence that would be expected as the point of a constructive pullback.

 DIA 3 min positive yesterday around the Spanish budget details in the a.m., negative at the highs and leading negative toward the afternoon. There's nothing to see today.

 DIA 5 min, again the same principles described above for yesterday, today a market that is just moving to fill a gap more or less, nothing special here at all.

 IWM 2 min with distribution yesterday, an early positive today and that leading positive before non, since a relative negative , again, the point of a constructive pullback in the case of a bounce like this is to bring prices down to a lower level and aggressively accumulate them, carving out a larger positive divergence.

 IWM 5 min, I had hoped this would hold up and not see deterioration, but it has during the day to move in line with price rather than showing a positive and holding up.

 IWM 15 min  shows an intraday negative divergence as price moved higher on an intraday basis today. Still this chart alone doesn't look that bad and if the shorter timeframes looked better, I'd say it's capable of supporting further upside on a bounce, but they way the 5 min chart went, it almost looks more likely that deterioration will migrate here, this is one of the reasons for closing the 3x long R2k position.

 QQQ 2 min with a negative yesterday, early positive today which really was just enough to move prices as they did today and an inline status.

 QQQ 5 min, negative yesterday, the same small positive in the a.m. which is enough fuel to move the Q's intraday as they have.

 QQQ 10 min, that noon time leading positive today, but nothing else.

 SPY 1 min is leading negative here

 SPY 3 min is negative at the afternoon highs

The 10 min chart does look decent, but again from today's behavior, it's more likely to see negative migration unless Monday we see accumulation on the short term timeframes.

As it stands now, I'm deeply unimpressed and don't see any reason on these charts to expect a big move on Monday to the upside, at least not based on anything that happened today.


URTY position

I will be closing 75% of the URTY position before the close based on no clear signal to keep it.

Futures Update

As futures lead the market and are a larger market where most traders are on the institutional side, I've found they have helped our analysis tremendously since we started covering them, although they need to be viewed in a different way than the stock/ETF/market averages as futures trade 24 hours.

So we'll look at futures and then look at the averages and see where we are on the continued  bounce or anything else that may have developed.

First the S&P e-mini futures and then the NASDAQ mini futures in the 1, 5 and 15 minute timeframes for each.

 ES 1 min as of the 9:30 NY open, a positive divergence at the lows in the mid morning trade sending ES higher only to see a negative/leading negative divergence in afternoon trade just before 2 p.m. which I am not passing judgement on as I had hoped to see prices stay subdued while positive divergences built, if we were going to carry on with the bounce.

 The ES 5 min chart negative yesterday as we well know and nothing better than in line with price today, no positive or negative divergences here.

 ES 15 min with confirmation of the move up at the green arrow, confirmation ended as a negative divergence set in yesterday taking the market lower, an excellent signal and the 15 min chart is lagging price today. This is less positive than I had hoped to see if we were to continue our bounce.

NASDAQ futures.

 1 min as of the 9:30 NY open were mostly in line with price until the negative divergence just before  2 pm and on the pullback intraday the chart is inline.

 NQ 5 min with a very nice leading positive divergence Wednesday which fit all our short term analysis from 3C to dominant price/volume relationships for an oversold corrective bounce; that move was sold in to yesterday at the red arrow/negative divergence and thus far 3C is in negative territory vs price, no positive divergence here, certainly nothing like Wednesday.

NQ 15 min going positive Wednesday right on the open and throughout much of the day, then confirmation at the green arrow and as seen market wide yesterday, a negative divergence, the relative positioning tight now appears to be slightly positive, but it's actually closer to in line.

The bottom line for today is it appears there has been very little activity in institutional trade which is not unusual for a Friday and holiday week (Jewish holidays).

Now to take a look at the averages as they will give signals that will typically be picked up the next trading day.