Thursday, March 3, 2011

Some Speculative Trades

These look ready to pop....

BIOF
 60-min chart of BIOF, I like this in the area of $1.00 with a stop around $.85


 Accumulation on the 15 min 3C chart...

 And on the 1 min, look for this one early as accumulation seemingly occurred late in the day

CDTI (long)
 Daily chart of CDTI-nice volume.

 Accumulation on the 15 minute chart...

 Same with the 5 min, it looks like it's coiling up for a new leg up.

 I like this one around $6.40 with a stop just below $6.00

PEIX (Long)
 60 min chart, again nice volume here. I like this one early, maybe around $.77 with a stop just under or just above $.70

 The 30 min 3C accumulation

And the 1 min chart suggests this may also move early in the morning.

This very well may be market moving

We saw an overreaction today to Hugo Chavez, I wonder what this might provoke in the market given the technical stance observed tonight.

China and the revolution that wasn't

Imagine the calls for protest in China truly ignite, Chinese officials are extremely worried about it, so much to the extent that they have threatened journalists and warned against covering protests. See the story here.

This is absolutely incredible, who would have imagined the world would look like this late last year?

Unemployment/Underemployment

Earlier today I alluded to the difference between government reports and those from the private sector who really don't have a dog in the fight. Well here's what I was talking about. Gallup finds underemployment at nearly 20% this is the same as the Fed's much under-publicized "U6" number (they report U3 which is about half). If you work 1 hour a week, you are on U6, not U3 and thus not in the mainstream media.

I have said again and again, the employees that we get at my family's cafe are architects, Starbucks managers, etc and they are willing to work part time for minimum wage because that's the best they can find.

So here's Gallup's take, probably a lot closer to the real deal. And just to compare, at nearly 20% and measured the same way unemployment was measured in 1929, remember that the Great Depression's unemployment peaked at 25%. We're nearly at 20%.

When I was listening to Bernanke, I said he "Was Schooled"

By Senator Toomey. The disagreement was on the Taylor rule, which is an essential policy formula to setting interest rates. Bernanke argued that Taylor supported a different variation of the rule 6 years after the original formula.

Interestingly in a blog post, Taylor, the creator of the rule agrees with Senator Toomey and thus Bernanke who in part has justified quantitative Easing on the Taylor rule, doesn't even understand what the man who created it believes. The end result? QE is based of Bernanke's misunderstanding of the Taylor rule, that's a pretty big "ooops".

Here's more of the story and I'm sure right about now, Bernanke is hoping to never hear the name "Taylor" again in his lifetime.

As for my own call on getting it right, it was simply this-"Bernanke was schooled by a Senator who understands economics better then the Fed chairman".  Now I'm even a little embarrassed.

PRICE/VOLUME RELATIONSHIP IS IN

As I suspected it is Close up/Volume down and it is overwhelmingly dominant so the chances of today having created a 1-day overbought condition are very good. This is not good news for the rally/bounce, it doesn't mean that it is totally done, but the chances go up significantly when the P/V relationship is as lopsided as it is today. Of the 4 relationships, it is easily double the second most dominant relationship, and in many cases somewhere around 65% of the 4 possible relationships.

Another Perspective

Very simple, yet still effective, Wilder's RSI on the majors

 Dow-30


 NASDAQ 100


 Russell 2000


S&P-500

ALL NEGATIVELY DIVERGNT

Market Update

I feel a little better right now saying that our bounce's distribution cycle has begun looking at the chart's below. Whatever the plan was before today, I think institutional money took today's gains and used them to sell into or at least start the process. It doesn't mean that tomorrow we'll be down, although there's a possibility especially if the Price/volume relationship is strongly biased tonight, we may have reached the same type of overbought that we saw (except oversold) on our big day down, Tuesday. I'd still wait for price confirmation before betting very big, but the shorts mentioned recently, should be in pretty good position to start phasing into. If you need updated entries/exits on any of them, let me know.

 DIA 5 min

 IWM 5 min

 QQQQ 1 min

SPY 5 min

So Far Hugo's Peace Making Wishes Have been Rejected

Lets all sing Kumbaya around a campfire in a Mr. Rodgers backlot set with Hugo Chavez strumming the guitar! Honestly, is this a scene from Bruno Part 2?


OK, so the market went on today like a little puppy piddling with the very thought of a peace accord brokered by Hugo Chavez. This is about as real a possibility as when he offered aid to Katrina victims. It just shows the market can be childish sometimes and smart money loves it when it does.


As I mentioned earlier, this is a no starter, as I said would happen, the rebel leaders have rejected the notion, France has now rejected the notion and the market, well it's still a little silly, but this is where we find opportunities. It's just a matter of when.


I still think, or hypothesize that whatever the market does in the next few days, there's still big trouble just over the horizon which is why I've been saying use these opportunities to get your toes wet in some shorts, raise some cash and get off long margin and today and days like it are the time to be doing that, not following the crowd.


When you have days like this, look at a weekly chart and see if you feel the same.


Gadhafi is going down, it's already written on the wall, it's just his choice and how much trouble he's going to create in the end game.


SLV Update

Ironically, the PM's which I find to be the most difficult to forecast because of everchanging dynamics, seeem to be the clearest right now, at least SLV

The question has been whether JPM has lost the corner on the Silver Short or whether something else entirely different is happening. We had this breakout and it didn't look a lot like short covering so we have been watching it for signs of a possible reversal. Reversal to where is what is important. It seems the reversal is starting, to where? Well that's what we want to find out.

 SLV 5 min showing distribution-there is a small positive meaning we may see some intraday upside today, but the larger trend seems to indicate the reversal has begun, whether it's a pullback or breaks support is the question and where the good trade either way will be.


 10 min 3C negative

And the 15 minute is where we see reversals start most frequently, it is moving into negative territory.

USO Update

 Recent 1 min negative in USO suggests an intraday pullback...

 The 5 min is leading, look at 3C compared to the two relative points in price (green trendline)

 Technically, other then no follow through buying, USO remains ok on a daily chart.

Here's the hourly Trend Channel and I'm guessing at some point we may have a test of support at the breakout level, also where the Trend channel is right now. Events will dictate the short term trade in USO in my opinion, but longer term, I think events suggest oil moves higher, especially into uncertainty of a military engagement with Libya over the weekend and early next week.

Market Update

Some strange readings, but they are what they are.

DIA
 3C 1 min in a negative divergence compared to yesterday's levels, but there is an attempt to confirm, this is a relative negative divergence as 3C should be higher then yesterday in true confirmation.


 The 5 min chart with a "possible" negative divergence brewing, it needs to turn down to confirm

 The Advance / Decline Ratio of the Dow 30 has been going down most of the day, now we see a pump, this is the strange part, not sure if I trust the situation, I trust the indicator, but at these gains that extra pump seems out of place.
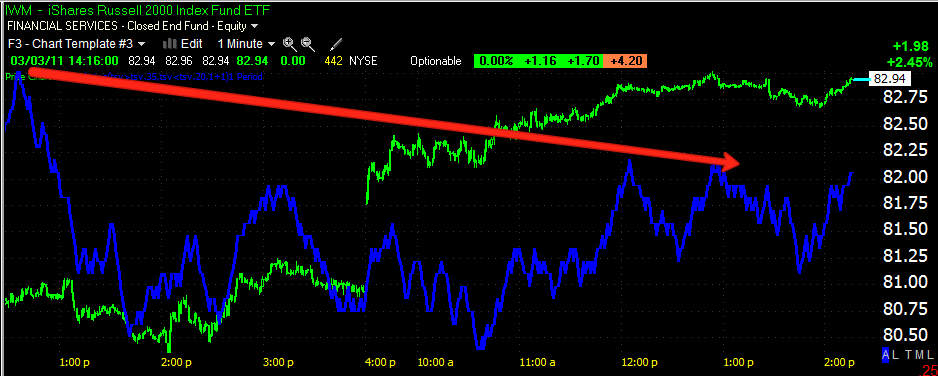
IWM

 IWM 1 min 3C is the same, it's trying to confirm within a relative negative divergence.

 If I zoomed in and didn't consider yesterday's data, you can see the attempt to confirm, although it's still a relative negative divergence.

 The 5 min chart is looking bad here -this one makes some sense....

 Because of the A/D chart looking the same on the 5 min scale.

QQQQ
 1 min 3C, no attempt to even confirm, just negative and leading.

 The 5 min may also be starting a negative divergence, but again it needs to turn down here.

 The A/D line makes some sense with a recent surge, but nothing too remarkable considering the bigger trend for the day

SPY
 SPY is the closest to actual confirmation right now on the 1 min chart.

 The 5 min chart is the same as the others, it may be starting to go negative, but we need that turn down to confirm.

And the A/D ratio of advancing issues, less declining issues-another out of place recent surge...

on the hourly chart, again as I mentioned yesterday, we are at the target I was guessing we would hit-the top of the wedge, we may still see a move to $134.50 which is where I'd be very suspicious of a breakout and watch it for a false move. This is what I'd try to do if I were on the institutional side, I'd knock out the shorts from the decline on Tuesday and draw in the longs on a failed wedge, then I'd take the market back below $134.50 and trap the longs being that the market overall has a negative bias and events are very uncertain. Their job is to create as much volume as they can, you can see it's falling off right now, they aren't making money on falling volume, so a technical breakout that draws in the technical traders would do the job. That's what I'd try for if I were on the institutional side.

SPY Volume

Some extraordinary SPY volume close to intraday resistance.

I'm going to pull up Stockfinder and check the A/D ratio/lines for the averages.

USO Update

 USO has held up over the breakout level as support thus far, volume has been good on the breakout so it'll be interesting to see if this continues to hold.

 The 1 min chart isn't showing what I' call distribution, in fact there appears to be a little accumulation going on, whether that is some inventory purchasing at low levels for a longer term view or an intraday move, I don't know I'd suspect the first as there's no real reason to lift USO if you can buy cheap as it holds support.

 The 10 min is showing the dip and distribution into today, however, being the 1 min chart is not overtly negative, I'd suspect that this may be just picking up on the retail exodus.

 The most important hourly hasn't seen any changes and remains in confirmation of the breakout.

For those who want to tighten up on a stop, here's an hourly trend channel stop that has held the breakout trend, if there's a failure below the lower line, then I might have some more concern.

Interesting...

Here's a very quick look at some market bellwethers -There's either negative divergences, big sell side volume, or downright price drops.

 AAPL

 GOOG

 INTC

 MSFT

WMT