Friday, November 29, 2013

The Magic of Weighting

If Jesse Livermore only heard that title, he's be in total agreement, assuming you know why you are waiting, but that's not what I'm referring to. It's a shame people don't understand the weighting system each of the averages uses, then they might be able to better understand why 86% of NYSE stocks were above their 40 day moving average in January of 2013 and only 54% are above the same moving average now, this means the trend among the majority of stocks has been to fall, not rise as the averages would imply, once you understand that, you can also understand why stock picking (if you aren't just using a broad ETF like SPY) can be so important as you could be in that group of 30% of stocks that have fallen below their 40-day instead of rising with the market.

In any case, the Dow was one I mentioned today and its top components. Intraday the Dow hit +.47%, but closed red, down -0.08%.

The stocks I mentioned to keep an eye on because they were the top 5 weighted stocks were at gains earlier when mentioned (the first number) and at the close at lower levels:

IBM +.76% to +.35%
VISA +.33% to -.26%
GS +1.19%!!! to +0.43%
BA +.30% to -.37%
MMM +.33% to -.07%

If you looked at the same chart as posted earlier..."The Usual Suspects"  in which I show the Dow with its top 5 weighted components and the NASDAQ 1000 with its top 5, you get a feel for what is moving the market.

On the close, you see what the Dow's top 5 weighted stocks did and it took the Dow from a nearly 1/2 percent gain to a loss.

 The Dow is the candlesticks, the other stocks are labelled at the top.

It looks like the top weighted stock did a lot of the lifting today, IBM, but ultimately couldn't hold the Dow green.

Only 1/3rd of Dow stocks closed with a gain, only 1 (MSFT) was >1% at +1.41%, the second place was GS at .43m then a couple in the .30 area, a couple in .20, 1 in the teens and 1 at .01%.

In this case, if I used equal weight for all 30 stocks, the Dow would close down -.09, not far from the -.07%.

In any case, this hasn't been used for a while, I think QE2 we saw a lot of this kind of trading, volume was low enough the last 2 trading days that it worked, but that begs the questions, why did everything else stop working?

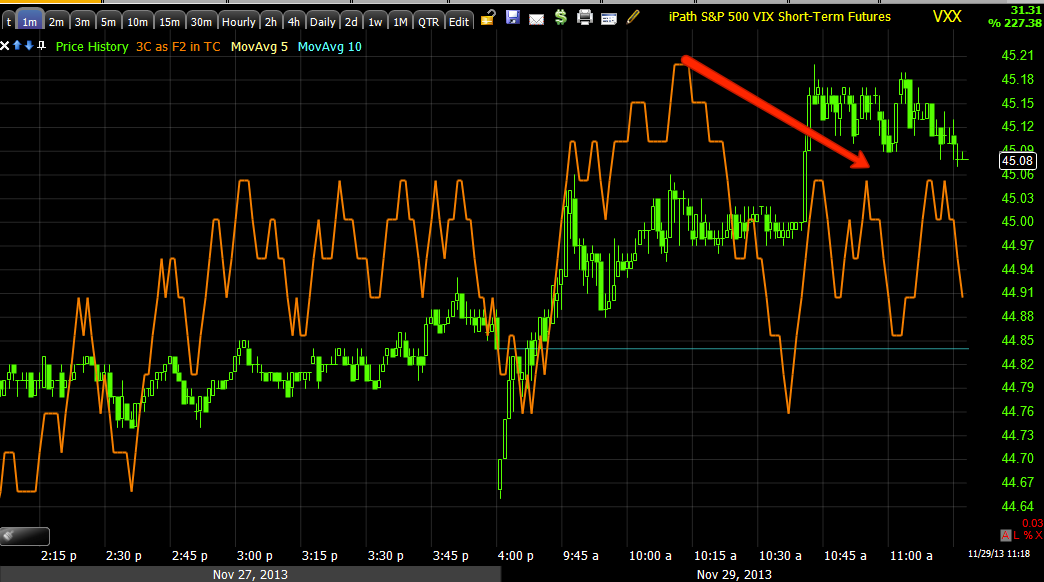
I'll have a closer look at the internals, but one thing I noticed right away is our spot VIX Bollinger Band squeeze that leads to highly directional moves is very close to breaking out in the direction assumed.

VIX BB Squeeze about to break out.

The new trading portfolio is doing well, it just got started this week and it has been a quiet week so I've had the time to keep up with it, hopefully I can keep that up. All positions were entered either Wednesday or Today and thus far of the 6, 4 are green and NUGT is the leader with a +7.84% gain, the only two down are PCLN, -1.13 and the 3x leveraged IWM short, SRTY, down 1.62%, everything else is up near 4%.


Market Update

It's not like we didn't have warning. So just before the market closes, a rush out of risk assets, a rush in to protection, but all of this was clear last night and my last "Quick Market  Update"

"Even the thin intraday charts are starting to break up now in all of the averages and AAPL, I'm guessing the other index movers as well, although I haven't had a chance to check them."

Earlier I talked about the thin Facade of 1 min charts moving the market, but nothing past that, 2 min negatives.

When you look at the averages, look specifically WHERE distribution occurred before price fell, this is important to understand how smart money works, how they buy and sell.

 SPY 2 min as warned about early today.

IWM 1 min intraday, look how negative, but also where, before price moved down, this was showing the distribution and what happens when there are no more buyers of what is being sold.

 QQQ 2 min

But all of this was predictable, this is why I could enter FAZ (3x short Financials) with little worry. These 5 min + charts have been horrible, if it didn't happen today it would have happened Monday.

TF 5 min

Remember I said the NYSE TICK was +/ -750, but spending more time in the -750 area, this answers a big part of the breadth issue.

 My custom TICK Indicator just losing breadth all day

 And short term VIX futures could not be held back any longer by intraday steering divergences, protection was bid in such size that it made no sense for them to try to defend against a rise in the VIX futures.

Since this was all weight based market movement and AAPL having the most weight in the market, this is why I followed AAPL today and mentioned it in the market update and have not panicked about AAPL bearish positions.

 AAPL 1 min eventually gave out after 1 min ONLY confirmation.

As I said, it was a thin veneer of facade and behind it was trouble like this 2 min chart.

Entries like FAZ today were hold your nose and jump in, but in reality you can't get a better price with less risk so these positions that are emotionally the hardest to enter, are actually the most sensible and least risky.


Trade Ideas: Reiterating UVXY (long)

This is looking great, the actual futures for VIX are looking great, spot VIX has a highly directional Bollinger Band Squeeze and we have this incredible chart as we have been seeing some of the most extreme 3C moves I've seen.

That move leading positive is a 30 min chat, most of you have seen 30 min divergences and they are rarely that linear without zigs and zags, that's strong underlying movement. The charts on either side are confirming, shorter show migration and a 60 min is moving in similar fashion as the 30 min migrates to the 60 min chart.

The only charts that are either in line or negative are 1-3 min (3 min) or intraday negative (1 & 2 min).

There's a beautiful rounding bottom, this is only important to me because of the "process", not because I've memorized a technical price pattern, but don't know why it's important.

Trade Idea: Reiterating XLF Short / FAZ long

I'll be putting FAZ in the trading portfolio account I mentioned last week I'm going to try to keep up with. I would usually keep about 6 positions, FAZ will be the 6th.

The others are : NUGT (long), MCP (long), UVXY (long), PCLN (short), SRTY (long).

I'll have charts up momentarily.


Quick Market Update

Even the thin intraday charts are starting to break up now in all of the averages and AAPL, I'm guessing the other index movers as well, although I haven't had a chance to check them.

Protection is being big, although on a lighter scale, obviously not many traders are around and they did the bulk of it already, however it's very clear of the VIX futures charts that there's just enough distribution to keep VXX from becoming an arbitrage nuisance.

The NYSE TICK also went mellow at + and - 750, right now more on the minus side, this shows there's not strong participation and likely as I showed earlier, the weighted index movers.

I'm going to look around and see if there's anything interesting in the trade category.

I repeat though, intraday averages' signals are falling apart.

MCP Popping

This is a stock that has almost no correlation with the market and one of the reasons I like it as a long, well the charts always come first, but the fact it moves independently of the market is great too and why I like it as a longer term and trading play.

Last Wednesday I posted "I'm just reiterating MCP long, I really like this one"

However last Monday were the words that really counted...

"I've been in MCP with many of you (long), it's down about -2.5% which is fine, it's the process it has been undergoing and it looks better and better with each passing day. Liking MCP (long) the way I do, I'd be VERY uncomfortable if I didn't have a position in place already."

There are some longs I really like, USO being one and MCP of course as I said, "I'd be really uncomfortable if I wasn't already in MCP as it was in an "Any moment" position.

This morning MCP is up nearly 6.3% and I believe this is the start of a transition from stage 1 base to stage 2 Mark Up. Even though it's up almost 6.3%, looking at the big picture, it's still in a very good area to go long, although I can't bring myself to chase anything like this, I'd wait for a pullback which will come.

And the words from Monday...

"There are numerous timeframes in between that look just as good, it's the short term timeframes aligning that make MCP look like it's very close to making a strong move up."

The key to multiple timeframe analysis, the longer chart's positives are the high probability of an up move, the short term charts aligning is the key to unlocking those longer term charts.

For those who want to see if MCP is worthwhile, I think it is, but let me show you and otherwise update MCP.
 Here's today's move thus far, a nice strong candle that opened near the bottom of the range and is now near the top, healthy.

The larger view of the base, this is significant. These are the longs I chose like USO of MCP , they aren't overbought and making fractional 0.10% new highs with distribution running through them, they have strong bases in place with accumulation running through them, these are the few longs I trust.

A base like that can support quite a healthy move.

 Last Monday (as we have been seeing in other assets we are trading especially recently) we have an extreme 3C move and this is a 15 min chart, that's not a 1 min chart, so that's a lot of underlying action.

This is the intraday set up, essentially market makers or in this case specialists as its NYSE (NASDAQ stocks generally have 4 letters to their ticker) are doing the last bit of stocking up as they know a move is impending, this is why the short term charts are so important in multiple timeframe analysis when the long term are already positive.

To put it in to realistic terms, the Specialists have already filled a nearly year long order, they know it's filled and ready to go, they make a market in the stock so they want inventory for the move to sell in to as about 30% of their trading is for their own account.

So for us, we want to see the long term charts with strong signals and then the middlemen getting in position like that 15 min chart and the one above, telling us that the play is going from an accumulation or distribution phase to the actual mark up or decline.

Overall, the long term chart I provided showing the decline or a bear market and how there were 5 weeks of rally that you'd barely notice looking back and a 40% gain you'd barely notice looking back, but how those are the types of intraday , day to day or week to week actions that are deceiving in price and would knock most traders out of the position, this is why it's a good to have objective evidence as to why you are willing to hold through those periods or trade around them knowing the trend will continue and while a 5 week rally is a lot, in the trend it was just noise.


Market Update: Skin Deep

This is why I really want to see the breadth readings, in a few hours I can.

However in the averages just as the Index futures, the support is skin deep, for instance...
 1 min intraday is or was in line, now a bit negative, but look how they ramp AAPL to make up for any fall off in momentum.

At 2 min, as I said, IWM's strength is skin deep

The same is true of R2K futures, 1 min in line

5 min leading negative and that hasn't changed a bit.

HYG intraday trying to hold the unchanged mark as an arbitrage asset.

However slightly longer and the skin deep facade peels away.

 It's the same with VIX futures, they run up, why would they run up with the market performing like this and the intraday 1 min "Steering" timeframe starts distribution intraday to hold them in check.

 While a slightly longer 3 min chart shows a text book rounding bottom with a head fake and with the 3C accumulation that we'd want to see.

The normal gold/market (QQQ) correlation of opposite or inverse as seen on a long term 60 min chart..

Doesn't hold any water today, the market up, Gold "Should " be down, but it's up pretty good because there's no arbitrage correlation, it's like the risk on assets are moving or the averages, but the flight to safety assets are as well, just not the correlated ones and the correlated ones like VIX futures you can see inrtraday steering of the 1 min chart, which is what we use it for, to see what they are doing with intraday price.

The Usual Suspects

Again, this is only possible in a low volume environment, otherwise its too expensive, but it's back to the way the Indices are weighted.

As I mentioned, watch the top weighted , Wednesday in the Dow it only took 2, one, IBM had more weight than about 10 other Dow components combined.

The Dow at last peak was up +.15, the SPX +.33 and the NDX +.56%

The top 5 weighted Dow components were all green, IBM +.76%, VISA +.33%, GS +1.19%, BA (even after that horrible 60% fall in orders this month) +.36, MMM +.33.

Visa alone is worth about 7 other Dow components altogether.

Top 5 Dow components vs the Dow.

And the NASDAQ, AAPL use to hold 20%, it's been changed and the current weight is known only to $10,000 a year NASDAQ subscribers, but AAPL +.97% is top weighted, then GOOG -0.12%, MSFT +1.73%, INTC +.21% and ORC -.06% and the NDX about +.56%.

 NDX top dogs vs the NDX...

 NDX vs AAPL alone
The TICK today vs the QQQ.

It will be hard to tell how many stocks participated to what degree until I can pull a breadth chart and those are memory intensive in RT, but I'll check later, for now the NYSE TICK will have to do.

USO 2

Here's the momentum, but here's some perspective because this is still a worthwhile position, I like 2x leveraged.

 Here's the perfect illustration of a head fake move and the momentum it creates.

 This is the next target, resistance and then at $34 which is no coincidence (whole number), but a larger view shows there's plenty of upside.

 This is what I have been posting for a month.

This is why, clear distribution sending USO lower, but this is almost like a massive counter trend move, the 60 min positive divegrence is what has given me the confidence to wait for USO, the accumulation is there, the position is going to move judging by the power of this divergence, I'd urge to to take a look at the trade, a stop can be placed under the recent lows as long as it's not an obvious area, but I don't think wee will be revisiting those any time soon.


USO

As posted last week, the Iran/Saudi conflict/capture of two Saudi fishing vessels in Iranian waters right after the nuclear deal over last weekend, sent crude below the basing range and I thought that this would be short lived as a knee jerk reaction.

In any case, I was looking for momentum to pick up at $33.50 and even suggested a limit order there which I never use.

These are the charts as I captured them, but as suspected, even on this low volume, momentum picked up as $33.50 was passed.
 CL/Brent futures accumulating at the knee-jerk drop...

The daily chart and the area where a shakeout becomes a head fake which creates upside momentum. These are seen about 80% of the time right before a reversal.

 This is what USO looked like when I started this post.

 This is the accumulation of the stop-run on the Iran/Saudi news

Migration of the divergence

And a very strong 5 min chart.

Now...
Note momentum right after a brief stall at resistance.

I wish I had put this in the trading portfolio, maybe I will if there's a slight pullback to support, but I did add to the options that have gained quite a bit this morning.

There's a much larger bullish picture for USO we have been following for months, I think this is the door step to that much larger picture with a target in the $38+ area.

Gold vs. Equities

As I have shown about a half dozen times, gold is now moving almost exactly opposite equities, this is what I meant about what happened since I wrote about futures last night.

Gold is the candlesticks, ES is purple, the futures falling last night, or starting a "U" turn is seen at the red arrow then the halt after I went to bed, gold should have moved down, but it moved up just as if the equity futures where still falling...

A.M. Observations

I hope everyone is getting over their tryptophan/turkey induced hangovers.

Well apparently I lost a couple hours of sleep last night just to see futures halt their move to the downside and drift laterally to slightly higher, I'm guessing some at the NY F_E_D's Open Market's Desk also lost a few hours of sleep, it almost seems like they were reading our site or just looking at the same thing we did, I can imagine the call, "Get your butt in their and stabilize futures, it's Black Friday".

Do they really think that's going to keep JC PEnny, who might as well be Woolworth from their destiny? Or perhaps JC Penny will have a good Black Friday and become the Apple Store of retailers...oh, they tried that by hiring the master mind behind the Apple Stores only to promptly fire him when he couldn't turn get lines waiting outside the store like Apple Stores....Mission impossible. With today's "Brand " society, no kids are going to be buying anything from a store that has a "Penny" in their name, at least not until hip-hop stops rapping about spilling out some of their 40 oz. for their fallen homies and starts rapping about "Soda POP".

So what were the levers to save the Futures? Well they weren't the carry pairs...
None did any better than EUR/JPY in moving lateral and the Yen hasn't done much...

15 min Yen, lateral

The Euro had a little more trouble as the former 4 AAA rated Eurozone countries has now dropped to 3 and then there was 2 as Holland was kicked out of the AAA club last night after the S&P downgraded the Netherlands, Germany and Finland are the lone two survivors.

So  what else could it be, well without all the other traditional levers not even open yet, the NY F_E_D Desk looks to be the most probable, again just like Wednesday it's not that hard when volumes are that low and I'm glad to see several of you did some homework regarding the weighting of averages and noticed how the most heavily weighted were bought on Wednesday while most everything else languished, a trick we haven't seen in a while, but it's only affordable when volumes are low and it's inexpensive to do. Before that, it was only when POMO money went straight to those stocks, better known as momentum stocks in that era of about a year and a half ago that is passed by.

What other evidence might there be? German Bunds saw a flight to safety trade a they were the only game in town open at that hour.

Asia was mixed, it seems the late hour save may have been too late for Asian markets as they were mixed.

However the China Air Defense zone was not quiet overnight as they released a statement that 7 groups of 10 Japanese fighters entered the zone today possibly accompanied by two US surveillance planes, saber rattling on.

Perhaps that's why futures still look like this and gold (that now moves opposite stocks, was up overnight off the 12 a.m. hour lows...
 ES 1 min

NQ 5 min, still unchanged, it would take heavier flows to change that divergence

And R2K futures 5 min still look the same...

We shall see, but it will be much lower volume today than Wednesday with a half day.

Watch AAPL, that will tell you what's going on with the NY D_E_D or any of the top 5 Dow Components like Visa, IBM, Goldman Sachs, Boeing (hard to believe they'd move up) and IBM.


Futures

I hope everyone had a great Thanksgiving or if you don't celebrate Thanksgiving, then a great Thursday. Tomorrow the market is open half a day.

I got an email when I woke up that the EUR/JPY carry was no longer in retreat, it was heading up and futures were rising with it and honestly, I looked at it and really wasn't too concerned, there are very few major players left in the market right now, they'll be at the Hamptons until Monday morning, so some jiggling in futures as the cat is away and the futures play doesn't hold much water with me compared to the negative divergences and weight of the evidence against this market.

I took a look at futures a couple of hours ago, I wasn't even going to write anything tonight, but I noticed intraday 1 min charts acting...well, bearish.

So, as I am devoted to my members, I found something to do for a few hours as I'd rather be in bed so I could see what developed and I wasn't disappointed as the indicators have been pointing this way, even the tone of trade has been pointing this way.

First the move in the EUR/JPY that caused some concern among some members.

However I want to remind you of something, China's first response to BOJ policy and the hot money flows from Japanese and US QE flowing in to China and the inflation it brings, they aren't happy about it.

I don't think you'll read this anywhere else, it's my own observation, but Wednesday Japan was unable to jawbone the Yen much and I said, The Bank of Japan will have to take real action now instead of just talking about it to keep the Yen lower", I said this because the half life of BOJ jawboning has dropped dramatically.

Wednesday Japan broke out the big rhetoric and started talking about MORE QE, China obviously isn't going to like that.

What I have noticed is China's response to Japanese monetary policy has always been a military confrontation, sending ships in to Japanese waters, especially the Senkaku Islands that the two countries have a territorial dispute over.

A few days ago China created an "Air Defense Zone that reaches over the disputed islands as well as over other sovereign nations, the Chinese demand notification before any other country flies in to this zone, effectively telling the Japanese they must notify China if they are to fly to their own islands (at least in the world's eyes)

The US immediately challenged the zone by flying B-52 Bombers through it, also showing who the US is siding with (Japan).

It seems the testing of the Air Defense zone over the last few days by the US and Japan has caused China to step up the rhetoric saying Japan is "the prime target" and China's air force will train for a full confrontation...

 "We are willing to engage in a protracted confrontation with Japan. Our ultimate goal is to beat its willpower and ambition to instigate strategic confrontation against China."

You can read more here...

In any case, my point is simple, every time Japan has threatened China with more inflation via QE and killing the Yen, China has reacted in a military fashion. You may recall around the time Japan announced their monster QE, China had enraged all of its citizens and there was a boycott of all Japanese goods, there wasn't a Toyota dealership in the country that had not been vandalized in one form or another, I haven't seen anyone else come to this conclusion, but every time something happens in Japan regarding monetary policy that would effect China, I SPECIFICALLY WATCH FOR CHINESE MILITARY PROVOCATION AND HERE IT IS AGAIN AS JAPAN ANNOUNCES THEY MAY ADD TO THEIR QE PURCHASES.

So here's what I noticed tonight as I stayed up 3 hours longer...
 This is the EUR/JPY seeing a ramp up around 3 a.m. Wednesday

ES followed about an hour later in the wee hours of the morning on almost no volume.


I told you I saw something on the 1 min charts, I waited and this is what I found on the more important 5 min charts.
 ES 5 min strongly leading negative

NQ 5 min strongly leading negative, much of this damage has been in place for well over a week.

Russell 2000 Futures...

And the 60 min chart of R2K futures as the distribution has been heavy for a while, that just means there's a lot of it and it looks pretty darn serious.

As for the Nikkei futures, I thought they looked pretty good earlier this morning, but...
 The 3C divergence turns Nikkei right after it makes a weekly high, that's amazing divergence as 3C divergences usually saw 2 just like this before QE and then a move would happen, this is exactly that.

This is the longer, stronger 30 min chart as I have noted distribution often overnight in the Nikkei, but look how sharp that downturn is.

As the market has been making new highs on 0.10% gains on the day, I have said, "I would not buy anything long that is highly correlated to the market", my reason is I have seen days, weeks and even months of longs wiped out on an opening gap, it's just too dangerous.

We'll see what tomorrow brings, but I'm glad I stayed up to show you.