Monday, September 5, 2011

Miners Trading System

For several weeks now I've been talking about the build in positive divergences in DUST (one of our two trading vehiles for the Miners Trading system). As of tomorrow morning on the open, the signal in both systems 1 and 2 is long DUST on the open with a 3% stop loss from the opening price.

Here's the crossover...
The red line is the signal line, Green is system 1, light blue is system 2, both have crossed down signaling a long position in DUST.

As far as what DUST and the other trading vehicle, NUGT look like....

DUST
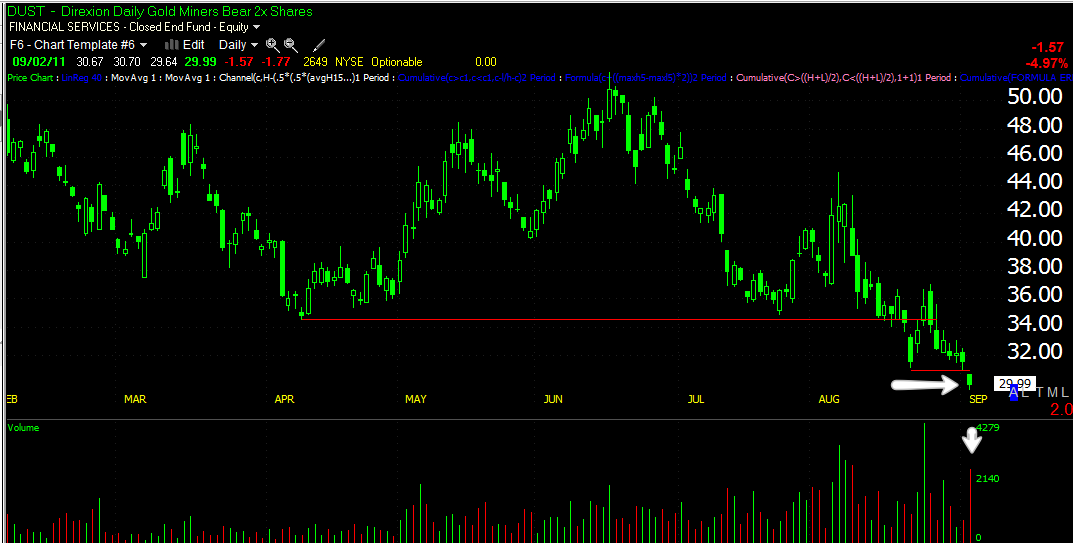
 DUST Daily chart makes what looks like a head fake low, breaking below local support and closing off the lows of the day on Friday.

 For some time I have commented on the seemingly large base DUST has been putting together, this important 60 min hart shows the last head fake above local resistance in to a negative divergence and then a positive leading divergence for 3 weeks or so. This would imply that DUST has been putting together a base bigger then the sum of the individual shorter term moves. The possibility/probability of a head fake on Friday makes it even more attractive as that is one of the last events we see before a reversal, but remember we have seen head fakes recently last as long as 3 days and in some cases even longer. Silver/SLV had a 3-day head fake which we anticipated before it even began when the bearish ascending wedge showed up with it's apex occurring around 8/18, we saw a 3 day move above that apex and then a move lower, lower then the apex of the wedge. That event in SLV is still playing out, the point is, technicians expected the exact opposite and we called the move higher before it even began...The predictability of technical analysis and Wall Street's response.

 DUST 30 min confirms the 60 min chart

 DUST 15 min is also confirming with a leading positive divergence even as DUST makes new lows.

 The 10 min hart shows a strong leading positive divergence on Friday in to a lateral trading range in a likely head fake environment.

 The 1 min 3C chart also showed some extreme momentum in making its positive leading divergence.

NUGT- To confirm the DUST findings, we would expect to see the exact opposite in NUGT.
 NUGT doesn't quite make a new high, but certainly blasts through local resistance on heavy volume on a day in which it closed off its highs.

 The 60 min chart is in a leading negative divergence-confrming what we saw in DUST with two moves higher in the white boxes, both in to negative divergences.

 The 15 min chart confirms the DUST 15 min hart and 3C makes a lower high then when prices were lower at 8/22.

 The 10 min chart is not only in a leading negative position, but the extent of Friday's negative divergence had a lot of downside 3C momentum in to another largely flat trading range.

Finally the 1 min chart is also confirming DUST and making a new low at higher highs.

All in all, I like the signal we are getting -DUST long on the open Tuesday a.m. with our standard 3% stop-loss if that is what you choose as part of your risk management.

The Week Behind-The Week Ahead

In Thursday night's Daily Wrap,  the conclusions for Friday were pretty clear,


"So do I think we are close to a reversal? I think we are at a reversal, just remember that typically there are more or just as many up days in a downtrend as down days, just the down days are a lot worse, so it won't be a straight line down in my opinion, just keep your eye on the bigger picture and not the intraday and daily gyrations."


"Luckily 3C has given us days if not a week's notice to put our portfolios together and in line with the trend. Now lets see where it goes."


Of course this wasn't one day of analysis that happened to be on cue, this is weeks of analysis that have been pointing to the same thing and thus far, every signal at every major turning event has played out. However, while we can see the underlying action and have an idea of what to expect next, we can never know how fast or slow Wall Street is accumulating, distributing, how big their respective positions are and what they have in store as a head fake.


My expectations have been to see this move down that actually started a few days ago toward the end of last week, but was certainly clear on Friday. My other expectation was to see Wall Street accumulate in to this drop, I was just surprised at the signals on Friday showing us how quickly they started accumulating, which to me would indicate a rally that will move up quite a bit further then most would expect and perhaps quite a bit sooner, after all, they usually let the market drop a bit before they start to accumulate.


I'm using the SPY as our proxy for the broad market (for newer members, I have found that divergences show up first, most reliably and most powerfully in the ETFs like the SPY rather then the underlying averages they track-I suspect this has to do with trader's expectations being manifested in the ETFs before the average moves as they do trade differently as far as volume and 3C signals go).


 This longer term 30 min chart contains the broad strokes, but the divergences on the longer term charts are also more important and hint at bigger moves then shorter intraday timeframes, although they don't usually have the same amount of detail. Here you can see the end of August negative divergence on the 30 min chart shaped up very quickly, telling us that distribution (which can include institutional selling and short selling) was heavy. Not only did we get a relative negative divergence at the red arrow, but an even stronger negative leading divergence in the red box (leading divergences are the strongest type). So in summary, we knew for some time that a sharp move was coming.

 The 15 min. chart above will often show us changes in trend on it's own, it has more detail as well. Here we see the first red arrow to the left telling us that on Wednesday of August options expiration, that we should expect a steep sell-off over the next few days. That sell-off, as predicted back then, was accumulated quickly at the white arrow-this is a mini cycle. The accumulated shares were sold off in to the end of August until the market reversed with no more underlying institutional support for this move up. Again, you can see how quickly this divergence developed and how sharp it was by going in to a leading negative position in the red box. This hart also shows newer members that it takes Wall Street some time to accumulate, as they do it quietly, not in huge volume spikes and once above their average accumulated position and at a profit, they start distributing the shares in to market strength/demand, which can take days/weeks, depending on how big their long position was. They don't offer the shares in big chunks because they would upset the supply/demand balance and send prices lower-THEY ALWAYS WANT TO SELL IN TO STRENGTH!

This 10 min 3C chart above is showing the 3C distribution BEFORE Friday, the chart ends at the close of Thursday and again, look how quickly we went from a negative divergence at the red arrow (distribution) to a leading negative divergence in the red box (VERY heavy distribution/short selling). Also note that accumulation/distribution usually are near the end during a flat market range. One of the last things we see 85% of the time before a 3C signal goes from accumulation or distribution to the actual price move that 3C is predicting is a false breakout. This false breakout adds more power to the move that is coming or creates a snow ball effect.


A month or two back I said, "I wouldn't be surprised to see some of the typical market correlations/inverse correlations to be turned on their head" and we have some evidence of that in multiple markets, but one I want to address is the FXA or Australian Dollar Trust ETF. For quite a while the FXA led the market through positive correlations, such as the FXA would show strength and the market weakness, it would lead to the market reverting toward the FXA.  That correlation has now just about flipped.


 Here's the FXA (daily) in green compared to the SPY in white. Note the head fakes in the FXA, this is totally different then what we observed for the last year or two. The head fake was a turning point down for the SPY at the first two in yellow and the last one shows the FXA with a bit more relative strength then the market right before the market turned down on Friday.

FXA vs the SPY, except I added 3C to the FXA (orange and this is a 30 min chart)  and look at the advance notice the divergences in the FXA provided us!  The FXA was negatively divergent at the first head fake in yellow, as well as the second and 3rd. So we now have a new, different correlation.

 Here's the same chart, except on a 15 min timeframe with more detail. The FXA showed the end of the early August downtrend with a white arrow (positive divergence), then warned about August options expiration with a negative divergence (red arrow) and then warned again about the market getting ready to fall last week with another red arrow. Remember the positive divergences seen in the market on Friday as the market moved lower in the SPY, DIA, QQQ and IWM? Well the FXA shows the same at the two white arrows to the far right. The correlation, as predicted over a month ago, has certainly flipped here.

Finally the more detailed 5 min 3C chart of FXA with the SPY in white. We see the FXA warning of distribution, there's the head fake in the yellow box as FXA breaks above local resistance with another negative divergence at the break out and now we see the relative positive divergence on Friday as FXA is considerably lower then 8/31, but 3C is considerably higher on a relative basis. This is helping to confirm the unexpected signals seen on Friday as the market moved lower, which suggests to me, "If they are willing to accumulate at these prices, they must be expecting a move to go substantially above these prices, even though the average accumulated position will be lower".


As for the expedited distribution recently before Friday's fall, in this article several members and myself all asked the same question on Thursday,  "Could 3C Be TeleGraphing Tomorrow's Non-Farm Payrolls?"


We'll never know for sure, but we have seen evidence of many leaked reports before and the distribution curve which went more and more parabolic, would suggest that the answer to that question is more then likely, "YES".


Lets not forget where we came from and where we expected to be heading as of a few weeks ago. While the particulars are always difficult, the main idea is still just as relevant today as t was several weeks ago.


On Wednesday, August 17th, the day before the market cracked and headed lower as we expected, I wrote this piece called, "Theory On How Op-Ex Friday Fits In To The Big Picture"


The idea was simple, looking at the options chain and the retracement n the market, shorts were at a place where they would be ITCHING to get short the market again, they just needed a reason. I wrote,


 "if Wall Street creates a SHARP sell-off between now and Friday, they wipe out most of the call contracts, the holders of Put options may be more likely to exercise their Puts then sell them if they see such a sharp sell-off. The long term 3 has been bullish, so if next week Wall Street runs the market up then the exercised Puts will be in a short squeeze and they effectively knock them out too on a Sharp rally."


That's exactly what happened for the most part.


Remember, FEAR and GREED move the market. The first move up from the August lows hit a common Fibonacci retracement of 38.2% from where the market really broke down, just what bears would look for. The red sell-off was August Op-Ex week (Thursday/Friday) so why wouldn't the Put holders exercise their Puts on what they thought was the next leg down, rather then just take profits up until Friday? So in this scenario, all of the large open interest calls were wiped out on Thursday and Friday, the following weak, the shorts and exercised Puts were caught in a short squeeze on the rally up-WE SAW EVIDENCE OF THE SHORT SQUEEZE!


In follow up posts I expected a "W" type bottom which s close to what the averages put n, many Industry Groups did exactly that with the head fake I thought they'd see. However, instead of a "W" bottom with a downside head fake, something else developed that would work just as well if not better, a Symmetrical triangle.


A Symmetrical triangle carries NO inherent bias unlike a descending triangle or an ascending triangle. The only way to decipher the bias is by looking at the preceding trend, which was down, which meant most traditional technical traders expected the triangle to fail to the downside, NOT to breakout of the triangle to the upside as it did! In Technical Analysis this would tell the shorts that the expected pattern failed and they would cover their shorts and even go long as a failed pattern often means you should take the opposite side of the trade. This did what we expected in the post above about options expiration and even set up many traders to be two-time losers as the breakout from the triangle apparently failed on Friday! My expectation has been that Wall Street would move pries low enough either into the triangle or slightly below the triangle-which could even include a new low. I believe with short interest at last tally at near record highs and margin also near record highs, it's just too irresistible to do whatever needs to be down to gain the confidence of the shorts. Seeing this triangle breakout and then presumably fail, would be a bearish signal and boost the confidence of the shorts. It just depends on how far prices need to be dropped to really gain their confidence and get them back in to the market on the short side, then once again (as far as our 3C readings go as of now), it looks like there will be a break neck short squeeze to the upside. This is where timing gets a little unclear and will LARGELY be determined by the Fed. Recently some Fed members and even one that dissented and was against QE3, came out last week hinting that they would support it! "IF" the Fed introduces QE3, our time spent on the upside could be months, however if Europe fails even faster then we think, the effects of QE3 will be mitigated. If the Fed disappoints for a 3rd time (First the FOMC meeting when everyone expected some statement about QE 3 and even an emergency statement before the FOMC meeting was concluded, the second time was a big disappointment at Jackson Hole, the 3rd time is scheduled for the September FOMC meeting) then our upside may be more limited, but I can see the range going from SPY $125 on the low end, to the $130's as an intermediate target and as high as new recovery highs-assuming the Fed does something that gets the bulls worked up. 


While the Fed is perceived to have disappointed on the last two occasions, as I reminded you MANY times, the expectations were set by Wall Street investment banks and simply parroted by the media, do you trust Wall Street? We still don't REALLY know what that Fed meeting on 7/29 with the Primary Dealers was about, but we know that the following market day is when the market fell apart and we know there's extraordinary cooperation between the PD's and the Fed.


On the other side of the coin-the "anti Wall Street/Media hype", how much did the Fed really disappoint Wall Street? We know what we are supposed to believe because Wall Street set the expectations. Wall Street said that if the Fed didn't do something at the FOMC meeting that the market would TANK. Instead, the market set off on its rally right after the last meeting. We were  told if the Fed didn't do something at Jackson Hole, the market would tank that day-did it?


What did Wall Street really get-remember, what they told you to expect is not what they expected and likely was just used against market participants. The Fed expanded their September meeting from1 day to 2, implying serious discussion of QE3. In the FOMC statement, the Fed created something the market longs for-CERTAINTY in announcing that they would hold ZIRP steady through 2013-something the market can bank on as the market hates uncertainty more then anything. So what seemed to be a disappointment (because of false expectations created by Wall Street) may actually have been more then they expected-the market certainly reacted that way.


So in my theory of what to expect, I was looking for a short squeeze after August options expiration, we got that, then a head fake down to pull shorts back in, it seems like we are in the midst of that now, and then a move up of an uncertain duration, and why do I think that? Because of the long term 3C charts, which represent the longer term trend and accumulation/distribution.


This is the longer term trend in the market averages on a 3C daily chart...


 DIA 1 day

 IWM 1 day

 QQQ 1 day

SPY 1 day


In each chart, you can see the negative divergences that sent the markets down, but now we have positive relative and leading divergences, that suggest the longer term market is setting up for a large upside move.


To give you some idea of the meaning of the strength, take a look at this indicator I created, which shows the magnitude of 3C divergences.
This shows the 2009 bottom accumulation to the left, distribution of what I call a bear market rally over the last 2 years and now look at how shallow the indicator is, indicating the most accumulation we have seen in over 2 years.


And a few influential Industry groups the market needs to rally...


 IYG-Financials

 XLE Energy

XLI Industrials


After what I suspect will be the next and last major move up, the market is in horrible shape and this move up should set up one of the nastiest falls the market has ever seen. Here's an example of the multi-day long term negative divergence...
Look at the size of the negative divergence at the 2007 top, then a positive divergence at the early 2009 bottom, now look how deep the negative leading divergence is currently, hitting all time new lows. When the second shoe drops, this will be one of the worst declines we have ever seen! I believe this is where unbelievable opportunity will arise as we will likely see the FIRST secular bear market in the history of equities. Whoever figures out how to trade this new environment first, will be way ahead of technical traders that haven't even adjusted to the changes in the market since the late 1990's!


As far as Tuesday and the week ahead...


As I already said, I think Wall Street will take the market as low as needed to get the shorts to commit, before shaking them out on a neck breaking rally/short squeeze, which in turn will set up the final "Second shoe to drop."


As I said last week, the market has almost as many up days and down days in a bear market, you must keep your eye on the trend and not on intraday and daily gyrations.


3C on Friday, even though we had a 3 day weekend ahead, seemed to indicate a gap higher or strength on Tuesday as there was short term accumulation. This is totally normal for a downtrend to have moves and gyrations up and down, just look at the 2008 fall in the market, there's no straight line down.


Here are Friday's charts suggesting some early strength this week...
 DIA 10 min leading positive divergence on Friday

 QQQ 5 min Leading positive divergence on Friday

 SPY 1 min leading positive divergence on Friday

 SPY 10 min leading positive divergence on Friday

SPY 15 min leading positive divergence on Friday


I'm going to have dinner, and then look at the market and if there's anything interesting, I'll put up another update.